Download to read offline
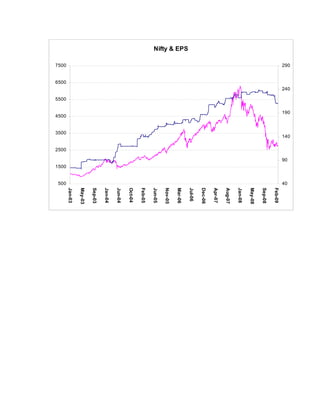
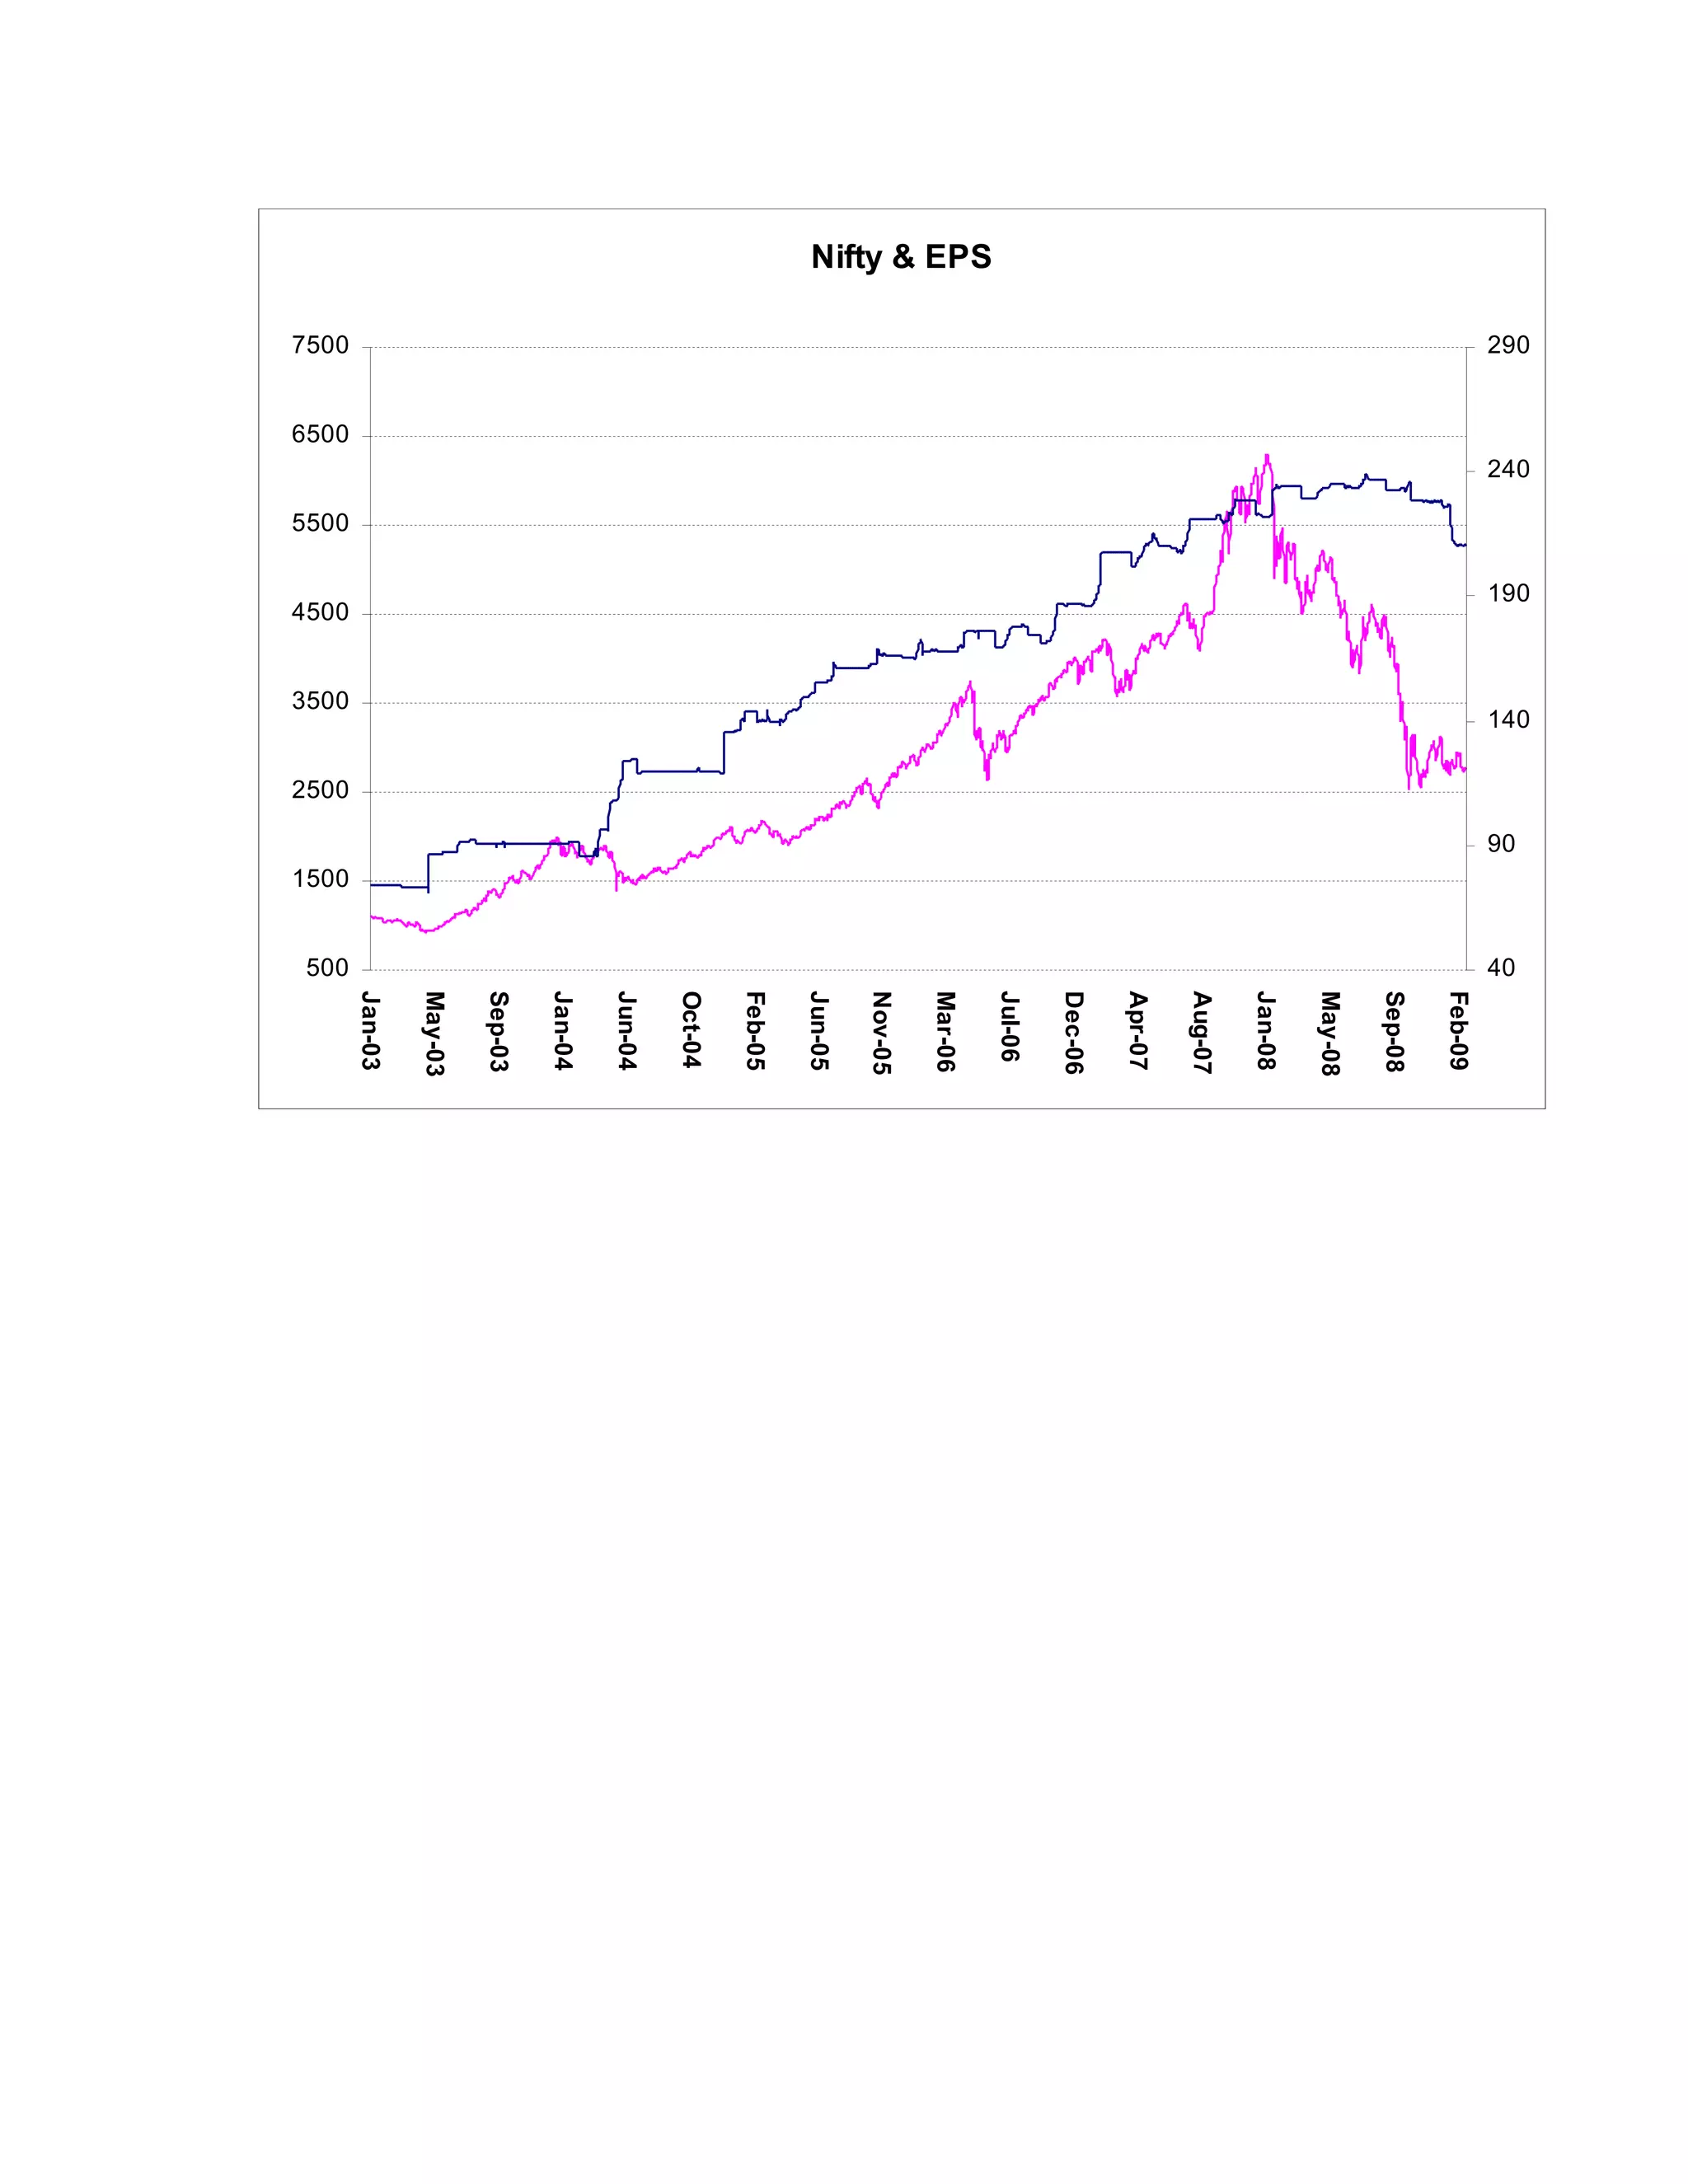
The document shows a line graph comparing the Nifty index and earnings per share (EPS) over time from January 2003 to February 2009. The Nifty steadily increased from around 1500 to over 7500 during this period while EPS also generally trended upward from around 40 to over 240, though with some fluctuations.


![CáLculo D[1]..](https://cdn.slidesharecdn.com/ss_thumbnails/clculod1-090302103950-phpapp02-thumbnail.jpg?width=640&height=640&fit=bounds)


