This document discusses optimizing the performance of a single-slope solar still that is linked to a mini solar pond. Four parameters were identified that influence the solar still's performance: 1) sodium chloride concentration level, 2) the zone of the mini solar pond, 3) the angle of a reflecting mirror at the bottom of the still, and 4) the angle of a mirror fitted in the pond. The Taguchi method was used to determine the best performing levels for each parameter. The results indicated that sodium chloride concentration at 3.5 kg, linking the still to the lower converting zone of the pond, a reflecting angle of 0° at the bottom of the still, and a mirror angle of 135° in the pond were the
![S.J.P. Gnanaraj, S. Ramachandran / Desalination and Water Treatment 80 (2017) 27–4028
area and glass angle. The solar intensity, velocity of wind,
ambient temperature dust and cloud ambient condition are
metrological parameters, and they cannot be controlled. The
other factors can be varied to optimize the performance of
the still.
The parameters we choose to optimize the performance
of the still will perform differently at different levels. The
success of solar distillation depends on the selection of the
best performing level in each parameter. Taguchi method
helps to identify the best performing levels of the parameters
we choose to optimize the performance of the still.
The objective of this study was to optimize the perfor-
mance of the solar pond linked solar still assisted by mirrors
at the top of the pond and at the bottom of the still. With
the help of Taguchi method the best performing levels of
the parameters that influence the performance of the still
were identified. By combining the best performing levels,
the experiment was conducted, and the experimental results
were compared with the theoretical values.
The factorial experimentation is very useful in research
work. It is based on strong and sound statistical foundation.
But this technique becomes unmanageable in the industrial
contexts. With increase in the number of factors and the lev-
els, the number of experiment would be large. To solve this
issue, statisticians have developed factorial replicate designs
(fractional factorial designs). But this requires good statistical
knowledge on the part of experimenter, and it is subject to
some constrains that limit the applicability.
Dr. Genichi Taguchi, a Japanese scientist contributed sig-
nificantly to the field of quality engineering. According to
him the product design should be such that the performance
is insensitive to uncontrollable (noise) factors. The orthog-
onal arrays (OAs) are suggested by Taguchi for designing
the experiments. The main advantage of these designs lies
in their simplicity and easy adaptability to complex experi-
ments involving number of factors with numbers of levels.
The desired information can be obtained with minimum
number of trails.
El-Sebaii et al. [1] integrated a single-slope single-basin
solar still with a shallow solar pond, and the productiv-
ity was increased by 52.36%. Appadurai and Velmurugan
[2] integrated a fin type solar pond with a fin type solar
still, and the distillate output was increased by 50%.
Malaiyappan and Elumalai [3] used a semipermeable
membrane, and a solar pond to enhance the productivity
of a single-slope single-basin solar still. Velmurugan and
Srithar [4] concluded that the average distillate productiv-
ity of a mini solar pond integrated solar still with sponge
was 57.8% more than the productivity of ordinary still. It
was found that the optimum value of salt concentration in
mini solar pond is 80 g/kg. Velmurugan et al. [5] evaporated
industrial effluent with the help of a fin type single-basin
solar still and a stepped solar still and integrated mini solar
pond with these stills. When mini solar pond, pebbles,
sponges and fins were used in stepped solar still, maxi-
mum productivity was achieved. Velmurugan and Srithar
[6] concluded that mini solar pond increased the produc-
tivity of a solar still by around 59%. Tamini [7] modified
the solar still with internal and external reflecting mirrors,
and the efficiency was increased by 20%–30%. Al-Hayek
and Badran [8] compared single-slope solar still, fitted with
reflecting mirror and double slope solar still without any
modifications. The single-slope still with modification was
20% more efficient. El-Swify and Metias [9] fabricated two
solar stills of the same dimensions – one was conventional
type which produced an efficiency of 22%, the second one
was modified by adding reflecting mirror which resulted in
an efficiency of 83%. Prakash and Velmurugan [10] modi-
fied the solar still by fitting two reflecting mirrors. The effi-
ciency was 29.2% with reflectors alone, the efficiency was
38.68% with combination of reflectors and gravel, and the
efficiency was 41.6% with combination of reflectors and
pebbles. Tanaka [11] used internal and external reflectors
in basin type solar still, and productivity was increased by
70%–100% on winter days. Omara et al. [12] used internal
and external mirror in a stepped still, and the performance
of the modified stepped solar still was compared with the
conventional still. The performance of the modified stepped
still increased approximately by 125%. Abdallah et al. [13]
modified the conventional solar still by installing reflecting
mirrors on all internal sides. The flat basin was replaced
by a stepwise basin, and the performance was enhanced
up to 180%. Omara et al. [14] fixed mirrors in the vertical
side of the steps of a stepped solar still, and the productiv-
ity of the modified stepped solar still was higher than the
conventional still approximately by 75%. Tanaka [15] found
that the productivity of the solar still could be enhanced
throughout the year by changing the angle of the external
reflectors. Gupta and Singh [16] used Taguchi and ANOVA
method to investigate the effect of process parameters on
productivity. Water temperature and salt concentration
were significant parameters influencing the productivity.
Singh and Francis [17] used Taguchi technique to find out
the effect of temperature and inclination angle on the per-
formance of the solar still. Both inclination angle and water
temperature were found to be significant factors. Verma et
al. [18] employed Taguchi method to establish the optimal
set of parameters for passive slope solar still. The experi-
ment concluded that water temperature and glass tempera-
ture were important for optimizing the production. Refalo
et al. [19] integrated the solar chimney and condenser with
the solar still, and the distillate output was increased from
4.7 to 5.11 L/m2
d. Tanaka [20] concluded that the daily
amount of distillate produced by a tilted wick solar still
could be increased by using a flat plate bottom reflector.
Alaudeen et al. [21] tested a single-slope solar still of glass
basin with different heat storage materials in it. The per-
centage increase in output when corrugated sheet was used
as basin material was nearly 34% higher than the conven-
tional still. Maiti et al. [22] fitted a stepped solar still with
north south reflectors in V-trough assembly and achieved
twofold increase in distilled water production from concen-
trated seawater. Boodhan and Haraksingh [23] fabricated
a cascade type solar still and studied the effect of different
glass cover thickness and different solar still orientations
on productivity. A 4.76-mm thick glass cover facing south
produced the highest yield. Arjunan et al. [24] attempted
to increase the productivity of a solar still by increasing
temperature difference between water and glass. They used
sponge liners at the inner wall surface. The optimum thick-
ness of the sponge liner was 5 mm, and the yield was 35.2%
higher than the conventional still.](https://image.slidesharecdn.com/80201727-190913144918/85/80-2017-27-2-320.jpg)
![29S.J.P. Gnanaraj, S. Ramachandran / Desalination and Water Treatment 80 (2017) 27–40
2. Experimental setup
For conducting the experiment, a single-slope solar
still was fabricated. The dimension of the solar still was
0.9 m × 0.7 m × 0.4 m, and it was fabricated using galvanized
iron. The solar still was placed inside the wooden box, and
gap between the solar still and wooden box was filled by
heat resistant materials. The top of the solar still was cov-
ered by 4 mm thick glass, and it was placed at an angle of
11°. Proper arrangements were also made for collecting
distilled water.
Adjacenttothesolarstill,aminisolarpondwasconstructed.
Upper dimension of the solar pond was 45 cm × 45 cm. The
lower dimension of the pond was 30 cm × 30 cm. The height
was 150 cm. Sodium chloride mixed water was poured into
the solar pond. Arrangements were made for connecting the
solar still with mini solar pond at three different levels. For
this purpose copper heat pipe was used. It was linked at 25 cm
(lower converting zone [LCZ]), 75 cm (middle converting zone
[MCZ]) and 125 (upper converting zone [UCZ]). Sodium chlo-
ride concentration in the water was varied, and the experiment
was conducted at 1.5, 2.5 and 3.5 kg levels. A reflecting mirror
was placed below the solar still to focus solar radiation into
the basin. The angle of the mirror was adjusted at three levels:
–15°, 0°and 15°. Another reflecting mirror was fitted at the top
of the solar pond. The angle of the mirror was adjusted at three
levels: 90°, 113° and 135°. The experimental setups used in the
experiment are given in Figs. 1–5.
The experiment was conducted at Villianur, Pondicherry,
India (11.9310° N, 79.7852° E). At 8.00 a.m. 6 L of water was
poured into the solar still. As per the OA, the experiments
were conducted. The distilled water collected was measured
at 6.00 p.m., and it was recorded for further analysis.
3. Theoretical analysis
Daily efficiency of the solar still and the temperature of
pond at various zones are calculated theoretically.
3.1. Energy balance equations for single-basin solar still
The energy balance equations for the basin plate, water
mass and glass cover of the single-basin solar still can be
written as follows.
3.1.1. For basin plate
The solar energy received by the basin plate (Ab
×ABb
× Hs
)
is equal to the summation of the energy gained by the basin
plate m c
T
b pb
b
× ×
d
dt
, side losses (Qloss
) and energy lost by con-
vective heat transfer between the basin and water (Qc,b–w
) [4,5].
A AB H m c
dT
Q Qb b s b pb
b
c b w
× ×( ) = × ×
+ + −
dt loss ,
(1)
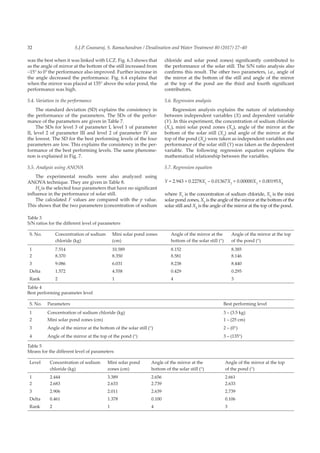
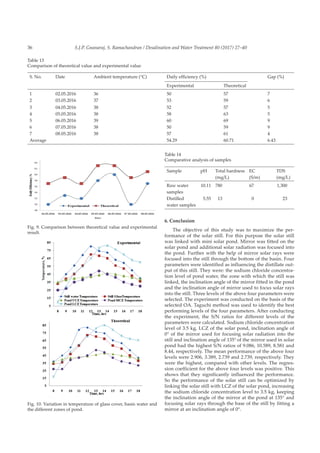
Fig. 1. Schematic diagram of the experimental setup.
(a)
(b)
Fig. 2. (a) Solar still and (b) mini solar pond.
Fig. 3. Integration of solar still and solar pond at UCZ.](https://image.slidesharecdn.com/80201727-190913144918/85/80-2017-27-3-320.jpg)
![S.J.P. Gnanaraj, S. Ramachandran / Desalination and Water Treatment 80 (2017) 27–4030
3.1.2. For water mass
The summation of the solar energy received by the
water in the basin (Aw
× ABw
× Hs
), convective (Qc,b–w
), radi-
ative (Qr,b–w
) heat transfer between basin and water is equal
to the summation of energy lost by convective heat trans-
fer between water and glass (Qc,w–g
), radiative heat transfer
between water and glass (Qr,w–g
), evaporative heat transfer
(Qe,w–g
) between water and glass and energy gained by the
saline water ( m c
dT
w pw
w
× ×
dt
) [4,5].
A H Q Q
m c
T
dt
Q Q=
w w s c b w r b w
w pw
w
c w g r w g
× ×( )+ +
× ×
+ +
− −
− −
AB
d
, ,
, ,
++ −
Qe w g,
(2)
3.1.3. For glass cover
The summation of solar energy gained by the glass
cover from sun (Ag
× ABg
× Hs
), convective (Qc,w–g
), evapora-
tive (Qe,w–g
) and radiative (Qr,w–g
) heat transfer from water to
glass is equal to the summation of energy lost by radiative
heat transfer between glass and sky (Qr,g–sky
), convective heat
transfer between glass and sky (Qc,g–sky
), evaporative heat
transfer between glass and sky (Qe,g–sky
) and energy gained by
glass m c
T
tg pg
g
× ×
d
d
[4,5].
( ) , , ,
,
A H Q Q Q
m c
T
t
Q=
g g s c w g e w g r w g
g pg
g
c g
× × + + +
× ×
+
− − −
AB
d
d −− − −
+ +sky sky sky
Q Qr g e g, ,
(3)
3.2. Calculation of absorption values (AB)
The absorption value for glass cover can be written as:
ABg
= −α ρg g
(1 )
(4)
The absorption value for water mass can be written as:
AB ABw w g g
= −α ρ( )1−
(5)
The absorption value for basin plate can be written as:
AB AB ABb g wg g
= α ρ( )1− − − (6)
Initially the water temperature, basin temperature and
upper, lower glass temperature are taken as ambient tem-
perature. The change in water temperature (dtw
), basin tem-
perature (dtb
) and glass temperature (dtg
) are noted.
For next time, the parameters are redefined as:
T = T + Tw w w
d (7)
T = T Tg g g
+ d (8)
T = T Tb b b
+ d
(9)
These values are substituted in Eqs. (1)–(3). By using the
MATLAB program, the corresponding equations are solved.
The transient energy gained by the single-basin solar
still = the energy rise from direct heating of sun + the energy
received from pond.
3.3. Calculation of productivity
m
Q T T
he
e w g w g
fg
=
× −−,
( )
(10)
The total day production of single-basin solar still is
given by:
M me e
= ∑8
18
3.4. Daily efficiency
The daily efficiency of the single-basin still is expressed as:
η
∆ ∑
=
× ×
×
M h
A T H
e fg
b s
100 (11)
The different parameters used in the above equations
(Eqs. (1)–(11)) are calculated using the formulas given in
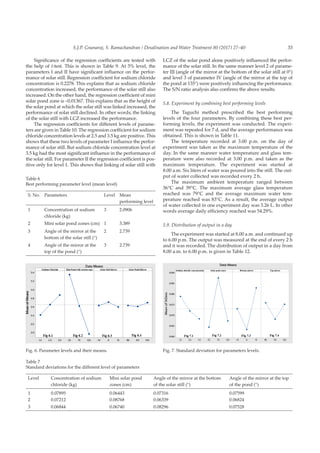
Fig. 4. Integration of solar still and solar pond at MCZ.
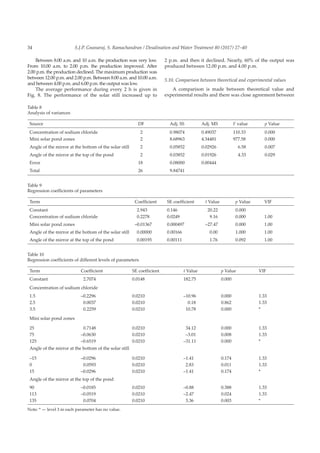
Fig. 5. Integration of solar still and solar pond at LCZ.](https://image.slidesharecdn.com/80201727-190913144918/85/80-2017-27-4-320.jpg)
![37S.J.P. Gnanaraj, S. Ramachandran / Desalination and Water Treatment 80 (2017) 27–40
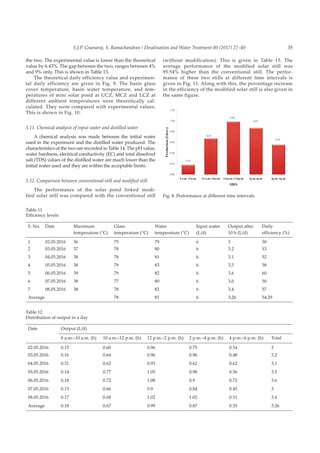
By combining the best performing levels of the above
four parameters, the experiment was conducted using the
solar pond linked still. As a result the distillate output col-
lected in one experiment day was 3.26 L. The daily efficiency
achieved was 54.29%. Compared with the conventional still,
the performance was higher by 95.54%. The distillate output
was recorded for every 2 h. The distillate yield was low from
8 a.m. to 10 a.m. The maximum production was obtained
between 12 p.m. and 2 p.m. Nearly, 60% of the yield was pro-
duced between 12 p.m. and 4 p.m.
To conclude, Taguchi method is best suited to select the
best performing levels of parameters that influence distillate
output. This will enable us to attain the optimum perfor-
mance level.
Symbols
A — Area, m2
AB — Absorption (with indices for different surfaces)
cp
— Specific heat capacity, J/kg °C
H — Solar intensity, W/m2
m — Mass, kg
h — Heat transfer coefficient, W/m °C
P — Partial pressure, N/m
Q — Heat transfer rate, W
T — Temperature, °C
Ub
— Heat loss coefficient from basin to ambient, W/m2
°C
hfg
— Latent heat of water, J/kg K
V — Wind velocity, m/s
dT — Temperature difference, °C
dt — Differential time, s
UCZ — Upper converting zone
MCZ — Middle converting zone
LCZ — lower converting zone
S/N — Signal-to-noise ratio
SD — Standard deviation
Me
— Daily condensate
Kw
— Thermal conductivity, W/m K
L — Length of pond, m
h(z) — Solar radiation penetrating depth z in the pond
Greek
α — Absorptivity
σ — Stefan–Boltzmann constant (5.6697 × 10⁻⁸
W/m2
K4
)
Δ — Difference
ε — Emissivity
ƞ — Daily productivity
Subscripts
a — Ambient air
b — Basin
c — Convection
e — Evaporation
g — Glass
loss — Side loss
r — Radiation
w — Water
ANOVA — Analysis of variance
DF — Degrees of Freedom
SS — Sum of Squares
MS — Mean square
SE — Standard Error
VIF — Variance Inflation Factor
References
[1] A.A. El-Sebaii, M.R.I. Ramadan, S. Aboul-Enein, N. Salem,
Thermal performance of a single-basin solar still integrated
with a shallow solar pond, Energy Convers. Manage., 49 (2008)
2839–2848.
Fig. 11. Comparison of daily yield and productivity rise.
Table 15
Comparison between conventional and modified still
S. No. Date Ambient temperature (°C) Conventional still yield (kg) Still with pond yield (kg) Daily efficiency rise (%)
1 02.05.16 36 1.5 3 100.00
2 03.05.16 37 1.7 3.2 88.24
3 04.05.16 38 1.7 3.1 82.35
4 05.05.16 38 1.8 3.5 94.44
5 06.05.16 39 1.9 3.6 89.47
6 07.05.16 38 1.4 3 114.29
7 08.05.16 38 1.7 3.4 100.00
Average 1.9 3.26 95.54](https://image.slidesharecdn.com/80201727-190913144918/85/80-2017-27-11-320.jpg)
![S.J.P. Gnanaraj, S. Ramachandran / Desalination and Water Treatment 80 (2017) 27–4038
[2] M. Appadurai, V. Velmurugan, Performance analysis of fin type
solar still integrated with fin type mini solar pond, Sustain.
Energy Technol. Assess., 9 (2015) 30–36.
[3] P. Malaiyappan, N. Elumalai,Asymmetrical solar still coupled with
the mini solar pond: performance evaluation on clear, partially
cloudy and cloudy days, Appl. Mech. Mater., 787 (2015) 22–26.
[4] V. Velmurugan, K. Srithar, Solar stills integrated with a
mini solar pond — analytical simulation and experimental
validation, Desalination, 216 (2007) 232–241.
[5] V. Velmurugan, J. Mandlin, B. Stalin, K. Srithar, Augmentation
of saline streams in solar stills integrating with a mini solar
pond, Desalination, 249 (2009) 143–149.
[6] V. Velmurugan, K. Srithar, Prospects and scopes of solar pond:
a detailed review, Renew. Sustain. Energy Rev., 12 (2008)
2253–2263.
[7] A. Tamini, Performance of a solar still with reflectors and black
dye, Sol. Wind Technol., 4 (1987) 443–446.
[8] I. Al-Hayek, O.O. Badran, The effect of using different designs of
solar stills on water distillation, Desalination, 169 (2004) 121–127.
[9] M.E. El-Swify, M.Z. Metias, Performance of double exposure
solar still, Renew. Energy, 26 (2002) 531–547.
[10] P. Prakash, V. Velmurugan, Experimental analysis of a solar still
with reflectors and sensible heat storage mediums, Appl. Mech.
Mater., 787 (2015) 107–111.
[11] H. Tanaka, Experimental study of a basin type solar still with
internal and external reflectors in winter, Desalination, 249
(2009) 130–134.
[12] Z.M. Omara, A.E. Kabeel, M.M. Younes, Enhancing the stepped
solar still performance using internal and external reflectors,
Energy Convers. Manage., 78 (2014) 876–881.
[13] S. Abdallah, O. Badran, M.M. Abu-Khader, Performance
evaluation of a modified design of single slope solar still,
Desalination, 219 (2008) 222–230.
[14] Z.M. Omara, A.E. Kabeel, M.M. Younes, Enhancing the stepped
solar still performance using internal reflectors, Desalination,
314 (2013) 67–72.
[15] H. Tanaka, Monthly optimum inclination of glass cover and
external reflector of a basin type solar still with internal and
external reflectors, Sol. Energy, 84 (2010) 1959–1966.
[16] P. Gupta, N. Singh, Investigation of the effect of process
parameters on the productivity of single slope solar still:
a Taguchi approach, Int. J. Curr. Eng. Technol., 4 (2015)
320–322.
[17] N. Singh, V. Francis, Investigating the effect of water
temperature and inclination angle on the performance of single
slope solar still: a Taguchi approach, Int. J. Eng. Res. Appl., 3
(2013) 404–407.
[18] V.K. Verma, I.S. Rout, A.K. Rai, A. Gaikwad, Optimization
of parameters affecting the performance of passive solar
distillation system by using Taguchi method, IOSR J. Mech.
Civil Eng., 7 (2013) 37–42.
[19] P. Refalo, R. Ghirlando, S. Abela, The use of a solar chimney and
condensers to enhance the productivity of a solar still, Desal.
Wat. Treat., 8 (2015) 1–14.
[20] H. Tanaka, Optimum inclination of still and bottom reflector for
tilted wick solar still with flat plate bottom reflector, Desal. Wat.
Treat., 51 (2013) 6482–6489.
[21] A. Alaudeen, S.A. Abu Thahir, K. Vasanth, M.I.A. Tom, K.
Srithar, Experimental and theoretical analysis of solar still with
glass basin, Desal. Wat. Treat., 54 (2015) 1489–1498.
[22] S. Maiti, C. Bhatt, P. Patel, P.K. Ghosh, Practical and sustainable
household seawater desalination using an improved solar still,
Desal. Wat. Treat., 57 (2016) 3358–3371.
[23] M.K. Boodhan, I. Haraksingh, An investigation into the effect
on the productivity of cascade-type solar distillation systems
with varying cover thicknesses and still orientations under
tropical Caribbean climatic conditions, Desal. Wat. Treat., 55
(2015) 3295–3302.
[24] T.V. Arjunan, H.S. Aybar, N. Nedunchezhian, Effect of sponge
liner on the internal heat transfer coefficients in a simple solar
still, Desal. Wat. Treat., 29 (2011) 271–284.](https://image.slidesharecdn.com/80201727-190913144918/85/80-2017-27-12-320.jpg)
![39S.J.P. Gnanaraj, S. Ramachandran / Desalination and Water Treatment 80 (2017) 27–40
Appendix 1
The following equations are used for the theoretical
calculation. They are referred from references [4,5].
For single-basin still:
Q h A T Tc b w c b w b b w, ,
( )− −
= × × −
Q U A T Tb b bloss sky
= × × −( )
Q h A T Tc w g c w g w w g, ,
( )− −
= × × −
h T T
P P T
P
c w g w g
w g w
w
,
/
.
( )( )
.
−
= − +
− +
× −
0 884
273
0 2665 103
1 3
Q h A T Tr w g r w g w w g, ,
( )− −
= × × −
h
T T
T Tr w g eff
w g
w g
,
.
. ( . )
( )−
= × ×
+( ) − +
−
ε σ 0 999
273 12 273 12
4 4
Q h A T Te w g e w g w w g, ,
( )− −
= × × −
h
M h p
M c p p p p
he w g
w fg t
a pa t w t g
c w g, ,
( )( )− −
=
× ×
× − −
1
Q A T Tr g g g g,
( . ) ( . )−
= × × + − +
sky sky
ε 273 12 273 124 4
Q h A T Tc g c g g g, ,
( )− −
= × × −sky sky sky
h Vc g,
.−
= +sky
2 9 3
∈
∈ ∈
= + −
−
eff
ug
1 1
1
1
lg
T Tasky
= − 6
T
A h z H
K T
L
m c A k
L
s s
w a
p p p w
LCZ
mcz
mcz
dt
=
+
+
( )
T
A h z H
K T
L
m c A k
L
s s
w a
p p p w
MCZ
ucz
ucz
dt
=
+
+
( )
T
A h z H
K T
L
m c A k
L
s S
w a
p p p w
UCZ
upper
upper
dt
=
+
+
( )
T
h h T AB H h T
hw
c g c g w b w s c g a
c g w
=
+ − −− − −
−
( ) ( ) ( ), , ,
,
sky sky
T
H h T h T
h hg
g S c g w w c w b w
c w b c g w
=
+ +
+
− −
− −
( ) ( ( )
( )
), ,
, ,
AB
P T Tw w
= − +7235 431 45 10 76 2
. .
h Tfg W
= −( . . )2503 4 2 398 1000](https://image.slidesharecdn.com/80201727-190913144918/85/80-2017-27-13-320.jpg)