SlideShare a Scribd company logo
1 of 16
Download to read offline
(2021)
69
-
4
, vol. 3(76), No 2, p. 5
dicine
Journal of Life Sciences & Biome
54 http://dx.doi.org/10.29228/jlsb.22
Available online 30 December 2021
Mapping of LC/LU changes inside the Aghdam district of the Karabakh
economics region applying object-based satellite image analysis
A.A. Rasouli1
, M.M. Asgarova2
*, S.H. Safarov3
1
Department of Environmental Sciences, Macquarie University, 12 Wally's Walk, North Ryde, Sydney,
Australia
2
Faculty of History and Geography, Azerbaijan State Pedagogical University, 104 Hasan Aliyev Str.,
Baku AZ1072, Azerbaijan
3
Institute of Geography, Azerbaijan National Academy of Sciences, 115 H. Javid Ave., Baku AZ1143,
Azerbaijan
*For correspondence: matanat_askerova@mail.ru
Received: September 29, 2021; Received in revised form: October 07, 2021; Accepted: October 09, 2021
Identification of the environmental consequences of the 30-year occupation of Karabakh and its ad-
jacent territories by the Armenian armed formations is an important and urgent research task. Ob-
ject-Based Image Analysis (OBIA) procedures were accordingly applied to examine the condition
and changes in landcover and landuse (LC/LU) in the territories of Karabakh liberated from Arme-
nian occupation within the Aghdam District. Firstly, Dynamic Thresholds Indexing (DTI) algorithms
were operated to display the main LC by developing several spectral NDWI, NDVI, NBRI, and AVBI
indices. At the next step, to recognize precise LU changes inside the study area, a rule-based Nearest
Neighbour Classify (NNC) was considered by accompanying an advanced supervised classification
technique within the Trimble eCognition setting (eCognition Developer, 2019). DTI results indicated
that from 2016 to 2021 inside the Aghdam District, LC changes are quite meaningful. A significant
decrease in vegetated cover (10.2 %), increases in the non-vegetated area (11.8 %), and the most
noticeable changes are observed in vulnerable lands of about 45.1 km2
(26.8 %). Subsequently, the
rule-based NNC method approved various negative LU changes inside the study area that had oc-
curred predominantly to the mixed forest-pasture classes (9.8 %). Besides, the areas of degraded
lands have increased by 35 % and barren lands by 4.4 % according to the study. It should be noted
that water and agricultural LU demonstrate the least changes overall of 3.4 % and 0.3 %, respec-
tively. The overall accuracy of 0.95 and Kappa statistics of 0.93 confirmed the significant changes in
the final LC/LU productions. Consequently, accurate image processing and mapping of the current
situation of the liberated regions of Azerbaijan have to be the most urgent tasks of the geographers,
ecosystem scientists, and remote sensing specialists prior to the start of reconstruction and rehabili-
tation projects by government officials and decision-makers.
Keywords: Aghdam district, Karabakh region, LC/LU changes, sentinel-2 imagery, OBIA-based dynamic
and threshold indexing, NNC supervised classification
INTRODUCTION
Occupying the territory of neighboring coun-
tries can have serious catastrophic social, eco-
nomic, and, of course, geographical, and ecologi-
cal consequences (General Assembly Security
Council, 2009). One of the vital consequences of
the occupation of the Karabakh districts by Arme-
nia had had significant changes in LC/LU types;
and other environmental features of the region
(Scheffer, 2010). Although the terms land cover
and land use are often used interchangeably, their
actual meanings are quite distinct. LC refers to the
surface cover on the ground, whether vegetation,
urban infrastructure, water, bare soil, or others.
Mapping of LC/LU changes inside the Aghdam district of the Karabakh economics region
55
Identifying, delineating, and mapping LC is im-
portant for large-scale monitoring studies, resource
management, and planning activities. Identifica-
tion of LC establishes the baseline from which
monitoring activities (change detection) can be
performed and provides the ground cover infor-
mation for baseline thematic maps. Nevertheless,
LU refers to the purpose the land serves, for exam-
ple, recreation, wildlife habitat, or agriculture. LU
applications involve both baseline mapping and
subsequent monitoring, since timely information is
required to know what current quantity of land is
in what type of use and to identify the LU changes
from year to year (Rasouli et al., 2021a). This
knowledge will help develop strategies to balance
conservation, conflicting uses, and developmental
pressures. Issues driving LU studies include the re-
moval or disturbance of productive land, urban en-
croachment, and depletion of grasslands and for-
ests. Accordingly, it is very important to distin-
guish this difference between LC and LU, and the
timely updated information that can be ascertained
from each. The properties measured with remote
sensing imagery relate to LC, from which LU can
be inferred, particularly with a priori knowledge
obtained by advanced image processing techniques
(Kato, 2020).
With high confidence, we believe that the fun-
damental driving force of LC/LU changes in the
Karabakh Economics Region is related to tem-
poral-spatial processes caused by war activities
such as the compulsory seizure of agricultural and
livestock activities, along with the destruction of
rare forests (Hasanov et al., 2017). Moreover, we
should consider the uncontrolled erosion of soil,
pasture, and unique historical monument buildings
destruction caused by unprincipled mining activi-
ties, multiple bombings, and land-mine landings
within the occupied territories of Azerbaijan (Con-
flict and Environment Observatory, 2021). Remote
sensing makes it possible to collect data by sensing
and recording reflected or emitted energy and pro-
cessing, analyzing, and production of a variety of
practical information in various fields (Lillesand et
al., 2004). Through this modern technology, large
amounts of row data and information in the form
of digital satellite images are prepared and made
available to researchers (Khandelwal et al., 2014a;
Copernicus, Sentinel-2, 2020). Up to now, many
different methods have been developed in the pro-
cessing data obtained from remote sensing technol-
ogy, each with its advantages and limitations. To
detect the LC/LU situations over time, advanced
OBIA methods could be applied to analyze post-
war changes, focusing on the interesting areas. To
date, several methods have been proposed in the
process of producing LC/LU maps through satel-
lite image processing, as it could be regarded as the
science and art of acquiring information about the
Earth's surface without being in contact with it
(Franklin and Wulder, 2002). Accordingly, in the
last few decades, a wide range of image processing
procedures, especially focusing on DTI and dis-
similar NNC methods are provided, each with its
own goals, strengths, and weaknesses (Nelson and
Khorram, 2018).
Methods of extracting information through
the indexing of satellite images have been common
for many years, among these, may refer to NDVI
and NDWI indicators with their advantages and
limitations (Thenkabail et al., 2018). In recent
years, intending to overcome the limitations of tra-
ditional methods in the processing of satellite im-
ages, new indexing methods have been introduced
to high-light land surfaces such as vegetation
cover, soil, and water bodies, by addressing a com-
bination of fuzzy and thresholding methods (Ra-
souli et al., 2020). Traditionally, two indexes of
NDVI and NDWI are well-known and widely used
land-cover indicators (Rehman and Hussain,
2018). Nevertheless, there are other effective in-
dexes such as NBRI and AVBI for better quantify-
ing of vegetation and soil conditions and more im-
portantly the rate of risk and vulnerability of LU
types by war actions, fire events, and other destruc-
tive human activities (Pettorelli, 2013). Of course,
the use of these indicators is associated with some
limitations such as not recognizing and separating
vegetation accurately, or mixing wetlands with wa-
ter bodies. Nevertheless, it is possible that to justify
and reduce such limitations by imposing rule-
based thresholding methods and processing high-
resolution satellites such as Sentinel-2 imagery
(Sentinel-2 MSI User Guides, 2020).
In a more precise step of satellite image pro-
cessing, the NNC method could be used based on
fuzzy classification functions to classify image ob-
jects with more than one LU class (Khatami et al.,
2016). NNC must be regarded as an advanced
Rasouli et al.
56
method in object-based classification that comes
close to its capability to classify high spatial reso-
lution Sentinel-2 images. The reason is that we
have the advantage of using intelligent image ob-
jects with multiresolution segmentation in combi-
nation with a supervised classification outline. This
allows researchers to select samples for each LU
class, by defining some criteria (rule-based algo-
rithms) for classification procedure inside the
eCognition software that classifies all objects seg-
mented in the image (eCognition Reference Book,
2019). Before this stage, a Multi-Resolution Seg-
mentation (MRS) must be fined that aggregates
spatial information into groups that finds logical
objects in the satellite RGB combined imagery
(Baatz and Schape, 2000). For example, MRS pro-
duces thin and long objects for water channels or
roads, and it creates square objects of varying
scales such as lakes or agricultural fields in the
combined imagery bands of blue, green, red, infra-
red, and so on. To run any MRS procedure there is
a need to define a few criteria parameters such as
Scale Shape, and Compactness to get ideal image
objects. As a rule of thumb, it is possible to produce
image objects at the biggest possible scale, but fur-
thermore, be able to discern between objects. By
selecting training samples and a well-represented
number of samples for assigned LU classes (such
as forest, pasture, agricultural, and water surface)
the classification process could be run based on the
objects. The selected samples and the defined sta-
tistics expecting to reach the NN classification pro-
duce the final products, even though there are still
a couple of options to improve the accuracy
(Foody, 2002).
The authors believe that, after the liberation of
the occupied territories, LC and LU changes would
be perhaps the most important concern in many
districts of the Karabakh Region (Rasouli et al.,
2018b). It is recognized such contentious negative
changes can significantly impact regional climate,
ecosystem stability, water balance, stream silt up,
biodiversity, and socioeconomic practices, thereby
impinging on the regional economic progressing
and overall quality of life in the coming years. In-
tending to extract accurate information from the re-
sulting changes in the research topic, the basic ob-
jectives of the current study are: (a) applying DTI
methods to understand the initial status of LC dur-
ing the last period of the occupation stage inside
the Aghdam District; (b) creating more accurate
methods of rule-based NNC maps to access more
details of LU status and resulting changes within
the central district of Karabakh, which have been
most affected during the occupation period. These
aims could be accompanied by accurate infor-
mation that facilitates future rehabilitations plan-
ning (Rasouli et al., 2021a).
THE STUDY AREA
The study area is specified to the Aghdam
District that located in the Karabakh Economics
Region, with its most recognized city of Aghdam.
The geographical location of the study area is pre-
sented in Fig. 1. Aghdam is one of the 66 districts
of Azerbaijan and is located in the west of the
country and belongs to the Karabakh Economic
Region. Most of these districts were under the oc-
cupation of Armenian forces following the First
Karabakh war in the early 1990s (Sayilan, 2007).
However, as part of the 2020 Karabakh war vic-
tory, Aghdam and the surrounding districts were
returned to Azerbaijani control on 20 November
2020.
In the current study, two Sentinel-2 images
(approximately sized to 110 * 108 Km dimension)
were subsetted to cover the entire area of the Agh-
dam District. At the same size, they superimpose
the Aghdam District and as well large parts of the
administrative regions of Azerbaijan, including
Ganja-Qazakh, Kalbajar-Lachin, Aran, and
Karabakh that is one of the most important eco-
nomic regions of Azerbaijan (Aliyev, I. The Presi-
dent of the Republic of Azerbaijan, 2021). The
Aghdam District represents the geographical and
strategic importance of all sounded districts in the
region. Therefore, the entire range of two Sentinel-
2 satellite images was taken on 12 August 2016
(during the occupation of the territory of Azerbai-
jan by Armenia forces) and on 21 August 2021,
nearly about nine months after the recapturing of
the occupied territories.
Mapping of LC/LU changes inside the Aghdam district of the Karabakh economics region
57
Fig. 1. The geographic location of Aghdam District in Azerbaijan and indicating of the Sentinel-2 image extension
Aghdam has a mainly warm semi-arid climate
that could change to the wet conditions in the west-
ern parts would be affected by region complex re-
lief and enduring water bodies. Most of the land in
the study area includes agriculture, pastures, and
unique forests (Rasouli et al., 2018c). Forests
spread in the mountainous parts of the study area,
gradually become lower and, create subalpine and
alpine meadows. The occupation of the Azerbaijan
territories by Armenia caused significant damage
to the unique LC/LU types such as pasture, forests,
especially those located in the frontal lines inside
the Aghdam District, with a very rich flora species
of higher plants (Valigholizadeh and Karimi,
2016). During the occupation period, agriculture
became abounded and less economically important
on the regional scale (FAOSTAT, 2014).
DATA PROCESSED AND TECHNIQUES
APPLIED
a) Image Collection
To access the main aims of the current study,
we analyzed two images from Sentinel-2 satellite
acquired by ESA's Open Access (https://scihub.co-
pernicus.eu), selected for specific dates, character-
ized in Table 1. Sentinel-2 is a European wide-
swath, high-resolution, multi-spectral imaging
mission. The full mission specification of the twin
satellites flying in the same orbit but phased at
180°, is designed to give a high revisit frequency
of 5 days at the Equator. Due to the balanced veg-
etation cover and the absence of cloud cover in the
summer months, the satellite images are limited re-
lated to August months were processed (Sentinel
Online, 2018).
Rasouli et al.
58
Table 1. Basic information of the Sentinel-2 satellites
Band
Number
Basic
Descriptions
Wavelength
Range (µm)
Central
Wavelength (µm)
Spatial
Resolution (m)
1 Coastal Aerosol 0.433–0.453 0.443 60
2 Blue 0.4575–0.5225 0.490 10
3 Green 0.5425–0.5775 0.560 10
4 Red 0.65–0.68 0.665 10
5 Vegetation Red Edge 1 (VRE1) 0.6975–0.7125 0.705 20
6 Vegetation Red Edge 2 (VRE2) 0.7325–0.7475 0.740 20
7 Vegetation Red Edge 3 (VRE3) 0.773–0.793 0.783 20
8 Near-Infrared (NIR) 0.7845–0.8995 0.842 10
8A Vegetation Red Edge 4 0.855–0.875 0.865 20
9 Water Vapor 0.935–0.955 0.945 60
10 Shortwave Infrared Cirrus 1.36–1.39 1.375 60
11 Shortwave Infrared a 1.565–1.655 1.610 20
12 Shortwave Infrared b 2.1–2.28 2.190 20
Sentinel-2 MSI covering 13 spectral bands
(443–2190 nm), with a swath width of 290 km and
a spatial resolution of 10 m (4 visible and NIR
bands), 20 m (six red edge and shortwave infrared
bands) and 60 m, three atmospheric correction
bands (Sentinel-2 MSI User Guides, 2020). For
both sample sites, the Sentinel-2 images were pro-
cessed for investigating the changes of LC/LU for
the years 2016 and 2021. The selection of study ar-
eas required the consideration that the experi-
mental areas are representative and, thus, the veg-
etation and non-vegetation types in the study areas
should be abundant and diverse. Water bodies in-
clude lakes, rivers and water reservoirs, and non-
vegetation types include bare-land and other
emerging classes such as degraded and burned
lands. Fig. 2 shows two samples of Sentinel-2 im-
ages with 3 band combinations for years 2016 and
2021, with the highest spatial resolution (10*10
m). The reduction of vegetation is completely de-
tectable, particularly the rapid decline of green
cover is visible across the region. Even, the soil sal-
inization process can visually be observed in the
region marked with white, reddish, and orange col-
ours in the satellite imagery (Sentinel-2 MSI,
2020).
b) Image Processing
To build the image dataset, the aforemen-
tioned Level 1C (TOA – Top of Atmosphere re-
flectance) images were chosen based on the low
cloud cover percentage and pre-processed for at-
mospheric correction with the Sen2Cor plugin
(SNAP software – Sentinel-2 Toolbox) provided
by ESA (Szantoi and Strobl, 2019). Following the
atmospheric correction, we obtained Level 2A
(bottom of atmosphere reflectance) which is more
useful than TOA reflectance when trying to detect
a process on the surface such as vegetation and wa-
ter, because of the atmospheric effects caused by
the event itself are reduced. Then, each corrected
multispectral satellite imagery was imported to the
eCognition software setting, and accordingly,
mixed RGB layers were created. To obtain func-
tional information from the satellite images, we
proposed a tool, called estimation of scale parame-
ter (ESP), that builds on the idea of local variance
(LV) of object heterogeneity within a scene (Iko-
kou and Smit, 2013). When segmentation settings
were modified based on the ESP - depending on the
image quality (bands available, and image spatial-
resolution) pixels of any satellite image were
grouped into image objects before object-based in-
dexing and classification methods could be per-
formed. In the segmentation stage of satellite im-
ages, for scale parameter is taken about 55 and the
shape and compactness indexes (with trial and er-
ror) were suggested as 0.3 and 0.7 respectively.
The other main features of Sentinel-2 image layer
weighting and segmentation parameters are pre-
sented in Table 2.
Mapping of LC/LU changes inside the Aghdam district of the Karabakh economics region
59
Fig. 2. Samples of Sentinel-2 imagery reflecting green cover destruction adjusted for the entire
Aghdam District for years 2016 and 2021
Rasouli et al.
60
Table 2: The main features of Sentinel-2 image layer weighting and segmentation features
Bands b2 b3 b4 b7 b8 b8a b11 b12
Image RGB Layer Mixing & Weighting B1 B3 G1 G3 R1 & G1 R3 R1 --
Segmentation Setting 1 1 1 1 2 2 1 1
Along with implementing DTI procedures,
equations 1-4 were step-wisely applied to create
the basic NDWI, NDVI, NBRI, and AVBI indexes.
In the dynamic thresholding stage, each index is re-
garded as an indicator of specified land surfaces,
which typically refers to a spectral measure of the
change in the satellite image band's reflections
(Dozier, 1989).
𝑵𝑫𝑾𝑰 𝑺𝟐 = "(𝒃𝟑 − 𝒃𝟖) (𝒃𝟑 + 𝒃𝟖)
⁄ " (Equation 1)
If mean NDWI >= 0.1; classified as Water
𝑵𝑫𝑽𝑰 𝑺𝟐 = "(𝒃𝟖 − 𝒃𝟒) (𝒃𝟖 + 𝒃𝟒)
⁄ " (Equation 2)
if mean NDVI >= 0.25; classified as Vegetation
𝑵𝑩𝑹𝑰 𝑺𝟐 = "(𝒃𝟖𝒂 − 𝒃𝟏𝟐) (𝒃𝟖𝒂 + 𝒃𝟏𝟐)
⁄ " (Equation 3)
If mean NBRI >= 0.12; classified as Burned Lands
𝑨𝑽𝑩𝑰 𝑺𝟐 = "(𝒃𝟐 + 𝒃𝟑 + 𝒃𝟒) 𝟑
⁄ " (Equation 4)
If mean AVBI >= 2000; classified as Degraded Lands
Inside the eCognition Developer version 9.5,
based on the above-mentioned equations any index
layer calculation algorithm inserts a new image
layer by differentiating between dissimilar band
combinations (Rasouli and Mammadov, 2020a). In
usage, the NDWI index was first used NIR radia-
tion and visible green light to enhance the presence
of water bodies while in the study area by eliminat-
ing the presence of soil and terrestrial vegetation
features. In turn, the NDVI standardized vegetation
index allowed us to generate an indicator showing
the relative biomass on the image. The chlorophyll
absorption in the red band and relatively high re-
flectance of vegetation in the NIR band are used
for calculating NDVI values. Furthermore, an
NBRI was applied to the Sentinel-2 bands to cap-
ture likely burned lands in the local scales. It is a
numerical indicator that combines Vegetation Red
Edge (b8a) and Shortwave Infrared (b12) bands.
Along with the other indicators, the standardized
burning index NBRI has been used to highlight the
burned areas, while muffing the difference in light-
ing and atmospheric conditions. It is ideal for de-
tecting localized burned areas, especially in the de-
tection of burned or burning places (farmlands and
pastures) which intentionally were set on fires
(Simone et al., 2020). Fire-affected areas have rela-
tively low near-infrared reflectance (NIR) and high
reflectance in the short-wave infrared band (SWIR).
It should be noted that in the process of adjusting the
above-mentioned indicators, the Average Visible
Brightness Index (AVBI) was regulated by trial-
and-error thresholds, with the goal of recognizing
and producing existing degraded lands.
Lastly, for quantitative analysis of Sentinel-2
images, the NNC supervised classification proce-
dure was used to create LU maps based on the
OBIA structure (Kato, 2020). Supervised classifi-
cation involves the use of training area data that are
considered representative of each LU type to be
classified, consists of a few major steps. First, after
the creation of required projects inside the eCogni-
tion setting, multiresolution segmentation algo-
rithms and parameters are set and executed in the
creation of certain image objects. Then, inside the
Class Hierarchy box different classes of water, for-
est & pasture, agriculture, barren-lands, degraded
and burned lands (as vulnerable classes) were de-
fined according to the objects structure in the im-
age object domain and their nearest sample neigh-
bors. The nearest neighbor classifies image objects
in each feature space and with given samples for
the classes of concern, inside the eCognition soft-
ware, needed for each type of class. After a repre-
sentative set of samples, objects have been de-
clared, the algorithm searches for the closest sample
object in the defined feature space for each image
object. It selects the highest accurate features to be
considered for the feature space closest sample ob-
ject belongs to LU classes by applying certain mem-
bership functions allows defining the highest rela-
tionship between feature values and the degree of
membership to a class using fuzzy logic operators.
Then, if the image object differs from the sample,
the feature space distance has a fuzzy dependency
on the distance to the nearest sample classes during
the NNC procedure (Kamusoko, 2019).
In a few cases, especially when classes were
not clearly distinguished on the image sketch, the
Sample Editor window, as a principal tool for
checking samples, was applied to automatically
Mapping of LC/LU changes inside the Aghdam district of the Karabakh economics region
61
generate membership functions. It was also used to
compare the attributes or histograms of image ob-
jects and samples of different classes. It is helpful to
get an overview of the feature distribution of image
objects or samples of specific classes. The features
of an image object can be compared to the total dis-
tribution of this feature over one or all image object
levels. In addition, to assess the quality of samples
the Sample Selection Information window was ap-
plied to decide if an image object contains new in-
formation for a class, or if it should belong to an-
other LU class. To ensure that the output LU maps
are reliable, and quantitative accuracy methods were
employed to assess the producer’s accuracy, user’s
accuracy, overall accuracy, and Kappa coefficient of
NNC classification. In the end, applying different
accuracy assessment tools, such as the Stability dia-
log box and The Error Matrix (based on TTA Mask)
it was possible to produce statistical outputs to in-
crease the quality of the classification results (eCog-
nition Developer, 2021).
RESULTS
a) Indices LC Maps
To compare the changes of LC types all over
the study area the water body, vegetation, non-veg-
etation, and vulnerable classes are shown in Fig. 3.
The decrease in vegetation can be traced inside the
Aghdam District by accurate examination of LC
classes during the last years with significant nega-
tive changes inside the study area. Looking closely
at the amounts of LC classes on the legend of maps
in Fig. 4, it could be detected that the amount of
vegetation cover over the last 6 years has reduced
nearly to about 27.8 km2
(10.2 %). At the same
time, about 78.2 km2
(11.8 %) has been added to
the Non-Vegetated LC. Meanwhile, Vulnerable
Lands were changed by about 45.1 km2
(-26.8 %),
even though this amount was at its maximum in
2016 with 168.4 km2
. This amount decrease could
be related to the reduction of deliberate fires in the
green-covers and ended the abolition of land occu-
pation. To achieve more accuracy, it was necessary
to create LU maps with more classes and accurate
NNC techniques.
Fig. 3. LC maps produced by indexing techniques ad-
justed for the Sentinel-2 imagery 2016 and 2021
b) Classified LU Maps
By introducing MRS algorithms and NNC
procedures, LU maps, with six classes, were pro-
duced and adjusted for the Aghdam District. To be
certain about the result of NNC the performance of
closing LU classes was cheeked in detail with dif-
ferent image mixed layer weights and multiresolu-
tion segmentation parameters (Fig. 4).
Rasouli et al.
62
Classified
Map
Multiresolution
Segmentation
Image Layer
Weighted & Mixed
NNC Steps /
Landuse
Water
Surface
Forests &
Pastures
Agricultural
Fields
Barren
Lands
Degraded
Lands
Burned
Lands
Fig 4. The performance of final NNC classified LU classes, examples with different image mixed layer weights, and
multiresolution segmentation
Mapping of LC/LU changes inside the Aghdam district of the Karabakh economics region
63
Fig. 5. Final LU maps of 2016 and 2021 classified by NNC techniques
Due to the careful visual interpretation and a
quantitative accuracy index, the performance (for
each class) was controlled, and promising accu-
rate maps were produced. By carefully testing the
preformed samples, produced layers were im-
ported to the ArcGIS setting and final classified
LU maps of 2016 and 2021 were mapped (Fig. 5).
Examination of the resulting LU maps indi-
cated that the reduction in forests & pastures
(-9.8%) and barren lands (+4.4%) inside the Agh-
dam District are quite considerable (Fig.5). As it
is noticeable in Fig 6, changes in other classes are
also evident by emerging more degraded lands
(+35%) and reducing burned lands (-36.9%).
Amounts of raise in water surface class (+3.4%)
and agricultural fields (+0.3%) are not quite
meaningful from 2016 to 2021.
Rasouli et al.
64
Fig. 6: Changes in the LU types in 2016 and 2021 adjusted to the Aghdam District. The values in
parentheses (in %) indicate a decrease (-) or increase (+) concerning any of LU classes
DISCUSSION
During the long-term occupation stage, the
fundamental driving force of LC/LU changes has
been related to war activities such as the compul-
sory seizure of agricultural and livestock activi-
ties, along with the destruction of rare forests
(IDMC, 2021). Moreover, we should consider the
uncontrolled erosion of soil, pasture, and unique
historical monument buildings destruction caused
by unprincipled mining activities, multiple bomb-
ings, and land-mine landings within the occupied
territories. Eventually, the improper landuse and
lack of proper care of human and natural re-
sources led to widespread destruction and even
extinction of many plants and wildlife species in
the region (Baumann et al., 2013).
Thereafter, our main goal was to assess LC
and LU changes inside the Aghdam District by
applying OBIA DTI and rule based NNC meth-
ods respectively. Primary, to understand the ex-
tent of changes in basic LC types, we processed
multi-temporal Sentinel-2 imagery (sampled for
2016 and 2021) and introduced a few rule-based
indexes of NDWI, NDVI, NBRI and, AVBI con-
sequences. It was found that alongside the study
area, reduction of LC was accelerated during the
recent years, and continuously green covers are
being destroyed, particularly by degrading and
burning procedures during the occupied periods
(notice Fig. 3). With emphasis, vulnerable areas
were defined in two states of burned and de-
graded lands that are areas that have lost a major
degree of their natural productivity due to war-
caused processes (Gibbs and Salmon, 2015).
Other effective factors contributing to the rapid
destruction of vegetation and soil loss include
fires that are proposed by war behaviors and ag-
ricultural needs (Kust et al., 2017). Both destruc-
tive factors are influential in the process of
LC/LU changes by properly using indicators, as
were applied in the current study. Hence, DTI
methods could be effective methods by enclosing
the spectral, spatial, multitemporal, and multisen-
sory information; and incorporation of ancillary
data into indexing procedures (Mammadov and
Rasouli, 2020).
1.45 1.5
42.7 38.5
137.5 137.9
727.7
759.6
37.7 50.9
111.9
70.6
0
100
200
300
400
500
600
700
800
August 12, 2016 August 21, 2021
A
r
e
a
K
m
2
Landuse Classes
Water Surface (+3.4) Forest & Pasture (-9.8) Agricultural Fields (+0.3)
Barren Lands (+4.4) Degraded Lands (+35) Burned Lands (-36.9)
Mapping of LC/LU changes inside the Aghdam district of the Karabakh economics region
65
Furthermore, the OBIA segmentation and
NNC results (figures 5 and 6) indicated that the
vegetation trend (particularly forests and pas-
tures) is negative in the decreasing mode and the
LU changes are signs all over the Karabakh Re-
gion (Hay and Castilla, 2006; Rasouli et al.,
2021). As the result of the rule based NNC tech-
nique indicated the amount of burned lands in
2021 was much (36.9 %) lower than in 2016. This
reduction can certainly be related to the recaptur-
ing of the occupied territories and the reduction
of deliberate fires in the region. Nevertheless, ac-
curacy assessment, with an overall accuracy of
0.95 and Kappa statistics with 93 %, was an inte-
gral part of the current study DTI and NNC pro-
cedure. Without doubts, uncertainty and error
propagation in the modern image-processing
chain is still an important factor influencing the
final LU map's accuracy (Blaschke, 2010). Ulti-
mately, identifying the weakest links in the chain
and then reducing the uncertainties is critical to
the improvement of digital image processing ac-
curacy (Lobo and Chick, 1996). For future inves-
tigators, increasing the accuracy of the results of
similar research field operations is a necessary
profession.
CONCLUSION
The current introductory study's main goal
was to map the LC/LU changes by the processing
of satellite Sentinel-2 imagery inside the Aghdam
District for the years 2016 and 2021. Considering
so, the other objectives of this research were to
evaluate the potential of the OBIA functions of
DTI and rule based NNC methods inside the
eCognition Developer setting. Based on these ap-
proaches, the following results were obtained:
 during the occupation period, LC and LC
types have continuously been changed.
 LC and LU detection and mapping was a cru-
cial task in previously occupied districts, by
the processing of moderate resolution Senti-
nel-2A (10 m) images, in place of commercial
satellite images, enable LU mapping with lit-
tle to no cost.
 the OBIA methods could be regarded as a sub-
discipline of geo-information science devoted
to partitioning remote sensing imagery into
meaningful image objects and assessing their
characteristics through spatial, spectral, and
temporal scales.
 although the OBIA is found to be a very ad-
vanced image processing procedure, neverthe-
less we think that it could be compared in fu-
ture research along with quite professional
programs as Support Vector Machine, and
Machine-Learning / Deep-learning ap-
proaches to detect highly accurate LU changes
with high confidence.
 by processing high-resolution imagery, we
may carry out much more detailed information
by expanding the study site to other liberated
districts with an emphasis on the Karabakh
Region to visualize the most likely reduction
in green covers and associated damages that
have been imposed on the country valuable
ecological resources.
 a multi-platform and multi-purpose real-time
monitoring system is almost immediately re-
quired if it is not yet too late. Such reclamation
projects could be managed by Azeri-nation
staff to do this critical nationwide advanced
engagement.
REFERENCES
Aliyev I. (2021) President of Republic of Azer-
baijan, 2021. İnzibati-ərazi vahidləri, Azərbay-
can Respublikası Prezidentinin İşlər İdarəsi Pre-
zident Kitabxanasi.
Baatz M., Schape A. (2000) Multi-resolution
segmentation – an optimization approach for
high quality multi-scale segmentation. In:
J.Strobl et al. (eds.), Angewandte Geogra-
phische Informations verarbeitung XII, Beiträ-
gezum AGIT Symposium. Salsburg, Karlruhe,
Herbert Wichmann Verlag, p.12-23.
Baumann M., Volker C., Radeloff V., Avedian
T. (2013) Land-use change in the Caucasus dur-
ing and after the Nagorno-Karabakh conflict.
Reg. Environ Change, 15:170.
Blaschke T. (2010) Object-based image analysis
for remote sensing. ISPRS International Jour-
nal of Photogrammetry and Remote Sensing,
65(1): 2-16.
Rasouli et al.
66
Conflict and Environment Observatory (2021)
Report: Investigating the environmental dimen-
sions of the 2020 Nagorno-Karabakh conflict
Published: February 2021; Categories: Publica-
tions, Law and Policy.
Copernicus Sentinel-2 (2020) Satellite Missions
– eoPortal Directory. Directory.eoportal.org. Re-
trieved 5 March.
Dozier J. (1989) Spectral signature of Alpine
snow cover from LANDSAT Thematic Map-
per. Remote Sensing of Environment, 45: 9-22.
eCognition Reference Book (2019) eCognition
Developer for Windows operating system, Ver-
sion 9.5.1, Trimble. Munich, Germany.
eCognition Developer Software 10.1 (2021)
Trimble Germany GmbH, Munich, Germany.
FAOSTAT (2014) Statistical database of the
Food and Agricultural Organization. Available
at: http://faostat.fao.org/.
Foody G.M. (2002) Status of land cover classifi-
cation accuracy assessment. Remote Sensing of
Environment, 80(1): 185-201.
Franklin S.E., Wulder M.A. (2002) Remote
sensing methods in medium spatial resolution
satellite data land cover classification of large
areas. Progress in Physical Geography, 26,
173−205.
General Assembly Security Council (2009)
Letter dated 30 September 2009 from the Per-
manent Representative of Azerbaijan to the
United Nations addressed to the Secretary-Gen-
eral, Protracted conflicts in the GUAM area and
their implications for international peace, secu-
rity, and development. The situation in the oc-
cupied territories of Azerbaijan Security Coun-
cil Sixty-fourth year.
Gibbs H.K., Salmon J.M. (2015) Mapping the
world's degraded lands. Applied Geography,
57: 12-21.
Hasanov Z.M., Ibrahimov Z.A., Nabiyev V.R.
(2017) "Beech forests of Azerbaijan: The mod-
ern condition, age structure and regeneration.
Annals of Agrarian Science, 15(4): 453–457;
1512-1887.
Hay G.J., Castilla G. (2006) Object-based Im-
age Analysis, Strengths, weaknesses, opportu-
nities, and threats (SWOTs). From OBIA 2006.
International Archives of Photogrammetry, Re-
mote sensing, and Spatial Information Sciences.
Ikokou G., Smit J. (2013) A technique for opti-
mal selection of segmentation scale parameters
for object-oriented classification of urban
scenes. South Afr. J. Geomatica, 2 (4):
International Displacement Monitoring Cen-
tre (IDMC) (2021) Nagorno-Karabakh con-
flict: finding common ground in respect of the
dead, News and Press Release ICRC.
Kamusoko C. (2019) Remote Sensing Image
Classification (Springer Geography) 1st ed.,
Publisher: Springer.
Kato L. (2020) Integrating Open-street map
Data: in Object-Based Land-Cover and Land-
Use Classification for Disaster Recovery, Pub-
lisher: LAP LAMBERT Academic Publishing,
76 p.
Khandelwal P., Singh K., Mehrotra A. (2014a)
Unsupervised Change Detection from Satellite
Images Using KCN, LAP LAMBERT Aca-
demic Publishing.
Khatami R., Mountrakis G., Stehman S.V.
(2016) A meta-analysis of remote sensing re-
search on supervised pixel-based land cover im-
age classification processes: general guidelines
for practitioners and future research. Remote
Sens. Environ., 177: 89–100.
Kust G., Andreeva O., Cowie A. (2017) Land
Degradation Neutrality: Concept development,
practical applications and assessment. Journal
of Environmental Management, 195: 16-24.
Lillesand T., Kiefer R., Chipman J. (2004) Re-
mote Sensing and Image Interpretation. 5th ed.
John Wiley and Sons Inc, New Jersey.
Lobo A., Chick O.A., Casterad A. (1996) Clas-
sification of Mediterranean crops with multi-
sensory data: Per-pixel versus per-object statis-
tics and image segmentation, Int. Journal of Re-
mote Sensing, 17 (12): 2385-2400.
Nelson S., Khorram S. (2018) Image Processing
and Data Analysis with ERDAS IMAGINE. 1st
ed., Kindle Edition, CRC Press.
Pettorelli, N. (2013) The Normalized Difference
Vegetation Index, 1st Edition, Kindle Edition,
OUP Oxford.
Rasouli A.A., Mammadov R., Pishnamaz M.,
Hushmand A., Safarov E. (2018b) Assess-
ment of Forest Cover Changes by Applying Ob-
ject-Oriented Procedures inside the Karabakh
Occupied Region. Eurasian GIS 2019 Congress
04-07 September 2018. Baku, Azerbaijan.
Mapping of LC/LU changes inside the Aghdam district of the Karabakh economics region
65
Rasouli A.A., Mammadov R., Safarov E., Mo-
hammadzadeh K. (2018c) Fuzzy Object-
Based Landcover/Use Mapping of The
Karabagh Region by Processing of Sentinel Sat-
ellite Imageries. Eurasian GIS 2019 Congress
04-07 September 2018. Baku, Azerbaijan.
Rasouli A.A., Mammadov R. (2020a) Prelimi-
nary Satellite Image Analysis Inside the ArcGIS
Setting, Lambert Academy Publishing, Ger-
many.
Rasouli A.A., Mammadov G.SH., Asgarova
M.M. (2021a) Mastering Spatial Data Analysis
Inside the GIS Setting, Azerbaijan State Peda-
gogical University. Faculty of History and Ge-
ography, Baku.
Rasouli A.A., Mammadov R., Asgarova M.M.
(2021b) Application of Satellite Image Pro-
cessing Methods in Mapping of Land-
cover/Landuse Changes inside the Karabakh
Liberated Territories. Azərbaycan Milli Elmlər
Akademiyasi, AMEA-nın Biologiya və Tibb
Elmləri Bölməsinin Konfransı.
Rehman S., Hussain M. (2018) Fuzzy C-means
algorithm-based satellite image segmentation.
Indonesian Journal of Electrical Engineering
and Computer Science, 9(2): 332–334.
Sayilan M.O. (2007) 1988–95 Arası dağlık
Karabağ Sorunu, Karabakh conflict between
1988–1995. Master Project, Ankara University.
Scheffer M. (2010) Foreseeing tipping points.
Nature, 467: 411–412.
Sentinel Online (2018) Multispectral Instrument
(MSI) Overview, European Space Agency. Re-
trieved 3 December 2018.
Sentinel-2 MSI User Guides (2020) Radio-
metric Resolutions Sentinel-2 MSI (2020) Sen-
tinel Online. Sentinel.esa.int. Retrieved 5
March 2020.
Simone W.D., Musciano M.D., Cecco W.D.,
Ferella G., Frattaroli A.R. (2020) The poten-
tiality of Sentinel-2 to assess the effect of fire
events on Mediterranean mountain vegetation.
Plant Sociology, 57: 11-22.
Szantoi Z., Strobl P. (2019) Copernicus Sentinel-
2 Calibration and Validation, European Journal
of Remote Sensing, 52, Issue 1.
Thenkabail P.S., Lyon J.G., Huete A. (2018)
Fundamentals, Sensor Systems, Spectral Li-
braries, and Data Mining for Vegetation (Hy-
perspectral Remote Sensing of Vegetation). 2nd
ed., CRC Press.
Valigholizadeh A., Karimi M. (2016) Geo-
graphical explanation of the factors disputed in
the Karabakh geopolitical crisis, Journal of
Eurasian Studies, 7: 172–180.
Qarabağ iqtisadi rayonu torpaq örtüyü və torpaqdan istifadədəki dəyişikliklərin Ağdam rayonu
daxilində peyk şəkillərinin obyekt yönümlü təhlili əsasında xəritələşdirilməsi
A.A. Rəsuli1
, M.M. Əsgərova2
, S.H. Səfərov3
1
Makkuari Universitetinin Ətraf Mühit Elmləri Departamenti, Sidney, Avstraliya
2
Azərbaycan Dövlət Pedaqoji Universitetinin Tarix-coğrafiya fakültəsi, Bakı, Azərbaycan
3
AMEA-nın Coğrafiya İnstitutu, Bakı, Azərbaycan
Erməni silahlı birləşmələri tərəfindən Qarabağın və ona bitişik ərazilərin 30 illik işğalının ekoloji nəticələ-
rinin araşdırılması və müəyyən edilməsi vacib və təxirəsalınmaz vəzifələrdən biridir. Ağdam rayonu dax-
ilində erməni işğalından azad edilmiş ərazilərdə torpaq örtüyünün və torpaqdan istifadənin (LC/LU) vəziy-
yətini və ehtimal edilən dəyişiklikləri öyrənmək üçün obyekt yönümlü görüntü analizi (OBIA) prosedurları
tətbiq edilmişdir. Əvvəlcə, bir neçə spektral indekslərdən istifadə etməklə - NDWI, NDVI, NBRI və AVBI,
torpaq örtüyünü (LC) əks etdirmək üçün dinamik fərq indeksinin (DTI) alqoritmləri tətbiq edilmişdır. Son-
ra, tədqiqat sahəsi daxilində dəqiq torpaqdan istifadə dəyişikliklərini müəyyən etmək üçün Trimble eCog-
nition platformasında təkmilləşdirilmiş nəzarət sinifləndirmə metodu olan ən yaxın qonşu təsnifatı (NNC)
metodundan istifadə edilmişdir (eCognition Developer, 2019).
Rasouli et al.
68
Dinamik həddlərin indeksləşdirilməsi (DTI) alqoritmlərinin istifadəsi göstərdi ki, 2016-2021-ci illərdə Ağ-
dam rayonu daxilində torpaq örtüyündə (LC) olduqca əhəmiyyətli dəyişikliklər baş vermişdir, bitki örtüyü-
nün əhəmiyyətli dərəcədə azalmış (10,2%), bir hissəsi tamamilə məhv olmuş (11,8%), həssas torpaqlarda
olduqca nəzərə çarpan dəyişikliklər (26,8%) meydana çıxmışdır. Ən yaxın qonşu klassifikasiya metodu
(NNC) əsasında bir neçə torpaq istifadəsi dəyişiklikləri aşkar edilib: meşə və otlaq sahələrinin 9,8% azal-
mış, deqradasiya olunmuş torpaq sahələri 35%-ə qədər, qeyri-münbit torpaq sahələri 4,4%-ə qədər artmışdır
və bu proses davam etməkdədir. Qeyd edək ki, su səthinin və kənd təsərrüfatı torpaqlarından istifadədə
(LU) dəyişikliklər daha az müşahidə olunmuş və müvafiq olaraq 3,4% və 0,3% təşkil etmişdir. Ümumi
dəqiqliyin 0,95 və Kappa əmsalının 93% olması torpaq örtüyü və torpaqdan istifadənin (LC/LU) vəziyyə-
tində baş vermiş dəyişikliklərin statistik əhəmiyyətli olduğunu təsdiq edir. Beləliklə, səlahiyyətli hökümət
nümayəndələrinin bərpa və layihə işlərinə başlamaq haqqında qərar verməsindən əvvəl, Azərbaycanın azad
edilmiş rayonlarının hazırkı vəziyyətinin hərtərəfli analizi və xəritələşdirilməsi coğrafiyaçıların, ekoloqla-
rın və uzaqdan alqılama mütəxəssislərinin ən təxirəsalınmaz vəzifələrinə çevrilməlidir.
Açar sözlər: Ağdam rayonu, Qarabağ, torpaq örtüyü və torpaqdan istifadənin dəyişməsi (LC/LU), Senti-
nel-2 şəkilləri, OBIA əsasında dinamik və həddi indeksləşdirmə, ən yaxın qonşu təsnifatı (NNC)
Картирование изменений земельного покрова и землепользования в Карабахском
экономическом районе на основе объектно-ориентированного анализа спутниковых
снимков в пределах Агдамского района
А.А. Расули1
, М.М. Асгарова2
, С.Г. Сафаров3
1
Департамент наук об окружающей среде Университетa Маккуори, Сидней, Австралия
2
Факультет истории и географии Азербайджанского государственного педагогического
университета, Баку, Азербайджан
3
Институт географии НАН Азербайджана, Баку, Азербайджан
Исследование и выявление экологических последствий 30-летней оккупации Карабаха и прилегаю-
щих к нему территорий армянскими вооруженными формированиями, является одним из важных и
актуальных задач. Для изучения состояния и вероятных изменений земельного покрова и земле-
пользования (LC/LU) на освобождённых от армянской оккупации территориях Карабаха в пределах
Агдамского района были использованы процедуры объектно-ориентированного анализа изображе-
ний (OBIA). Сначала были применены алгоритмы динамической индексации пороговых значений
(DTI) для отображения земельного покрова (LC) путём разработки нескольких спектральных ин-
дексов NDWI, NDVI, NBRI и AVBI. Затем, с целью выявления точных изменений землепользования
внутри исследуемой области, был использован усовершенствованный контролируемый метод клас-
сификации в рамках настройки Trimble eCognition - метод классификации ближайшего соседа
(NNC) (eCognition Developer, 2019). Результаты динамической индексации пороговых значений
(DTI) показали, что с 2016 по 2021 годы внутри Агдамского района произошли существенные из-
менения земельного покрова (LC), значительное уменьшение растительного покрова (10,2%), уве-
личение невегетативной зоны (11,8%) и появление довольно заметных изменений на ранее оккупи-
рованных землях (26,8%). Впоследствии, методом классификации ближайшего соседа (NNC) были
обнаружены различные отрицательные изменения землепользования внутри исследуемой области -
сокращение лесов и пастбищ на 9,8%, увеличение площади деградированных земель до 35% и бес-
плодных земель до 4,4%. Следует отметить, что минимальные изменения наблюдались для водной
поверхности и сельскохозяйственного землепользования (LU) до 3,4% и 0,3%, соответственно. Зна-
чения общей точности 0,95 и коэффициента Kaппa 0,93 подтвердили статистическую значимость
Mapping of LC/LU changes inside the Aghdam district of the Karabakh economics region
69
изменений состояния земельного покрова и землепользования (LC/LU). Следовательно, точная об-
работка изображений и картирование текущего положения освобожденных районов Азербайджана
должны стать наиболее актуальными задачами ученых географов, экологов и специалистов по ди-
станционному зондированию до того, как лица, принимающие решения в правительстве, приступят
к проектам реконструкции и реабилитации.
Ключевые слова: Агдамский район, Карабах, изменения земельного покрова и землепользования
(LC/LU), снимки Sentinel-2, динамическая и пороговая индексация на основе OBIA, контролируемая
классификация ближайшего соседа (NNC)

More Related Content

Similar to 7 Journal of Life Sciences and Biomedicine (2710-4915 2710-3447).pdf

Identification Of Ground Water Potential Zones In Tamil Nadu By Remote Sensin...
Identification Of Ground Water Potential Zones In Tamil Nadu By Remote Sensin...Identification Of Ground Water Potential Zones In Tamil Nadu By Remote Sensin...
Identification Of Ground Water Potential Zones In Tamil Nadu By Remote Sensin...IJERA Editor
 
Land Use/Land Cover Mapping Of Allahabad City by Using Remote Sensing & GIS
Land Use/Land Cover Mapping Of Allahabad City by Using  Remote Sensing & GIS Land Use/Land Cover Mapping Of Allahabad City by Using  Remote Sensing & GIS
Land Use/Land Cover Mapping Of Allahabad City by Using Remote Sensing & GIS IJMER
 
RemoteSensingProjectPaper
RemoteSensingProjectPaperRemoteSensingProjectPaper
RemoteSensingProjectPaperJames Sherwood
 
IRJET- Landuse, Landcover and Urban Development of Coimbatore North Zone for ...
IRJET- Landuse, Landcover and Urban Development of Coimbatore North Zone for ...IRJET- Landuse, Landcover and Urban Development of Coimbatore North Zone for ...
IRJET- Landuse, Landcover and Urban Development of Coimbatore North Zone for ...IRJET Journal
 
Landuse and Landcover analysis using Remote Sensing and GIS: A Case Study in ...
Landuse and Landcover analysis using Remote Sensing and GIS: A Case Study in ...Landuse and Landcover analysis using Remote Sensing and GIS: A Case Study in ...
Landuse and Landcover analysis using Remote Sensing and GIS: A Case Study in ...IRJET Journal
 
Landuse landcover and ndvi analysis for halia catchment
Landuse landcover and ndvi analysis for halia catchmentLanduse landcover and ndvi analysis for halia catchment
Landuse landcover and ndvi analysis for halia catchmentIAEME Publication
 
Analysis on land use land cover classification around mysuru and chamarajanag...
Analysis on land use land cover classification around mysuru and chamarajanag...Analysis on land use land cover classification around mysuru and chamarajanag...
Analysis on land use land cover classification around mysuru and chamarajanag...IAEME Publication
 
Remote Sensing and GIS-Based Monitoring of Land Use Change in Nagpur District...
Remote Sensing and GIS-Based Monitoring of Land Use Change in Nagpur District...Remote Sensing and GIS-Based Monitoring of Land Use Change in Nagpur District...
Remote Sensing and GIS-Based Monitoring of Land Use Change in Nagpur District...IRJET Journal
 
Efficiency and Capability of Remote Sensing (RS) and Geographic Information ...
Efficiency and Capability of Remote Sensing  (RS) and Geographic Information ...Efficiency and Capability of Remote Sensing  (RS) and Geographic Information ...
Efficiency and Capability of Remote Sensing (RS) and Geographic Information ...nitinrane33
 
Landslide Susceptibility Assessment Using Modified Frequency Ratio Model in K...
Landslide Susceptibility Assessment Using Modified Frequency Ratio Model in K...Landslide Susceptibility Assessment Using Modified Frequency Ratio Model in K...
Landslide Susceptibility Assessment Using Modified Frequency Ratio Model in K...Dr. Amarjeet Singh
 
Water-Body Area Extraction From High Resolution Satellite Images-An Introduct...
Water-Body Area Extraction From High Resolution Satellite Images-An Introduct...Water-Body Area Extraction From High Resolution Satellite Images-An Introduct...
Water-Body Area Extraction From High Resolution Satellite Images-An Introduct...CSCJournals
 
EVALUATING REFLECTIVE SPECTROSCOPY FOR PREDICTING SOIL PROPERTIES IN GAJAPATI...
EVALUATING REFLECTIVE SPECTROSCOPY FOR PREDICTING SOIL PROPERTIES IN GAJAPATI...EVALUATING REFLECTIVE SPECTROSCOPY FOR PREDICTING SOIL PROPERTIES IN GAJAPATI...
EVALUATING REFLECTIVE SPECTROSCOPY FOR PREDICTING SOIL PROPERTIES IN GAJAPATI...indexPub
 
Evaluation of Groundwater Resource Potential using GIS and Remote Sensing App...
Evaluation of Groundwater Resource Potential using GIS and Remote Sensing App...Evaluation of Groundwater Resource Potential using GIS and Remote Sensing App...
Evaluation of Groundwater Resource Potential using GIS and Remote Sensing App...IJERA Editor
 
Remote Sensing and GIS in Land Use / Land Cover Mapping
Remote Sensing and GIS in Land Use / Land Cover MappingRemote Sensing and GIS in Land Use / Land Cover Mapping
Remote Sensing and GIS in Land Use / Land Cover MappingVenkatKamal1
 
Accuracy Assessment of Land Use/Land Cover Classification using multi tempora...
Accuracy Assessment of Land Use/Land Cover Classification using multi tempora...Accuracy Assessment of Land Use/Land Cover Classification using multi tempora...
Accuracy Assessment of Land Use/Land Cover Classification using multi tempora...IRJET Journal
 
Diffuse reflectance spectroscopy to estimate soil attributes of Brazilian wet...
Diffuse reflectance spectroscopy to estimate soil attributes of Brazilian wet...Diffuse reflectance spectroscopy to estimate soil attributes of Brazilian wet...
Diffuse reflectance spectroscopy to estimate soil attributes of Brazilian wet...Agriculture Journal IJOEAR
 
2. virat arora, s. s. rao, e. amminedu and p. jagadeeswara rao
2. virat arora, s. s. rao, e. amminedu and p. jagadeeswara rao2. virat arora, s. s. rao, e. amminedu and p. jagadeeswara rao
2. virat arora, s. s. rao, e. amminedu and p. jagadeeswara raoJournal of Global Resources
 
International Journal of Engineering and Science Invention (IJESI)
International Journal of Engineering and Science Invention (IJESI)International Journal of Engineering and Science Invention (IJESI)
International Journal of Engineering and Science Invention (IJESI)inventionjournals
 

Similar to 7 Journal of Life Sciences and Biomedicine (2710-4915 2710-3447).pdf (20)

Identification Of Ground Water Potential Zones In Tamil Nadu By Remote Sensin...
Identification Of Ground Water Potential Zones In Tamil Nadu By Remote Sensin...Identification Of Ground Water Potential Zones In Tamil Nadu By Remote Sensin...
Identification Of Ground Water Potential Zones In Tamil Nadu By Remote Sensin...
 
Land Use/Land Cover Mapping Of Allahabad City by Using Remote Sensing & GIS
Land Use/Land Cover Mapping Of Allahabad City by Using  Remote Sensing & GIS Land Use/Land Cover Mapping Of Allahabad City by Using  Remote Sensing & GIS
Land Use/Land Cover Mapping Of Allahabad City by Using Remote Sensing & GIS
 
RemoteSensingProjectPaper
RemoteSensingProjectPaperRemoteSensingProjectPaper
RemoteSensingProjectPaper
 
IRJET- Landuse, Landcover and Urban Development of Coimbatore North Zone for ...
IRJET- Landuse, Landcover and Urban Development of Coimbatore North Zone for ...IRJET- Landuse, Landcover and Urban Development of Coimbatore North Zone for ...
IRJET- Landuse, Landcover and Urban Development of Coimbatore North Zone for ...
 
Landuse and Landcover analysis using Remote Sensing and GIS: A Case Study in ...
Landuse and Landcover analysis using Remote Sensing and GIS: A Case Study in ...Landuse and Landcover analysis using Remote Sensing and GIS: A Case Study in ...
Landuse and Landcover analysis using Remote Sensing and GIS: A Case Study in ...
 
Landuse landcover and ndvi analysis for halia catchment
Landuse landcover and ndvi analysis for halia catchmentLanduse landcover and ndvi analysis for halia catchment
Landuse landcover and ndvi analysis for halia catchment
 
Analysis on land use land cover classification around mysuru and chamarajanag...
Analysis on land use land cover classification around mysuru and chamarajanag...Analysis on land use land cover classification around mysuru and chamarajanag...
Analysis on land use land cover classification around mysuru and chamarajanag...
 
Remote Sensing and GIS-Based Monitoring of Land Use Change in Nagpur District...
Remote Sensing and GIS-Based Monitoring of Land Use Change in Nagpur District...Remote Sensing and GIS-Based Monitoring of Land Use Change in Nagpur District...
Remote Sensing and GIS-Based Monitoring of Land Use Change in Nagpur District...
 
Efficiency and Capability of Remote Sensing (RS) and Geographic Information ...
Efficiency and Capability of Remote Sensing  (RS) and Geographic Information ...Efficiency and Capability of Remote Sensing  (RS) and Geographic Information ...
Efficiency and Capability of Remote Sensing (RS) and Geographic Information ...
 
Landslide Susceptibility Assessment Using Modified Frequency Ratio Model in K...
Landslide Susceptibility Assessment Using Modified Frequency Ratio Model in K...Landslide Susceptibility Assessment Using Modified Frequency Ratio Model in K...
Landslide Susceptibility Assessment Using Modified Frequency Ratio Model in K...
 
Water-Body Area Extraction From High Resolution Satellite Images-An Introduct...
Water-Body Area Extraction From High Resolution Satellite Images-An Introduct...Water-Body Area Extraction From High Resolution Satellite Images-An Introduct...
Water-Body Area Extraction From High Resolution Satellite Images-An Introduct...
 
Viewpaper
ViewpaperViewpaper
Viewpaper
 
EVALUATING REFLECTIVE SPECTROSCOPY FOR PREDICTING SOIL PROPERTIES IN GAJAPATI...
EVALUATING REFLECTIVE SPECTROSCOPY FOR PREDICTING SOIL PROPERTIES IN GAJAPATI...EVALUATING REFLECTIVE SPECTROSCOPY FOR PREDICTING SOIL PROPERTIES IN GAJAPATI...
EVALUATING REFLECTIVE SPECTROSCOPY FOR PREDICTING SOIL PROPERTIES IN GAJAPATI...
 
Evaluation of Groundwater Resource Potential using GIS and Remote Sensing App...
Evaluation of Groundwater Resource Potential using GIS and Remote Sensing App...Evaluation of Groundwater Resource Potential using GIS and Remote Sensing App...
Evaluation of Groundwater Resource Potential using GIS and Remote Sensing App...
 
Evaluation of Groundwater Resource Potential using GIS and Remote Sensing App...
Evaluation of Groundwater Resource Potential using GIS and Remote Sensing App...Evaluation of Groundwater Resource Potential using GIS and Remote Sensing App...
Evaluation of Groundwater Resource Potential using GIS and Remote Sensing App...
 
Remote Sensing and GIS in Land Use / Land Cover Mapping
Remote Sensing and GIS in Land Use / Land Cover MappingRemote Sensing and GIS in Land Use / Land Cover Mapping
Remote Sensing and GIS in Land Use / Land Cover Mapping
 
Accuracy Assessment of Land Use/Land Cover Classification using multi tempora...
Accuracy Assessment of Land Use/Land Cover Classification using multi tempora...Accuracy Assessment of Land Use/Land Cover Classification using multi tempora...
Accuracy Assessment of Land Use/Land Cover Classification using multi tempora...
 
Diffuse reflectance spectroscopy to estimate soil attributes of Brazilian wet...
Diffuse reflectance spectroscopy to estimate soil attributes of Brazilian wet...Diffuse reflectance spectroscopy to estimate soil attributes of Brazilian wet...
Diffuse reflectance spectroscopy to estimate soil attributes of Brazilian wet...
 
2. virat arora, s. s. rao, e. amminedu and p. jagadeeswara rao
2. virat arora, s. s. rao, e. amminedu and p. jagadeeswara rao2. virat arora, s. s. rao, e. amminedu and p. jagadeeswara rao
2. virat arora, s. s. rao, e. amminedu and p. jagadeeswara rao
 
International Journal of Engineering and Science Invention (IJESI)
International Journal of Engineering and Science Invention (IJESI)International Journal of Engineering and Science Invention (IJESI)
International Journal of Engineering and Science Invention (IJESI)
 

More from PublisherNasir

Bank and policy, 4, 2022.pdf
Bank and policy, 4, 2022.pdfBank and policy, 4, 2022.pdf
Bank and policy, 4, 2022.pdfPublisherNasir
 
P 1 Science, Education and Innovations in the context of modern problems-203-...
P 1 Science, Education and Innovations in the context of modern problems-203-...P 1 Science, Education and Innovations in the context of modern problems-203-...
P 1 Science, Education and Innovations in the context of modern problems-203-...PublisherNasir
 
P 1 Science, Education and Innovations in the context of modern problems-181-...
P 1 Science, Education and Innovations in the context of modern problems-181-...P 1 Science, Education and Innovations in the context of modern problems-181-...
P 1 Science, Education and Innovations in the context of modern problems-181-...PublisherNasir
 
P 1 Science, Education and Innovations in the context of modern problems-137-...
P 1 Science, Education and Innovations in the context of modern problems-137-...P 1 Science, Education and Innovations in the context of modern problems-137-...
P 1 Science, Education and Innovations in the context of modern problems-137-...PublisherNasir
 
P 1 Science, Education and Innovations in the context of modern problems-144-...
P 1 Science, Education and Innovations in the context of modern problems-144-...P 1 Science, Education and Innovations in the context of modern problems-144-...
P 1 Science, Education and Innovations in the context of modern problems-144-...PublisherNasir
 
P 2 SEI Conference Proceedings-10-18.pdf
P 2 SEI Conference Proceedings-10-18.pdfP 2 SEI Conference Proceedings-10-18.pdf
P 2 SEI Conference Proceedings-10-18.pdfPublisherNasir
 

More from PublisherNasir (20)

Bank and policy, 4, 2022.pdf
Bank and policy, 4, 2022.pdfBank and policy, 4, 2022.pdf
Bank and policy, 4, 2022.pdf
 
P 1 Science, Education and Innovations in the context of modern problems-203-...
P 1 Science, Education and Innovations in the context of modern problems-203-...P 1 Science, Education and Innovations in the context of modern problems-203-...
P 1 Science, Education and Innovations in the context of modern problems-203-...
 
P 1 Science, Education and Innovations in the context of modern problems-181-...
P 1 Science, Education and Innovations in the context of modern problems-181-...P 1 Science, Education and Innovations in the context of modern problems-181-...
P 1 Science, Education and Innovations in the context of modern problems-181-...
 
P 1 Science, Education and Innovations in the context of modern problems-137-...
P 1 Science, Education and Innovations in the context of modern problems-137-...P 1 Science, Education and Innovations in the context of modern problems-137-...
P 1 Science, Education and Innovations in the context of modern problems-137-...
 
P 1 Science, Education and Innovations in the context of modern problems-144-...
P 1 Science, Education and Innovations in the context of modern problems-144-...P 1 Science, Education and Innovations in the context of modern problems-144-...
P 1 Science, Education and Innovations in the context of modern problems-144-...
 
P 2 SEI Conference Proceedings-10-18.pdf
P 2 SEI Conference Proceedings-10-18.pdfP 2 SEI Conference Proceedings-10-18.pdf
P 2 SEI Conference Proceedings-10-18.pdf
 
full SEI 3, 2022.pdf
full SEI 3, 2022.pdffull SEI 3, 2022.pdf
full SEI 3, 2022.pdf
 
10.pdf
10.pdf10.pdf
10.pdf
 
04 anuradha.pdf
04 anuradha.pdf04 anuradha.pdf
04 anuradha.pdf
 
05 Revathi.pdf
05 Revathi.pdf05 Revathi.pdf
05 Revathi.pdf
 
06 UMAMAGESWARI.pdf
06 UMAMAGESWARI.pdf06 UMAMAGESWARI.pdf
06 UMAMAGESWARI.pdf
 
07 Kenan Abaci.pdf
07 Kenan Abaci.pdf07 Kenan Abaci.pdf
07 Kenan Abaci.pdf
 
11.pdf
11.pdf11.pdf
11.pdf
 
08 Maheswari.pdf
08 Maheswari.pdf08 Maheswari.pdf
08 Maheswari.pdf
 
13 tian.pdf
13 tian.pdf13 tian.pdf
13 tian.pdf
 
09 Thanh.pdf
09 Thanh.pdf09 Thanh.pdf
09 Thanh.pdf
 
03 Annica.pdf
03 Annica.pdf03 Annica.pdf
03 Annica.pdf
 
01 Mohan.pdf
01 Mohan.pdf01 Mohan.pdf
01 Mohan.pdf
 
02 Aziz.pdf
02 Aziz.pdf02 Aziz.pdf
02 Aziz.pdf
 
12 badoor.pdf
12 badoor.pdf12 badoor.pdf
12 badoor.pdf
 

Recently uploaded

Sonagachi Call Girls Services 9907093804 @24x7 High Class Babes Here Call Now
Sonagachi Call Girls Services 9907093804 @24x7 High Class Babes Here Call NowSonagachi Call Girls Services 9907093804 @24x7 High Class Babes Here Call Now
Sonagachi Call Girls Services 9907093804 @24x7 High Class Babes Here Call NowRiya Pathan
 
CALL ON ➥9907093804 🔝 Call Girls Baramati ( Pune) Girls Service
CALL ON ➥9907093804 🔝 Call Girls Baramati ( Pune)  Girls ServiceCALL ON ➥9907093804 🔝 Call Girls Baramati ( Pune)  Girls Service
CALL ON ➥9907093804 🔝 Call Girls Baramati ( Pune) Girls ServiceMiss joya
 
VIP Mumbai Call Girls Hiranandani Gardens Just Call 9920874524 with A/C Room ...
VIP Mumbai Call Girls Hiranandani Gardens Just Call 9920874524 with A/C Room ...VIP Mumbai Call Girls Hiranandani Gardens Just Call 9920874524 with A/C Room ...
VIP Mumbai Call Girls Hiranandani Gardens Just Call 9920874524 with A/C Room ...Garima Khatri
 
Call Girls Service Jaipur Grishma WhatsApp ❤8445551418 VIP Call Girls Jaipur
Call Girls Service Jaipur Grishma WhatsApp ❤8445551418 VIP Call Girls JaipurCall Girls Service Jaipur Grishma WhatsApp ❤8445551418 VIP Call Girls Jaipur
Call Girls Service Jaipur Grishma WhatsApp ❤8445551418 VIP Call Girls Jaipurparulsinha
 
Call Girls Service Pune Vaishnavi 9907093804 Short 1500 Night 6000 Best call ...
Call Girls Service Pune Vaishnavi 9907093804 Short 1500 Night 6000 Best call ...Call Girls Service Pune Vaishnavi 9907093804 Short 1500 Night 6000 Best call ...
Call Girls Service Pune Vaishnavi 9907093804 Short 1500 Night 6000 Best call ...Miss joya
 
VIP Call Girls Indore Kirti 💚😋 9256729539 🚀 Indore Escorts
VIP Call Girls Indore Kirti 💚😋  9256729539 🚀 Indore EscortsVIP Call Girls Indore Kirti 💚😋  9256729539 🚀 Indore Escorts
VIP Call Girls Indore Kirti 💚😋 9256729539 🚀 Indore Escortsaditipandeya
 
Bangalore Call Girls Marathahalli 📞 9907093804 High Profile Service 100% Safe
Bangalore Call Girls Marathahalli 📞 9907093804 High Profile Service 100% SafeBangalore Call Girls Marathahalli 📞 9907093804 High Profile Service 100% Safe
Bangalore Call Girls Marathahalli 📞 9907093804 High Profile Service 100% Safenarwatsonia7
 
CALL ON ➥9907093804 🔝 Call Girls Hadapsar ( Pune) Girls Service
CALL ON ➥9907093804 🔝 Call Girls Hadapsar ( Pune)  Girls ServiceCALL ON ➥9907093804 🔝 Call Girls Hadapsar ( Pune)  Girls Service
CALL ON ➥9907093804 🔝 Call Girls Hadapsar ( Pune) Girls ServiceMiss joya
 
Low Rate Call Girls Pune Esha 9907093804 Short 1500 Night 6000 Best call girl...
Low Rate Call Girls Pune Esha 9907093804 Short 1500 Night 6000 Best call girl...Low Rate Call Girls Pune Esha 9907093804 Short 1500 Night 6000 Best call girl...
Low Rate Call Girls Pune Esha 9907093804 Short 1500 Night 6000 Best call girl...Miss joya
 
VIP Call Girls Pune Vani 9907093804 Short 1500 Night 6000 Best call girls Ser...
VIP Call Girls Pune Vani 9907093804 Short 1500 Night 6000 Best call girls Ser...VIP Call Girls Pune Vani 9907093804 Short 1500 Night 6000 Best call girls Ser...
VIP Call Girls Pune Vani 9907093804 Short 1500 Night 6000 Best call girls Ser...Miss joya
 
Russian Call Girls in Pune Riya 9907093804 Short 1500 Night 6000 Best call gi...
Russian Call Girls in Pune Riya 9907093804 Short 1500 Night 6000 Best call gi...Russian Call Girls in Pune Riya 9907093804 Short 1500 Night 6000 Best call gi...
Russian Call Girls in Pune Riya 9907093804 Short 1500 Night 6000 Best call gi...Miss joya
 
Call Girls Service In Shyam Nagar Whatsapp 8445551418 Independent Escort Service
Call Girls Service In Shyam Nagar Whatsapp 8445551418 Independent Escort ServiceCall Girls Service In Shyam Nagar Whatsapp 8445551418 Independent Escort Service
Call Girls Service In Shyam Nagar Whatsapp 8445551418 Independent Escort Serviceparulsinha
 
Call Girls Service Surat Samaira ❤️🍑 8250192130 👄 Independent Escort Service ...
Call Girls Service Surat Samaira ❤️🍑 8250192130 👄 Independent Escort Service ...Call Girls Service Surat Samaira ❤️🍑 8250192130 👄 Independent Escort Service ...
Call Girls Service Surat Samaira ❤️🍑 8250192130 👄 Independent Escort Service ...CALL GIRLS
 
VIP Call Girls Pune Vrinda 9907093804 Short 1500 Night 6000 Best call girls S...
VIP Call Girls Pune Vrinda 9907093804 Short 1500 Night 6000 Best call girls S...VIP Call Girls Pune Vrinda 9907093804 Short 1500 Night 6000 Best call girls S...
VIP Call Girls Pune Vrinda 9907093804 Short 1500 Night 6000 Best call girls S...Miss joya
 
Housewife Call Girls Hoskote | 7001305949 At Low Cost Cash Payment Booking
Housewife Call Girls Hoskote | 7001305949 At Low Cost Cash Payment BookingHousewife Call Girls Hoskote | 7001305949 At Low Cost Cash Payment Booking
Housewife Call Girls Hoskote | 7001305949 At Low Cost Cash Payment Bookingnarwatsonia7
 
VIP Call Girls Tirunelveli Aaradhya 8250192130 Independent Escort Service Tir...
VIP Call Girls Tirunelveli Aaradhya 8250192130 Independent Escort Service Tir...VIP Call Girls Tirunelveli Aaradhya 8250192130 Independent Escort Service Tir...
VIP Call Girls Tirunelveli Aaradhya 8250192130 Independent Escort Service Tir...narwatsonia7
 
Bangalore Call Girls Majestic 📞 9907093804 High Profile Service 100% Safe
Bangalore Call Girls Majestic 📞 9907093804 High Profile Service 100% SafeBangalore Call Girls Majestic 📞 9907093804 High Profile Service 100% Safe
Bangalore Call Girls Majestic 📞 9907093804 High Profile Service 100% Safenarwatsonia7
 
Call Girls Service Bellary Road Just Call 7001305949 Enjoy College Girls Service
Call Girls Service Bellary Road Just Call 7001305949 Enjoy College Girls ServiceCall Girls Service Bellary Road Just Call 7001305949 Enjoy College Girls Service
Call Girls Service Bellary Road Just Call 7001305949 Enjoy College Girls Servicenarwatsonia7
 
Call Girl Service Bidadi - For 7001305949 Cheap & Best with original Photos
Call Girl Service Bidadi - For 7001305949 Cheap & Best with original PhotosCall Girl Service Bidadi - For 7001305949 Cheap & Best with original Photos
Call Girl Service Bidadi - For 7001305949 Cheap & Best with original Photosnarwatsonia7
 
Russian Call Girl Brookfield - 7001305949 Escorts Service 50% Off with Cash O...
Russian Call Girl Brookfield - 7001305949 Escorts Service 50% Off with Cash O...Russian Call Girl Brookfield - 7001305949 Escorts Service 50% Off with Cash O...
Russian Call Girl Brookfield - 7001305949 Escorts Service 50% Off with Cash O...narwatsonia7
 

Recently uploaded (20)

Sonagachi Call Girls Services 9907093804 @24x7 High Class Babes Here Call Now
Sonagachi Call Girls Services 9907093804 @24x7 High Class Babes Here Call NowSonagachi Call Girls Services 9907093804 @24x7 High Class Babes Here Call Now
Sonagachi Call Girls Services 9907093804 @24x7 High Class Babes Here Call Now
 
CALL ON ➥9907093804 🔝 Call Girls Baramati ( Pune) Girls Service
CALL ON ➥9907093804 🔝 Call Girls Baramati ( Pune)  Girls ServiceCALL ON ➥9907093804 🔝 Call Girls Baramati ( Pune)  Girls Service
CALL ON ➥9907093804 🔝 Call Girls Baramati ( Pune) Girls Service
 
VIP Mumbai Call Girls Hiranandani Gardens Just Call 9920874524 with A/C Room ...
VIP Mumbai Call Girls Hiranandani Gardens Just Call 9920874524 with A/C Room ...VIP Mumbai Call Girls Hiranandani Gardens Just Call 9920874524 with A/C Room ...
VIP Mumbai Call Girls Hiranandani Gardens Just Call 9920874524 with A/C Room ...
 
Call Girls Service Jaipur Grishma WhatsApp ❤8445551418 VIP Call Girls Jaipur
Call Girls Service Jaipur Grishma WhatsApp ❤8445551418 VIP Call Girls JaipurCall Girls Service Jaipur Grishma WhatsApp ❤8445551418 VIP Call Girls Jaipur
Call Girls Service Jaipur Grishma WhatsApp ❤8445551418 VIP Call Girls Jaipur
 
Call Girls Service Pune Vaishnavi 9907093804 Short 1500 Night 6000 Best call ...
Call Girls Service Pune Vaishnavi 9907093804 Short 1500 Night 6000 Best call ...Call Girls Service Pune Vaishnavi 9907093804 Short 1500 Night 6000 Best call ...
Call Girls Service Pune Vaishnavi 9907093804 Short 1500 Night 6000 Best call ...
 
VIP Call Girls Indore Kirti 💚😋 9256729539 🚀 Indore Escorts
VIP Call Girls Indore Kirti 💚😋  9256729539 🚀 Indore EscortsVIP Call Girls Indore Kirti 💚😋  9256729539 🚀 Indore Escorts
VIP Call Girls Indore Kirti 💚😋 9256729539 🚀 Indore Escorts
 
Bangalore Call Girls Marathahalli 📞 9907093804 High Profile Service 100% Safe
Bangalore Call Girls Marathahalli 📞 9907093804 High Profile Service 100% SafeBangalore Call Girls Marathahalli 📞 9907093804 High Profile Service 100% Safe
Bangalore Call Girls Marathahalli 📞 9907093804 High Profile Service 100% Safe
 
CALL ON ➥9907093804 🔝 Call Girls Hadapsar ( Pune) Girls Service
CALL ON ➥9907093804 🔝 Call Girls Hadapsar ( Pune)  Girls ServiceCALL ON ➥9907093804 🔝 Call Girls Hadapsar ( Pune)  Girls Service
CALL ON ➥9907093804 🔝 Call Girls Hadapsar ( Pune) Girls Service
 
Low Rate Call Girls Pune Esha 9907093804 Short 1500 Night 6000 Best call girl...
Low Rate Call Girls Pune Esha 9907093804 Short 1500 Night 6000 Best call girl...Low Rate Call Girls Pune Esha 9907093804 Short 1500 Night 6000 Best call girl...
Low Rate Call Girls Pune Esha 9907093804 Short 1500 Night 6000 Best call girl...
 
VIP Call Girls Pune Vani 9907093804 Short 1500 Night 6000 Best call girls Ser...
VIP Call Girls Pune Vani 9907093804 Short 1500 Night 6000 Best call girls Ser...VIP Call Girls Pune Vani 9907093804 Short 1500 Night 6000 Best call girls Ser...
VIP Call Girls Pune Vani 9907093804 Short 1500 Night 6000 Best call girls Ser...
 
Russian Call Girls in Pune Riya 9907093804 Short 1500 Night 6000 Best call gi...
Russian Call Girls in Pune Riya 9907093804 Short 1500 Night 6000 Best call gi...Russian Call Girls in Pune Riya 9907093804 Short 1500 Night 6000 Best call gi...
Russian Call Girls in Pune Riya 9907093804 Short 1500 Night 6000 Best call gi...
 
Call Girls Service In Shyam Nagar Whatsapp 8445551418 Independent Escort Service
Call Girls Service In Shyam Nagar Whatsapp 8445551418 Independent Escort ServiceCall Girls Service In Shyam Nagar Whatsapp 8445551418 Independent Escort Service
Call Girls Service In Shyam Nagar Whatsapp 8445551418 Independent Escort Service
 
Call Girls Service Surat Samaira ❤️🍑 8250192130 👄 Independent Escort Service ...
Call Girls Service Surat Samaira ❤️🍑 8250192130 👄 Independent Escort Service ...Call Girls Service Surat Samaira ❤️🍑 8250192130 👄 Independent Escort Service ...
Call Girls Service Surat Samaira ❤️🍑 8250192130 👄 Independent Escort Service ...
 
VIP Call Girls Pune Vrinda 9907093804 Short 1500 Night 6000 Best call girls S...
VIP Call Girls Pune Vrinda 9907093804 Short 1500 Night 6000 Best call girls S...VIP Call Girls Pune Vrinda 9907093804 Short 1500 Night 6000 Best call girls S...
VIP Call Girls Pune Vrinda 9907093804 Short 1500 Night 6000 Best call girls S...
 
Housewife Call Girls Hoskote | 7001305949 At Low Cost Cash Payment Booking
Housewife Call Girls Hoskote | 7001305949 At Low Cost Cash Payment BookingHousewife Call Girls Hoskote | 7001305949 At Low Cost Cash Payment Booking
Housewife Call Girls Hoskote | 7001305949 At Low Cost Cash Payment Booking
 
VIP Call Girls Tirunelveli Aaradhya 8250192130 Independent Escort Service Tir...
VIP Call Girls Tirunelveli Aaradhya 8250192130 Independent Escort Service Tir...VIP Call Girls Tirunelveli Aaradhya 8250192130 Independent Escort Service Tir...
VIP Call Girls Tirunelveli Aaradhya 8250192130 Independent Escort Service Tir...
 
Bangalore Call Girls Majestic 📞 9907093804 High Profile Service 100% Safe
Bangalore Call Girls Majestic 📞 9907093804 High Profile Service 100% SafeBangalore Call Girls Majestic 📞 9907093804 High Profile Service 100% Safe
Bangalore Call Girls Majestic 📞 9907093804 High Profile Service 100% Safe
 
Call Girls Service Bellary Road Just Call 7001305949 Enjoy College Girls Service
Call Girls Service Bellary Road Just Call 7001305949 Enjoy College Girls ServiceCall Girls Service Bellary Road Just Call 7001305949 Enjoy College Girls Service
Call Girls Service Bellary Road Just Call 7001305949 Enjoy College Girls Service
 
Call Girl Service Bidadi - For 7001305949 Cheap & Best with original Photos
Call Girl Service Bidadi - For 7001305949 Cheap & Best with original PhotosCall Girl Service Bidadi - For 7001305949 Cheap & Best with original Photos
Call Girl Service Bidadi - For 7001305949 Cheap & Best with original Photos
 
Russian Call Girl Brookfield - 7001305949 Escorts Service 50% Off with Cash O...
Russian Call Girl Brookfield - 7001305949 Escorts Service 50% Off with Cash O...Russian Call Girl Brookfield - 7001305949 Escorts Service 50% Off with Cash O...
Russian Call Girl Brookfield - 7001305949 Escorts Service 50% Off with Cash O...
 

7 Journal of Life Sciences and Biomedicine (2710-4915 2710-3447).pdf

  • 1. (2021) 69 - 4 , vol. 3(76), No 2, p. 5 dicine Journal of Life Sciences & Biome 54 http://dx.doi.org/10.29228/jlsb.22 Available online 30 December 2021 Mapping of LC/LU changes inside the Aghdam district of the Karabakh economics region applying object-based satellite image analysis A.A. Rasouli1 , M.M. Asgarova2 *, S.H. Safarov3 1 Department of Environmental Sciences, Macquarie University, 12 Wally's Walk, North Ryde, Sydney, Australia 2 Faculty of History and Geography, Azerbaijan State Pedagogical University, 104 Hasan Aliyev Str., Baku AZ1072, Azerbaijan 3 Institute of Geography, Azerbaijan National Academy of Sciences, 115 H. Javid Ave., Baku AZ1143, Azerbaijan *For correspondence: matanat_askerova@mail.ru Received: September 29, 2021; Received in revised form: October 07, 2021; Accepted: October 09, 2021 Identification of the environmental consequences of the 30-year occupation of Karabakh and its ad- jacent territories by the Armenian armed formations is an important and urgent research task. Ob- ject-Based Image Analysis (OBIA) procedures were accordingly applied to examine the condition and changes in landcover and landuse (LC/LU) in the territories of Karabakh liberated from Arme- nian occupation within the Aghdam District. Firstly, Dynamic Thresholds Indexing (DTI) algorithms were operated to display the main LC by developing several spectral NDWI, NDVI, NBRI, and AVBI indices. At the next step, to recognize precise LU changes inside the study area, a rule-based Nearest Neighbour Classify (NNC) was considered by accompanying an advanced supervised classification technique within the Trimble eCognition setting (eCognition Developer, 2019). DTI results indicated that from 2016 to 2021 inside the Aghdam District, LC changes are quite meaningful. A significant decrease in vegetated cover (10.2 %), increases in the non-vegetated area (11.8 %), and the most noticeable changes are observed in vulnerable lands of about 45.1 km2 (26.8 %). Subsequently, the rule-based NNC method approved various negative LU changes inside the study area that had oc- curred predominantly to the mixed forest-pasture classes (9.8 %). Besides, the areas of degraded lands have increased by 35 % and barren lands by 4.4 % according to the study. It should be noted that water and agricultural LU demonstrate the least changes overall of 3.4 % and 0.3 %, respec- tively. The overall accuracy of 0.95 and Kappa statistics of 0.93 confirmed the significant changes in the final LC/LU productions. Consequently, accurate image processing and mapping of the current situation of the liberated regions of Azerbaijan have to be the most urgent tasks of the geographers, ecosystem scientists, and remote sensing specialists prior to the start of reconstruction and rehabili- tation projects by government officials and decision-makers. Keywords: Aghdam district, Karabakh region, LC/LU changes, sentinel-2 imagery, OBIA-based dynamic and threshold indexing, NNC supervised classification INTRODUCTION Occupying the territory of neighboring coun- tries can have serious catastrophic social, eco- nomic, and, of course, geographical, and ecologi- cal consequences (General Assembly Security Council, 2009). One of the vital consequences of the occupation of the Karabakh districts by Arme- nia had had significant changes in LC/LU types; and other environmental features of the region (Scheffer, 2010). Although the terms land cover and land use are often used interchangeably, their actual meanings are quite distinct. LC refers to the surface cover on the ground, whether vegetation, urban infrastructure, water, bare soil, or others.
  • 2. Mapping of LC/LU changes inside the Aghdam district of the Karabakh economics region 55 Identifying, delineating, and mapping LC is im- portant for large-scale monitoring studies, resource management, and planning activities. Identifica- tion of LC establishes the baseline from which monitoring activities (change detection) can be performed and provides the ground cover infor- mation for baseline thematic maps. Nevertheless, LU refers to the purpose the land serves, for exam- ple, recreation, wildlife habitat, or agriculture. LU applications involve both baseline mapping and subsequent monitoring, since timely information is required to know what current quantity of land is in what type of use and to identify the LU changes from year to year (Rasouli et al., 2021a). This knowledge will help develop strategies to balance conservation, conflicting uses, and developmental pressures. Issues driving LU studies include the re- moval or disturbance of productive land, urban en- croachment, and depletion of grasslands and for- ests. Accordingly, it is very important to distin- guish this difference between LC and LU, and the timely updated information that can be ascertained from each. The properties measured with remote sensing imagery relate to LC, from which LU can be inferred, particularly with a priori knowledge obtained by advanced image processing techniques (Kato, 2020). With high confidence, we believe that the fun- damental driving force of LC/LU changes in the Karabakh Economics Region is related to tem- poral-spatial processes caused by war activities such as the compulsory seizure of agricultural and livestock activities, along with the destruction of rare forests (Hasanov et al., 2017). Moreover, we should consider the uncontrolled erosion of soil, pasture, and unique historical monument buildings destruction caused by unprincipled mining activi- ties, multiple bombings, and land-mine landings within the occupied territories of Azerbaijan (Con- flict and Environment Observatory, 2021). Remote sensing makes it possible to collect data by sensing and recording reflected or emitted energy and pro- cessing, analyzing, and production of a variety of practical information in various fields (Lillesand et al., 2004). Through this modern technology, large amounts of row data and information in the form of digital satellite images are prepared and made available to researchers (Khandelwal et al., 2014a; Copernicus, Sentinel-2, 2020). Up to now, many different methods have been developed in the pro- cessing data obtained from remote sensing technol- ogy, each with its advantages and limitations. To detect the LC/LU situations over time, advanced OBIA methods could be applied to analyze post- war changes, focusing on the interesting areas. To date, several methods have been proposed in the process of producing LC/LU maps through satel- lite image processing, as it could be regarded as the science and art of acquiring information about the Earth's surface without being in contact with it (Franklin and Wulder, 2002). Accordingly, in the last few decades, a wide range of image processing procedures, especially focusing on DTI and dis- similar NNC methods are provided, each with its own goals, strengths, and weaknesses (Nelson and Khorram, 2018). Methods of extracting information through the indexing of satellite images have been common for many years, among these, may refer to NDVI and NDWI indicators with their advantages and limitations (Thenkabail et al., 2018). In recent years, intending to overcome the limitations of tra- ditional methods in the processing of satellite im- ages, new indexing methods have been introduced to high-light land surfaces such as vegetation cover, soil, and water bodies, by addressing a com- bination of fuzzy and thresholding methods (Ra- souli et al., 2020). Traditionally, two indexes of NDVI and NDWI are well-known and widely used land-cover indicators (Rehman and Hussain, 2018). Nevertheless, there are other effective in- dexes such as NBRI and AVBI for better quantify- ing of vegetation and soil conditions and more im- portantly the rate of risk and vulnerability of LU types by war actions, fire events, and other destruc- tive human activities (Pettorelli, 2013). Of course, the use of these indicators is associated with some limitations such as not recognizing and separating vegetation accurately, or mixing wetlands with wa- ter bodies. Nevertheless, it is possible that to justify and reduce such limitations by imposing rule- based thresholding methods and processing high- resolution satellites such as Sentinel-2 imagery (Sentinel-2 MSI User Guides, 2020). In a more precise step of satellite image pro- cessing, the NNC method could be used based on fuzzy classification functions to classify image ob- jects with more than one LU class (Khatami et al., 2016). NNC must be regarded as an advanced
  • 3. Rasouli et al. 56 method in object-based classification that comes close to its capability to classify high spatial reso- lution Sentinel-2 images. The reason is that we have the advantage of using intelligent image ob- jects with multiresolution segmentation in combi- nation with a supervised classification outline. This allows researchers to select samples for each LU class, by defining some criteria (rule-based algo- rithms) for classification procedure inside the eCognition software that classifies all objects seg- mented in the image (eCognition Reference Book, 2019). Before this stage, a Multi-Resolution Seg- mentation (MRS) must be fined that aggregates spatial information into groups that finds logical objects in the satellite RGB combined imagery (Baatz and Schape, 2000). For example, MRS pro- duces thin and long objects for water channels or roads, and it creates square objects of varying scales such as lakes or agricultural fields in the combined imagery bands of blue, green, red, infra- red, and so on. To run any MRS procedure there is a need to define a few criteria parameters such as Scale Shape, and Compactness to get ideal image objects. As a rule of thumb, it is possible to produce image objects at the biggest possible scale, but fur- thermore, be able to discern between objects. By selecting training samples and a well-represented number of samples for assigned LU classes (such as forest, pasture, agricultural, and water surface) the classification process could be run based on the objects. The selected samples and the defined sta- tistics expecting to reach the NN classification pro- duce the final products, even though there are still a couple of options to improve the accuracy (Foody, 2002). The authors believe that, after the liberation of the occupied territories, LC and LU changes would be perhaps the most important concern in many districts of the Karabakh Region (Rasouli et al., 2018b). It is recognized such contentious negative changes can significantly impact regional climate, ecosystem stability, water balance, stream silt up, biodiversity, and socioeconomic practices, thereby impinging on the regional economic progressing and overall quality of life in the coming years. In- tending to extract accurate information from the re- sulting changes in the research topic, the basic ob- jectives of the current study are: (a) applying DTI methods to understand the initial status of LC dur- ing the last period of the occupation stage inside the Aghdam District; (b) creating more accurate methods of rule-based NNC maps to access more details of LU status and resulting changes within the central district of Karabakh, which have been most affected during the occupation period. These aims could be accompanied by accurate infor- mation that facilitates future rehabilitations plan- ning (Rasouli et al., 2021a). THE STUDY AREA The study area is specified to the Aghdam District that located in the Karabakh Economics Region, with its most recognized city of Aghdam. The geographical location of the study area is pre- sented in Fig. 1. Aghdam is one of the 66 districts of Azerbaijan and is located in the west of the country and belongs to the Karabakh Economic Region. Most of these districts were under the oc- cupation of Armenian forces following the First Karabakh war in the early 1990s (Sayilan, 2007). However, as part of the 2020 Karabakh war vic- tory, Aghdam and the surrounding districts were returned to Azerbaijani control on 20 November 2020. In the current study, two Sentinel-2 images (approximately sized to 110 * 108 Km dimension) were subsetted to cover the entire area of the Agh- dam District. At the same size, they superimpose the Aghdam District and as well large parts of the administrative regions of Azerbaijan, including Ganja-Qazakh, Kalbajar-Lachin, Aran, and Karabakh that is one of the most important eco- nomic regions of Azerbaijan (Aliyev, I. The Presi- dent of the Republic of Azerbaijan, 2021). The Aghdam District represents the geographical and strategic importance of all sounded districts in the region. Therefore, the entire range of two Sentinel- 2 satellite images was taken on 12 August 2016 (during the occupation of the territory of Azerbai- jan by Armenia forces) and on 21 August 2021, nearly about nine months after the recapturing of the occupied territories.
  • 4. Mapping of LC/LU changes inside the Aghdam district of the Karabakh economics region 57 Fig. 1. The geographic location of Aghdam District in Azerbaijan and indicating of the Sentinel-2 image extension Aghdam has a mainly warm semi-arid climate that could change to the wet conditions in the west- ern parts would be affected by region complex re- lief and enduring water bodies. Most of the land in the study area includes agriculture, pastures, and unique forests (Rasouli et al., 2018c). Forests spread in the mountainous parts of the study area, gradually become lower and, create subalpine and alpine meadows. The occupation of the Azerbaijan territories by Armenia caused significant damage to the unique LC/LU types such as pasture, forests, especially those located in the frontal lines inside the Aghdam District, with a very rich flora species of higher plants (Valigholizadeh and Karimi, 2016). During the occupation period, agriculture became abounded and less economically important on the regional scale (FAOSTAT, 2014). DATA PROCESSED AND TECHNIQUES APPLIED a) Image Collection To access the main aims of the current study, we analyzed two images from Sentinel-2 satellite acquired by ESA's Open Access (https://scihub.co- pernicus.eu), selected for specific dates, character- ized in Table 1. Sentinel-2 is a European wide- swath, high-resolution, multi-spectral imaging mission. The full mission specification of the twin satellites flying in the same orbit but phased at 180°, is designed to give a high revisit frequency of 5 days at the Equator. Due to the balanced veg- etation cover and the absence of cloud cover in the summer months, the satellite images are limited re- lated to August months were processed (Sentinel Online, 2018).
  • 5. Rasouli et al. 58 Table 1. Basic information of the Sentinel-2 satellites Band Number Basic Descriptions Wavelength Range (µm) Central Wavelength (µm) Spatial Resolution (m) 1 Coastal Aerosol 0.433–0.453 0.443 60 2 Blue 0.4575–0.5225 0.490 10 3 Green 0.5425–0.5775 0.560 10 4 Red 0.65–0.68 0.665 10 5 Vegetation Red Edge 1 (VRE1) 0.6975–0.7125 0.705 20 6 Vegetation Red Edge 2 (VRE2) 0.7325–0.7475 0.740 20 7 Vegetation Red Edge 3 (VRE3) 0.773–0.793 0.783 20 8 Near-Infrared (NIR) 0.7845–0.8995 0.842 10 8A Vegetation Red Edge 4 0.855–0.875 0.865 20 9 Water Vapor 0.935–0.955 0.945 60 10 Shortwave Infrared Cirrus 1.36–1.39 1.375 60 11 Shortwave Infrared a 1.565–1.655 1.610 20 12 Shortwave Infrared b 2.1–2.28 2.190 20 Sentinel-2 MSI covering 13 spectral bands (443–2190 nm), with a swath width of 290 km and a spatial resolution of 10 m (4 visible and NIR bands), 20 m (six red edge and shortwave infrared bands) and 60 m, three atmospheric correction bands (Sentinel-2 MSI User Guides, 2020). For both sample sites, the Sentinel-2 images were pro- cessed for investigating the changes of LC/LU for the years 2016 and 2021. The selection of study ar- eas required the consideration that the experi- mental areas are representative and, thus, the veg- etation and non-vegetation types in the study areas should be abundant and diverse. Water bodies in- clude lakes, rivers and water reservoirs, and non- vegetation types include bare-land and other emerging classes such as degraded and burned lands. Fig. 2 shows two samples of Sentinel-2 im- ages with 3 band combinations for years 2016 and 2021, with the highest spatial resolution (10*10 m). The reduction of vegetation is completely de- tectable, particularly the rapid decline of green cover is visible across the region. Even, the soil sal- inization process can visually be observed in the region marked with white, reddish, and orange col- ours in the satellite imagery (Sentinel-2 MSI, 2020). b) Image Processing To build the image dataset, the aforemen- tioned Level 1C (TOA – Top of Atmosphere re- flectance) images were chosen based on the low cloud cover percentage and pre-processed for at- mospheric correction with the Sen2Cor plugin (SNAP software – Sentinel-2 Toolbox) provided by ESA (Szantoi and Strobl, 2019). Following the atmospheric correction, we obtained Level 2A (bottom of atmosphere reflectance) which is more useful than TOA reflectance when trying to detect a process on the surface such as vegetation and wa- ter, because of the atmospheric effects caused by the event itself are reduced. Then, each corrected multispectral satellite imagery was imported to the eCognition software setting, and accordingly, mixed RGB layers were created. To obtain func- tional information from the satellite images, we proposed a tool, called estimation of scale parame- ter (ESP), that builds on the idea of local variance (LV) of object heterogeneity within a scene (Iko- kou and Smit, 2013). When segmentation settings were modified based on the ESP - depending on the image quality (bands available, and image spatial- resolution) pixels of any satellite image were grouped into image objects before object-based in- dexing and classification methods could be per- formed. In the segmentation stage of satellite im- ages, for scale parameter is taken about 55 and the shape and compactness indexes (with trial and er- ror) were suggested as 0.3 and 0.7 respectively. The other main features of Sentinel-2 image layer weighting and segmentation parameters are pre- sented in Table 2.
  • 6. Mapping of LC/LU changes inside the Aghdam district of the Karabakh economics region 59 Fig. 2. Samples of Sentinel-2 imagery reflecting green cover destruction adjusted for the entire Aghdam District for years 2016 and 2021
  • 7. Rasouli et al. 60 Table 2: The main features of Sentinel-2 image layer weighting and segmentation features Bands b2 b3 b4 b7 b8 b8a b11 b12 Image RGB Layer Mixing & Weighting B1 B3 G1 G3 R1 & G1 R3 R1 -- Segmentation Setting 1 1 1 1 2 2 1 1 Along with implementing DTI procedures, equations 1-4 were step-wisely applied to create the basic NDWI, NDVI, NBRI, and AVBI indexes. In the dynamic thresholding stage, each index is re- garded as an indicator of specified land surfaces, which typically refers to a spectral measure of the change in the satellite image band's reflections (Dozier, 1989). 𝑵𝑫𝑾𝑰 𝑺𝟐 = "(𝒃𝟑 − 𝒃𝟖) (𝒃𝟑 + 𝒃𝟖) ⁄ " (Equation 1) If mean NDWI >= 0.1; classified as Water 𝑵𝑫𝑽𝑰 𝑺𝟐 = "(𝒃𝟖 − 𝒃𝟒) (𝒃𝟖 + 𝒃𝟒) ⁄ " (Equation 2) if mean NDVI >= 0.25; classified as Vegetation 𝑵𝑩𝑹𝑰 𝑺𝟐 = "(𝒃𝟖𝒂 − 𝒃𝟏𝟐) (𝒃𝟖𝒂 + 𝒃𝟏𝟐) ⁄ " (Equation 3) If mean NBRI >= 0.12; classified as Burned Lands 𝑨𝑽𝑩𝑰 𝑺𝟐 = "(𝒃𝟐 + 𝒃𝟑 + 𝒃𝟒) 𝟑 ⁄ " (Equation 4) If mean AVBI >= 2000; classified as Degraded Lands Inside the eCognition Developer version 9.5, based on the above-mentioned equations any index layer calculation algorithm inserts a new image layer by differentiating between dissimilar band combinations (Rasouli and Mammadov, 2020a). In usage, the NDWI index was first used NIR radia- tion and visible green light to enhance the presence of water bodies while in the study area by eliminat- ing the presence of soil and terrestrial vegetation features. In turn, the NDVI standardized vegetation index allowed us to generate an indicator showing the relative biomass on the image. The chlorophyll absorption in the red band and relatively high re- flectance of vegetation in the NIR band are used for calculating NDVI values. Furthermore, an NBRI was applied to the Sentinel-2 bands to cap- ture likely burned lands in the local scales. It is a numerical indicator that combines Vegetation Red Edge (b8a) and Shortwave Infrared (b12) bands. Along with the other indicators, the standardized burning index NBRI has been used to highlight the burned areas, while muffing the difference in light- ing and atmospheric conditions. It is ideal for de- tecting localized burned areas, especially in the de- tection of burned or burning places (farmlands and pastures) which intentionally were set on fires (Simone et al., 2020). Fire-affected areas have rela- tively low near-infrared reflectance (NIR) and high reflectance in the short-wave infrared band (SWIR). It should be noted that in the process of adjusting the above-mentioned indicators, the Average Visible Brightness Index (AVBI) was regulated by trial- and-error thresholds, with the goal of recognizing and producing existing degraded lands. Lastly, for quantitative analysis of Sentinel-2 images, the NNC supervised classification proce- dure was used to create LU maps based on the OBIA structure (Kato, 2020). Supervised classifi- cation involves the use of training area data that are considered representative of each LU type to be classified, consists of a few major steps. First, after the creation of required projects inside the eCogni- tion setting, multiresolution segmentation algo- rithms and parameters are set and executed in the creation of certain image objects. Then, inside the Class Hierarchy box different classes of water, for- est & pasture, agriculture, barren-lands, degraded and burned lands (as vulnerable classes) were de- fined according to the objects structure in the im- age object domain and their nearest sample neigh- bors. The nearest neighbor classifies image objects in each feature space and with given samples for the classes of concern, inside the eCognition soft- ware, needed for each type of class. After a repre- sentative set of samples, objects have been de- clared, the algorithm searches for the closest sample object in the defined feature space for each image object. It selects the highest accurate features to be considered for the feature space closest sample ob- ject belongs to LU classes by applying certain mem- bership functions allows defining the highest rela- tionship between feature values and the degree of membership to a class using fuzzy logic operators. Then, if the image object differs from the sample, the feature space distance has a fuzzy dependency on the distance to the nearest sample classes during the NNC procedure (Kamusoko, 2019). In a few cases, especially when classes were not clearly distinguished on the image sketch, the Sample Editor window, as a principal tool for checking samples, was applied to automatically
  • 8. Mapping of LC/LU changes inside the Aghdam district of the Karabakh economics region 61 generate membership functions. It was also used to compare the attributes or histograms of image ob- jects and samples of different classes. It is helpful to get an overview of the feature distribution of image objects or samples of specific classes. The features of an image object can be compared to the total dis- tribution of this feature over one or all image object levels. In addition, to assess the quality of samples the Sample Selection Information window was ap- plied to decide if an image object contains new in- formation for a class, or if it should belong to an- other LU class. To ensure that the output LU maps are reliable, and quantitative accuracy methods were employed to assess the producer’s accuracy, user’s accuracy, overall accuracy, and Kappa coefficient of NNC classification. In the end, applying different accuracy assessment tools, such as the Stability dia- log box and The Error Matrix (based on TTA Mask) it was possible to produce statistical outputs to in- crease the quality of the classification results (eCog- nition Developer, 2021). RESULTS a) Indices LC Maps To compare the changes of LC types all over the study area the water body, vegetation, non-veg- etation, and vulnerable classes are shown in Fig. 3. The decrease in vegetation can be traced inside the Aghdam District by accurate examination of LC classes during the last years with significant nega- tive changes inside the study area. Looking closely at the amounts of LC classes on the legend of maps in Fig. 4, it could be detected that the amount of vegetation cover over the last 6 years has reduced nearly to about 27.8 km2 (10.2 %). At the same time, about 78.2 km2 (11.8 %) has been added to the Non-Vegetated LC. Meanwhile, Vulnerable Lands were changed by about 45.1 km2 (-26.8 %), even though this amount was at its maximum in 2016 with 168.4 km2 . This amount decrease could be related to the reduction of deliberate fires in the green-covers and ended the abolition of land occu- pation. To achieve more accuracy, it was necessary to create LU maps with more classes and accurate NNC techniques. Fig. 3. LC maps produced by indexing techniques ad- justed for the Sentinel-2 imagery 2016 and 2021 b) Classified LU Maps By introducing MRS algorithms and NNC procedures, LU maps, with six classes, were pro- duced and adjusted for the Aghdam District. To be certain about the result of NNC the performance of closing LU classes was cheeked in detail with dif- ferent image mixed layer weights and multiresolu- tion segmentation parameters (Fig. 4).
  • 9. Rasouli et al. 62 Classified Map Multiresolution Segmentation Image Layer Weighted & Mixed NNC Steps / Landuse Water Surface Forests & Pastures Agricultural Fields Barren Lands Degraded Lands Burned Lands Fig 4. The performance of final NNC classified LU classes, examples with different image mixed layer weights, and multiresolution segmentation
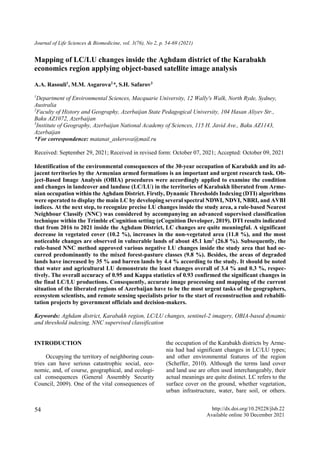
  • 10. Mapping of LC/LU changes inside the Aghdam district of the Karabakh economics region 63 Fig. 5. Final LU maps of 2016 and 2021 classified by NNC techniques Due to the careful visual interpretation and a quantitative accuracy index, the performance (for each class) was controlled, and promising accu- rate maps were produced. By carefully testing the preformed samples, produced layers were im- ported to the ArcGIS setting and final classified LU maps of 2016 and 2021 were mapped (Fig. 5). Examination of the resulting LU maps indi- cated that the reduction in forests & pastures (-9.8%) and barren lands (+4.4%) inside the Agh- dam District are quite considerable (Fig.5). As it is noticeable in Fig 6, changes in other classes are also evident by emerging more degraded lands (+35%) and reducing burned lands (-36.9%). Amounts of raise in water surface class (+3.4%) and agricultural fields (+0.3%) are not quite meaningful from 2016 to 2021.
  • 11. Rasouli et al. 64 Fig. 6: Changes in the LU types in 2016 and 2021 adjusted to the Aghdam District. The values in parentheses (in %) indicate a decrease (-) or increase (+) concerning any of LU classes DISCUSSION During the long-term occupation stage, the fundamental driving force of LC/LU changes has been related to war activities such as the compul- sory seizure of agricultural and livestock activi- ties, along with the destruction of rare forests (IDMC, 2021). Moreover, we should consider the uncontrolled erosion of soil, pasture, and unique historical monument buildings destruction caused by unprincipled mining activities, multiple bomb- ings, and land-mine landings within the occupied territories. Eventually, the improper landuse and lack of proper care of human and natural re- sources led to widespread destruction and even extinction of many plants and wildlife species in the region (Baumann et al., 2013). Thereafter, our main goal was to assess LC and LU changes inside the Aghdam District by applying OBIA DTI and rule based NNC meth- ods respectively. Primary, to understand the ex- tent of changes in basic LC types, we processed multi-temporal Sentinel-2 imagery (sampled for 2016 and 2021) and introduced a few rule-based indexes of NDWI, NDVI, NBRI and, AVBI con- sequences. It was found that alongside the study area, reduction of LC was accelerated during the recent years, and continuously green covers are being destroyed, particularly by degrading and burning procedures during the occupied periods (notice Fig. 3). With emphasis, vulnerable areas were defined in two states of burned and de- graded lands that are areas that have lost a major degree of their natural productivity due to war- caused processes (Gibbs and Salmon, 2015). Other effective factors contributing to the rapid destruction of vegetation and soil loss include fires that are proposed by war behaviors and ag- ricultural needs (Kust et al., 2017). Both destruc- tive factors are influential in the process of LC/LU changes by properly using indicators, as were applied in the current study. Hence, DTI methods could be effective methods by enclosing the spectral, spatial, multitemporal, and multisen- sory information; and incorporation of ancillary data into indexing procedures (Mammadov and Rasouli, 2020). 1.45 1.5 42.7 38.5 137.5 137.9 727.7 759.6 37.7 50.9 111.9 70.6 0 100 200 300 400 500 600 700 800 August 12, 2016 August 21, 2021 A r e a K m 2 Landuse Classes Water Surface (+3.4) Forest & Pasture (-9.8) Agricultural Fields (+0.3) Barren Lands (+4.4) Degraded Lands (+35) Burned Lands (-36.9)
  • 12. Mapping of LC/LU changes inside the Aghdam district of the Karabakh economics region 65 Furthermore, the OBIA segmentation and NNC results (figures 5 and 6) indicated that the vegetation trend (particularly forests and pas- tures) is negative in the decreasing mode and the LU changes are signs all over the Karabakh Re- gion (Hay and Castilla, 2006; Rasouli et al., 2021). As the result of the rule based NNC tech- nique indicated the amount of burned lands in 2021 was much (36.9 %) lower than in 2016. This reduction can certainly be related to the recaptur- ing of the occupied territories and the reduction of deliberate fires in the region. Nevertheless, ac- curacy assessment, with an overall accuracy of 0.95 and Kappa statistics with 93 %, was an inte- gral part of the current study DTI and NNC pro- cedure. Without doubts, uncertainty and error propagation in the modern image-processing chain is still an important factor influencing the final LU map's accuracy (Blaschke, 2010). Ulti- mately, identifying the weakest links in the chain and then reducing the uncertainties is critical to the improvement of digital image processing ac- curacy (Lobo and Chick, 1996). For future inves- tigators, increasing the accuracy of the results of similar research field operations is a necessary profession. CONCLUSION The current introductory study's main goal was to map the LC/LU changes by the processing of satellite Sentinel-2 imagery inside the Aghdam District for the years 2016 and 2021. Considering so, the other objectives of this research were to evaluate the potential of the OBIA functions of DTI and rule based NNC methods inside the eCognition Developer setting. Based on these ap- proaches, the following results were obtained:  during the occupation period, LC and LC types have continuously been changed.  LC and LU detection and mapping was a cru- cial task in previously occupied districts, by the processing of moderate resolution Senti- nel-2A (10 m) images, in place of commercial satellite images, enable LU mapping with lit- tle to no cost.  the OBIA methods could be regarded as a sub- discipline of geo-information science devoted to partitioning remote sensing imagery into meaningful image objects and assessing their characteristics through spatial, spectral, and temporal scales.  although the OBIA is found to be a very ad- vanced image processing procedure, neverthe- less we think that it could be compared in fu- ture research along with quite professional programs as Support Vector Machine, and Machine-Learning / Deep-learning ap- proaches to detect highly accurate LU changes with high confidence.  by processing high-resolution imagery, we may carry out much more detailed information by expanding the study site to other liberated districts with an emphasis on the Karabakh Region to visualize the most likely reduction in green covers and associated damages that have been imposed on the country valuable ecological resources.  a multi-platform and multi-purpose real-time monitoring system is almost immediately re- quired if it is not yet too late. Such reclamation projects could be managed by Azeri-nation staff to do this critical nationwide advanced engagement. REFERENCES Aliyev I. (2021) President of Republic of Azer- baijan, 2021. İnzibati-ərazi vahidləri, Azərbay- can Respublikası Prezidentinin İşlər İdarəsi Pre- zident Kitabxanasi. Baatz M., Schape A. (2000) Multi-resolution segmentation – an optimization approach for high quality multi-scale segmentation. In: J.Strobl et al. (eds.), Angewandte Geogra- phische Informations verarbeitung XII, Beiträ- gezum AGIT Symposium. Salsburg, Karlruhe, Herbert Wichmann Verlag, p.12-23. Baumann M., Volker C., Radeloff V., Avedian T. (2013) Land-use change in the Caucasus dur- ing and after the Nagorno-Karabakh conflict. Reg. Environ Change, 15:170. Blaschke T. (2010) Object-based image analysis for remote sensing. ISPRS International Jour- nal of Photogrammetry and Remote Sensing, 65(1): 2-16.
  • 13. Rasouli et al. 66 Conflict and Environment Observatory (2021) Report: Investigating the environmental dimen- sions of the 2020 Nagorno-Karabakh conflict Published: February 2021; Categories: Publica- tions, Law and Policy. Copernicus Sentinel-2 (2020) Satellite Missions – eoPortal Directory. Directory.eoportal.org. Re- trieved 5 March. Dozier J. (1989) Spectral signature of Alpine snow cover from LANDSAT Thematic Map- per. Remote Sensing of Environment, 45: 9-22. eCognition Reference Book (2019) eCognition Developer for Windows operating system, Ver- sion 9.5.1, Trimble. Munich, Germany. eCognition Developer Software 10.1 (2021) Trimble Germany GmbH, Munich, Germany. FAOSTAT (2014) Statistical database of the Food and Agricultural Organization. Available at: http://faostat.fao.org/. Foody G.M. (2002) Status of land cover classifi- cation accuracy assessment. Remote Sensing of Environment, 80(1): 185-201. Franklin S.E., Wulder M.A. (2002) Remote sensing methods in medium spatial resolution satellite data land cover classification of large areas. Progress in Physical Geography, 26, 173−205. General Assembly Security Council (2009) Letter dated 30 September 2009 from the Per- manent Representative of Azerbaijan to the United Nations addressed to the Secretary-Gen- eral, Protracted conflicts in the GUAM area and their implications for international peace, secu- rity, and development. The situation in the oc- cupied territories of Azerbaijan Security Coun- cil Sixty-fourth year. Gibbs H.K., Salmon J.M. (2015) Mapping the world's degraded lands. Applied Geography, 57: 12-21. Hasanov Z.M., Ibrahimov Z.A., Nabiyev V.R. (2017) "Beech forests of Azerbaijan: The mod- ern condition, age structure and regeneration. Annals of Agrarian Science, 15(4): 453–457; 1512-1887. Hay G.J., Castilla G. (2006) Object-based Im- age Analysis, Strengths, weaknesses, opportu- nities, and threats (SWOTs). From OBIA 2006. International Archives of Photogrammetry, Re- mote sensing, and Spatial Information Sciences. Ikokou G., Smit J. (2013) A technique for opti- mal selection of segmentation scale parameters for object-oriented classification of urban scenes. South Afr. J. Geomatica, 2 (4): International Displacement Monitoring Cen- tre (IDMC) (2021) Nagorno-Karabakh con- flict: finding common ground in respect of the dead, News and Press Release ICRC. Kamusoko C. (2019) Remote Sensing Image Classification (Springer Geography) 1st ed., Publisher: Springer. Kato L. (2020) Integrating Open-street map Data: in Object-Based Land-Cover and Land- Use Classification for Disaster Recovery, Pub- lisher: LAP LAMBERT Academic Publishing, 76 p. Khandelwal P., Singh K., Mehrotra A. (2014a) Unsupervised Change Detection from Satellite Images Using KCN, LAP LAMBERT Aca- demic Publishing. Khatami R., Mountrakis G., Stehman S.V. (2016) A meta-analysis of remote sensing re- search on supervised pixel-based land cover im- age classification processes: general guidelines for practitioners and future research. Remote Sens. Environ., 177: 89–100. Kust G., Andreeva O., Cowie A. (2017) Land Degradation Neutrality: Concept development, practical applications and assessment. Journal of Environmental Management, 195: 16-24. Lillesand T., Kiefer R., Chipman J. (2004) Re- mote Sensing and Image Interpretation. 5th ed. John Wiley and Sons Inc, New Jersey. Lobo A., Chick O.A., Casterad A. (1996) Clas- sification of Mediterranean crops with multi- sensory data: Per-pixel versus per-object statis- tics and image segmentation, Int. Journal of Re- mote Sensing, 17 (12): 2385-2400. Nelson S., Khorram S. (2018) Image Processing and Data Analysis with ERDAS IMAGINE. 1st ed., Kindle Edition, CRC Press. Pettorelli, N. (2013) The Normalized Difference Vegetation Index, 1st Edition, Kindle Edition, OUP Oxford. Rasouli A.A., Mammadov R., Pishnamaz M., Hushmand A., Safarov E. (2018b) Assess- ment of Forest Cover Changes by Applying Ob- ject-Oriented Procedures inside the Karabakh Occupied Region. Eurasian GIS 2019 Congress 04-07 September 2018. Baku, Azerbaijan.
  • 14. Mapping of LC/LU changes inside the Aghdam district of the Karabakh economics region 65 Rasouli A.A., Mammadov R., Safarov E., Mo- hammadzadeh K. (2018c) Fuzzy Object- Based Landcover/Use Mapping of The Karabagh Region by Processing of Sentinel Sat- ellite Imageries. Eurasian GIS 2019 Congress 04-07 September 2018. Baku, Azerbaijan. Rasouli A.A., Mammadov R. (2020a) Prelimi- nary Satellite Image Analysis Inside the ArcGIS Setting, Lambert Academy Publishing, Ger- many. Rasouli A.A., Mammadov G.SH., Asgarova M.M. (2021a) Mastering Spatial Data Analysis Inside the GIS Setting, Azerbaijan State Peda- gogical University. Faculty of History and Ge- ography, Baku. Rasouli A.A., Mammadov R., Asgarova M.M. (2021b) Application of Satellite Image Pro- cessing Methods in Mapping of Land- cover/Landuse Changes inside the Karabakh Liberated Territories. Azərbaycan Milli Elmlər Akademiyasi, AMEA-nın Biologiya və Tibb Elmləri Bölməsinin Konfransı. Rehman S., Hussain M. (2018) Fuzzy C-means algorithm-based satellite image segmentation. Indonesian Journal of Electrical Engineering and Computer Science, 9(2): 332–334. Sayilan M.O. (2007) 1988–95 Arası dağlık Karabağ Sorunu, Karabakh conflict between 1988–1995. Master Project, Ankara University. Scheffer M. (2010) Foreseeing tipping points. Nature, 467: 411–412. Sentinel Online (2018) Multispectral Instrument (MSI) Overview, European Space Agency. Re- trieved 3 December 2018. Sentinel-2 MSI User Guides (2020) Radio- metric Resolutions Sentinel-2 MSI (2020) Sen- tinel Online. Sentinel.esa.int. Retrieved 5 March 2020. Simone W.D., Musciano M.D., Cecco W.D., Ferella G., Frattaroli A.R. (2020) The poten- tiality of Sentinel-2 to assess the effect of fire events on Mediterranean mountain vegetation. Plant Sociology, 57: 11-22. Szantoi Z., Strobl P. (2019) Copernicus Sentinel- 2 Calibration and Validation, European Journal of Remote Sensing, 52, Issue 1. Thenkabail P.S., Lyon J.G., Huete A. (2018) Fundamentals, Sensor Systems, Spectral Li- braries, and Data Mining for Vegetation (Hy- perspectral Remote Sensing of Vegetation). 2nd ed., CRC Press. Valigholizadeh A., Karimi M. (2016) Geo- graphical explanation of the factors disputed in the Karabakh geopolitical crisis, Journal of Eurasian Studies, 7: 172–180. Qarabağ iqtisadi rayonu torpaq örtüyü və torpaqdan istifadədəki dəyişikliklərin Ağdam rayonu daxilində peyk şəkillərinin obyekt yönümlü təhlili əsasında xəritələşdirilməsi A.A. Rəsuli1 , M.M. Əsgərova2 , S.H. Səfərov3 1 Makkuari Universitetinin Ətraf Mühit Elmləri Departamenti, Sidney, Avstraliya 2 Azərbaycan Dövlət Pedaqoji Universitetinin Tarix-coğrafiya fakültəsi, Bakı, Azərbaycan 3 AMEA-nın Coğrafiya İnstitutu, Bakı, Azərbaycan Erməni silahlı birləşmələri tərəfindən Qarabağın və ona bitişik ərazilərin 30 illik işğalının ekoloji nəticələ- rinin araşdırılması və müəyyən edilməsi vacib və təxirəsalınmaz vəzifələrdən biridir. Ağdam rayonu dax- ilində erməni işğalından azad edilmiş ərazilərdə torpaq örtüyünün və torpaqdan istifadənin (LC/LU) vəziy- yətini və ehtimal edilən dəyişiklikləri öyrənmək üçün obyekt yönümlü görüntü analizi (OBIA) prosedurları tətbiq edilmişdir. Əvvəlcə, bir neçə spektral indekslərdən istifadə etməklə - NDWI, NDVI, NBRI və AVBI, torpaq örtüyünü (LC) əks etdirmək üçün dinamik fərq indeksinin (DTI) alqoritmləri tətbiq edilmişdır. Son- ra, tədqiqat sahəsi daxilində dəqiq torpaqdan istifadə dəyişikliklərini müəyyən etmək üçün Trimble eCog- nition platformasında təkmilləşdirilmiş nəzarət sinifləndirmə metodu olan ən yaxın qonşu təsnifatı (NNC) metodundan istifadə edilmişdir (eCognition Developer, 2019).
  • 15. Rasouli et al. 68 Dinamik həddlərin indeksləşdirilməsi (DTI) alqoritmlərinin istifadəsi göstərdi ki, 2016-2021-ci illərdə Ağ- dam rayonu daxilində torpaq örtüyündə (LC) olduqca əhəmiyyətli dəyişikliklər baş vermişdir, bitki örtüyü- nün əhəmiyyətli dərəcədə azalmış (10,2%), bir hissəsi tamamilə məhv olmuş (11,8%), həssas torpaqlarda olduqca nəzərə çarpan dəyişikliklər (26,8%) meydana çıxmışdır. Ən yaxın qonşu klassifikasiya metodu (NNC) əsasında bir neçə torpaq istifadəsi dəyişiklikləri aşkar edilib: meşə və otlaq sahələrinin 9,8% azal- mış, deqradasiya olunmuş torpaq sahələri 35%-ə qədər, qeyri-münbit torpaq sahələri 4,4%-ə qədər artmışdır və bu proses davam etməkdədir. Qeyd edək ki, su səthinin və kənd təsərrüfatı torpaqlarından istifadədə (LU) dəyişikliklər daha az müşahidə olunmuş və müvafiq olaraq 3,4% və 0,3% təşkil etmişdir. Ümumi dəqiqliyin 0,95 və Kappa əmsalının 93% olması torpaq örtüyü və torpaqdan istifadənin (LC/LU) vəziyyə- tində baş vermiş dəyişikliklərin statistik əhəmiyyətli olduğunu təsdiq edir. Beləliklə, səlahiyyətli hökümət nümayəndələrinin bərpa və layihə işlərinə başlamaq haqqında qərar verməsindən əvvəl, Azərbaycanın azad edilmiş rayonlarının hazırkı vəziyyətinin hərtərəfli analizi və xəritələşdirilməsi coğrafiyaçıların, ekoloqla- rın və uzaqdan alqılama mütəxəssislərinin ən təxirəsalınmaz vəzifələrinə çevrilməlidir. Açar sözlər: Ağdam rayonu, Qarabağ, torpaq örtüyü və torpaqdan istifadənin dəyişməsi (LC/LU), Senti- nel-2 şəkilləri, OBIA əsasında dinamik və həddi indeksləşdirmə, ən yaxın qonşu təsnifatı (NNC) Картирование изменений земельного покрова и землепользования в Карабахском экономическом районе на основе объектно-ориентированного анализа спутниковых снимков в пределах Агдамского района А.А. Расули1 , М.М. Асгарова2 , С.Г. Сафаров3 1 Департамент наук об окружающей среде Университетa Маккуори, Сидней, Австралия 2 Факультет истории и географии Азербайджанского государственного педагогического университета, Баку, Азербайджан 3 Институт географии НАН Азербайджана, Баку, Азербайджан Исследование и выявление экологических последствий 30-летней оккупации Карабаха и прилегаю- щих к нему территорий армянскими вооруженными формированиями, является одним из важных и актуальных задач. Для изучения состояния и вероятных изменений земельного покрова и земле- пользования (LC/LU) на освобождённых от армянской оккупации территориях Карабаха в пределах Агдамского района были использованы процедуры объектно-ориентированного анализа изображе- ний (OBIA). Сначала были применены алгоритмы динамической индексации пороговых значений (DTI) для отображения земельного покрова (LC) путём разработки нескольких спектральных ин- дексов NDWI, NDVI, NBRI и AVBI. Затем, с целью выявления точных изменений землепользования внутри исследуемой области, был использован усовершенствованный контролируемый метод клас- сификации в рамках настройки Trimble eCognition - метод классификации ближайшего соседа (NNC) (eCognition Developer, 2019). Результаты динамической индексации пороговых значений (DTI) показали, что с 2016 по 2021 годы внутри Агдамского района произошли существенные из- менения земельного покрова (LC), значительное уменьшение растительного покрова (10,2%), уве- личение невегетативной зоны (11,8%) и появление довольно заметных изменений на ранее оккупи- рованных землях (26,8%). Впоследствии, методом классификации ближайшего соседа (NNC) были обнаружены различные отрицательные изменения землепользования внутри исследуемой области - сокращение лесов и пастбищ на 9,8%, увеличение площади деградированных земель до 35% и бес- плодных земель до 4,4%. Следует отметить, что минимальные изменения наблюдались для водной поверхности и сельскохозяйственного землепользования (LU) до 3,4% и 0,3%, соответственно. Зна- чения общей точности 0,95 и коэффициента Kaппa 0,93 подтвердили статистическую значимость
  • 16. Mapping of LC/LU changes inside the Aghdam district of the Karabakh economics region 69 изменений состояния земельного покрова и землепользования (LC/LU). Следовательно, точная об- работка изображений и картирование текущего положения освобожденных районов Азербайджана должны стать наиболее актуальными задачами ученых географов, экологов и специалистов по ди- станционному зондированию до того, как лица, принимающие решения в правительстве, приступят к проектам реконструкции и реабилитации. Ключевые слова: Агдамский район, Карабах, изменения земельного покрова и землепользования (LC/LU), снимки Sentinel-2, динамическая и пороговая индексация на основе OBIA, контролируемая классификация ближайшего соседа (NNC)