6-*
International Business
Environments & Operations
15e, Global Edition
Daniels ● Radebaugh ● Sullivan
Copyright © 2015 Pearson Education Ltd.
*
International Business Environments and Operations 15e,
Global Edition by Daniels, Radebaugh, and Sullivan
6-*
Chapter 6
Trade Protectionism
Copyright © 2015 Pearson Education Ltd.
*
Chapter 6: Trade Protectionism
6-*
Learning ObjectivesExplain why governments try to enhance
and restrict tradeShow the effects of pressure groups on trade
policiesCompare the potential and actual effects of government
intervention on the free flow of tradeIllustrate the major means
by which trade is restricted and regulated
Copyright © 2015 Pearson Education Ltd.
*
The Learning Objectives for this chapter areTo explain the
rationales for governmental policies that enhance and restrict
tradeTo show the effects of pressure groups on trade policiesTo
describe the potential and actual effects of governmental
intervention on the free flow of tradeTo illustrate the major
means by which trade is restricted and regulatedTo demonstrate
the business uncertainties and business opportunities created by
governmental trade policies
Learning ObjectivesDemonstrate the business uncertainties and
opportunities created by governmental trade policiesDiscern
how businesses may respond to import competitionFathom how
the growing complexity of products and trade regulations may
affect the future
6-*
Copyright © 2015 Pearson Education Ltd.
Copyright © 2015 Pearson Education, Inc.
6-*
IntroductionProtectionism - policies that affect the ability of
foreign producers to compete in your home marketlimit or
enhance your company’s ability to sell abroad or acquire needed
foreign supplies
Copyright © 2015 Pearson Education, Inc.
*
While free trade is beneficial, in reality all countries regulate
the flow of goods and services across their borders.
Governments want to help companies that are struggling, but
it’s difficult to do so without hurting those that are doing well.
Copyright © 2015 Pearson Education, Inc.
6-*
Introduction
Physical and Social Factors Affecting the Flow of Goods and
Services
Copyright © 2015 Pearson Education, Inc.
*
This Figure shows the physical and social factors that affect the
flow of goods and services.
6-*
Conflicting Results
of Trade PoliciesGovernments intervene in trade to achieve
economic, social, and political goalsPolicymakers are
challenged byconflicting objectivesinterest groups
Copyright © 2015 Pearson Education Ltd.
*
Government officials use trade policy to try to achieve
economic, social, and political goals. However, their efforts are
hampered by uncertain and conflicting policy outcomes, as well
as the goals of special interest groups.
6-*
The Role of StakeholdersProposed policies on trade spark
debate Stakeholders include WorkersOwnersSuppliersLocal
politiciansConsumers usually don’t care
Copyright © 2015 Pearson Education Ltd.
*
Proposed government policies often spark fierce debate among
those who could be affected. Those who are most directly
affected tend to be loudest in voicing their concerns.
6-*
Economic Rationales for Governmental Intervention
Learning Objective:
Explain why governments try to enhance and restrict trade
Copyright © 2015 Pearson Education Ltd.
*
Learning Objective : To explain the rationales for governmental
policies that enhance and restrict trade.
6-*
Economic Rationales for Government Intervention
Why governments intervene in tradeEconomic
rationalesFighting unemploymentProtecting infant
industriesPromoting industrializationImproving comparative
positionNon-economic rationalesMaintaining essential
industriesPromoting acceptable practices abroadMaintaining or
extending spheres of influencePreserving national culture
Copyright © 2015 Pearson Education Ltd.
*
This Table shows the reasons for government intervention in
trade. Notice that there are both economic and noneconomic
reasons for intervention.
6-*
Fighting Unemployment
Learning Objective:
Show the effects of pressure groups on trade policies
Copyright © 2015 Pearson Education Ltd.
*
Learning Objective : To show the effects of pressure groups on
trade policies.
6-*
Fighting UnemploymentThe unemployed are the most effective
pressure groupBut, import restrictionscan lead to retaliation by
other countriesare less likely retaliated against effectively by
small economiesare less likely to be met with retaliation if
implemented by small economiesmay decrease export jobs
because of price increases for componentsmay decrease export
jobs because of lower incomes abroad
Copyright © 2015 Pearson Education Ltd.
*
Unemployed people are one of the most effective pressure
groups for restrictions on imports. But, trying to fix
employment problems using trade policy can create new
challenges.
Costs that are often associated with import restrictions include
higher prices and higher taxes. Governments must balance the
potential for these costs with the benefits of creating new jobs.
Fiscal and monetary policies may be more effective at
correcting unemployment problems.
6-*
Protecting ‘Infant Industries’
Learning Objective:
Compare the potential and actual effects of government
intervention on the free flow of trade
Copyright © 2015 Pearson Education Ltd.
*
Learning Objective : To describe the potential and actual effects
of governmental intervention on the free flow of trade.
6-*
Protecting ‘Infant Industries’The infant industry argument
government protection of import competition is necessary to
help certain industries evolve from high-cost to low-cost
productionUsed by developing countries
Copyright © 2015 Pearson Education Ltd.
*
According to the infant industry argument, production becomes
more competitive over time because of increased economies of
scale and greater work efficiency. Therefore, if an emerging
industry is protected during its infancy it has a greater chance
for success.
Many developing countries use this argument as a rationale for
implementing protectionist policies.
Keep in mind though that production costs may never fall far
enough to make an industry competitive making it important to
clearly identify those industries with the greatest chance for
success. Even then, because of the costs involved,
protectionism may not be automatic.
6-*
Developing an Industrial BaseCountries promote
industrialization because itbrings faster growth than
agriculturebrings in investment fundsdiversifies the
economycreates growth in manufactured goodsreduces imports
and promotes exportshelps the nation-building process
Copyright © 2015 Pearson Education Ltd.
*
Generally, countries with higher per capita GDP have larger
manufacturing bases. So, countries that are trying to develop
an industrial base may intervene in trade flows. The United
States for example, has restricted imports to grow its
manufacturing base.
6-*
Economic Relationships
With Other CountriesTrade controls can be usedto improve the
balance of paymentsto gain fair access to foreign
marketscomparable access argumentas a bargaining
toolbelievability and importanceto control
pricesdumpingoptimum-tariff theory
Copyright © 2015 Pearson Education Ltd.
*
Countries can use trade controls to improve their relationships
with other countries. In addition to using trade restrictions to
improve the nation’s balance of payments, governments may
also intervene in trade to ensure that domestic producers have
the same access to other markets as foreign companies have to
their markets, to encourage countries to change their policies,
and to control prices.
Keep in mind that governments have to be careful when using
trade restrictions to control prices. If prices get too high, it
could result in smuggling or substitution. Similarly, if prices
get too low, there’s an incentive to produce less or to shift
foreign production and sales.
Trade restrictions can be used to prevent a practice known as
dumping which involves exporting below cost or below home
country prices, and to get foreign producers to lower their
prices. According to the optimum tariff theory, a foreign
producer will lower its prices if the importing company places a
tax on its products.
6-*
Noneconomic Rationales for Government
InterventionNoneconomic rationales includeMaintaining
essential industriesPromoting acceptable practices
abroadMaintaining or extending spheres of influencePreserving
national culture
Copyright © 2015 Pearson Education Ltd.
*
Sometimes governments may intervene in trade for political
reasons including maintaining essential industries, promoting
acceptable practices abroad, maintaining or extending spheres
of influence, or preserving national culture.
6-*
Maintaining Essential IndustriesThe essential industry
argumentprotect essential industries so the country is not
dependent on foreign supplies during warCountries
mustdetermine which industries are essentialconsider costs and
alternativesconsider political consequences
Copyright © 2015 Pearson Education Ltd.
*
The essential industry argument of protecting certain industries
to avoid dependency on foreign supplies can be appealing, but
keep in mind that in theory almost any product could be deemed
essential.
6-*
Promoting Acceptable
Practices AbroadImport trade controls can be usedto promote
changes in foreign countries’ political policies or capabilitiesas
a foreign policy weaponto pressure governments to alter their
stances on a variety of issues human rightsenvironmental
protection
Copyright © 2015 Pearson Education Ltd.
*
Governments can use trade policy to encourage or discourage
certain types of behavior by other countries.
6-*
Maintaining or Extending Spheres of InfluenceGovernments
provide assistance and encourage imports from countries that
join a political alliance or vote a preferred way within
international bodiesCotonou AgreementA country’s trade
restrictions may coerce governments to follow certain political
actions or punish companies whose governments do not
Copyright © 2015 Pearson Education Ltd.
*
Trade restrictions can also be used to support a country’s sphere
of influence.
6-*
Preserving National CultureIn order to preserve national
culture, countrieslimit foreign products and services in certain
sectorsCanada’s cultural sovereigntyprohibit exports of art and
historical items deemed important to national heritage
Copyright © 2015 Pearson Education Ltd.
*
Sustaining the collective identity that sets their citizens apart
from those in other nations, is another reason why countries
intervene in trade flows. Rice imports were strictly limited for
years in Japan for example, because rice farming was
considered to be a historically cohesive force in the country.
6-*
Instruments of Trade Control
Learning Objective:
Illustrate the major means by which trade is restricted and
regulated
Copyright © 2015 Pearson Education Ltd.
*
Learning Objective : To illustrate the major means by which
trade is restricted and regulated.
6-*
Instruments of Trade ControlTwo types of trade controlsthose
that indirectly affect the amount traded by directly influencing
prices of exports or importsthose that directly limit the amount
of a good that can be traded
Copyright © 2015 Pearson Education Ltd.
*
There are many different ways to intervene in trade flows. It’s
important to choose the right instrument to achieve a particular
objective.
6-*
TariffsTariffs are also known as dutiesrefer to a government
levied tax on goods shipped internationallyTariffs may be
levied on goods entering, leaving, or passing through a country
for protection or revenueon a per unit basis or a value
basisexport tariffstransit tariffsimport tariffs
Copyright © 2015 Pearson Education Ltd.
*
Tariffs directly influence prices, while nontariff barriers affect
either price or quantity. When a country assesses a tariff on a
per unit basis it’s applying a specific duty. A tariff that’s
assessed as a percentage of the item’s value is an ad valorem
tariff. A compound duty is due when both a specific and an ad
valorem tariff are assessed.
6-*
Nontariff Barriers:
Direct Price Influencers Subsidies direct assistance to
companies to make them more competitiveagricultural subsidies
overcoming market imperfectionsvaluation problems
Copyright © 2015 Pearson Education Ltd.
*
Nontariff barriers can affect either quantity sold or price.
Subsidies are one of the most common ways to influence price.
6-*
Nontariff Barriers:
Direct Price Influencers Aid and loanstied untiedCustoms
valuationOther direct-price influences special fees and
requirements
Copyright © 2015 Pearson Education Ltd.
*
In addition to subsidies which help companies be more
competitive, other policies that affect price include aid and
loans to help companies win contracts, arbitrary customs
valuations, and other special fees and requirements that
ultimately result in higher priced goods.
6-*
Nontariff Barriers:
Quantity ControlsQuotaslimit the quantity of a product that can
be imported or exported in a given time frame Voluntary export
restraint (VER)Embargoes
Copyright © 2015 Pearson Education Ltd.
*
The most common type of nontariff barriers that directly
influence the quantity of imports are quotas which limit the
quantity of a product that can be exported or imported.
Voluntary export restraints and embargoes that prohibit all trade
are types of quotas.
6-*
Nontariff Barriers:
Quantity Controls“Buy local” legislationStandards and
labelsSpecific permission requirementsimport or export license
Administrative delaysReciprocal requirementsCountertrade or
offsetsRestrictions on services
Copyright © 2015 Pearson Education Ltd.
*
Other nontariff barriers affecting quantity include “buy local”
legislation, special standards and labels, specific permission
requirements, administrative delays, and reciprocal
requirements.
Keep in mind that trade restrictions affect services as well as
manufactured and agricultural products. Countries deciding
whether to restrict trade in services consider essentiality, not-
for-profit-preference, standards, and immigration.
6-*
Dealing with Governmental Trade Influencers
Learning Objective:
Demonstrate the business uncertainties and business
opportunities created by governmental trade policies
Copyright © 2015 Pearson Education Ltd.
*
Learning Objective : To demonstrate the business uncertainties
and business opportunities created by governmental trade
policies.
6-*
Dealing with Governmental Trade InfluencersCompanies facing
import competition canMove abroadSeek other market
nichesCreate greater efficiency or superior products Try to get
governmental protection
Copyright © 2015 Pearson Education Ltd.
*
Companies facing losses because of import competition have
several options.
6-*
Tactics For Dealing
With Import CompetitionConvince decision makers of the
merits of particular policiesInvolve the industry and
stakeholdersPrepare for changes in the competitive environment
Copyright © 2015 Pearson Education Ltd.
*
The tactics for dealing with import competition vary according
to industry and business. It’s not always possible, for example,
to simply shift production to another location or find new
suppliers.
The development of an international strategy can help determine
whether a company will benefit more from protectionist
measures or from some other method of countering foreign
competition.
6-*
Dynamics and ComplexityTrade restriction changes bring about
winners and losers among countries, companies, and
workersGains to consumers from freer trade may come at the
expense of companies and workers The international regulatory
situation is becoming more complex
Copyright © 2015 Pearson Education Ltd.
*
Looking forward, there is likely to be both support for freer
trade, and also support for more protectionism.
6-*
All rights reserved. No part of this publication may be
reproduced, stored in a retrieval system, or transmitted, in any
form or by any means, electronic, mechanical, photocopying,
recording, or otherwise, without the prior written permission of
the publisher. Printed in the United States of America.
Copyright © 2015 Pearson Education Ltd.
*
COUNTRY A
Political policies and legal
practices
Cultural values, attitudes,
and beliefs
Economic forces
Geographic influences
TRADE ENHANCEMENTS
TRADE RESTRICTIONS
COMPANIES’
COMPETITIVE
ENVIRONMENT
•
•
•
•
COUNTRY B
Political policies and legal
practices
Cultural values, attitudes,
and beliefs
Economic forces
Geographic influences
•
•
•
•
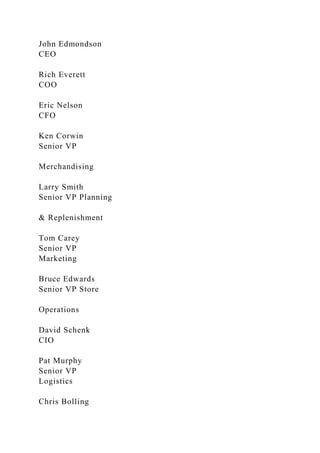
GLOBAL SUPPLY MANAGEMENT FORUM
CASE: GS-34
DATE: 9/27/04 (REV’D. 04/07/05)
Lyn Denend prepared this case under the supervision of
Professor Hau Lee as the basis for class discussion rather than
to
illustrate either effective or ineffective handling of an
administrative situation.
Copyright © 2004 by the Board of Trustees of the Leland
Stanford Junior University. All rights reserved. To order
copies or
request permission to reproduce materials, e-mail the Case
Writing Office at: [email protected] or write: Case Writing
Office, Stanford Graduate School of Business, 518 Memorial
Way, Stanford University, Stanford, CA 94305-5015. No part
of
this publication may be reproduced, stored in a retrieval system,
used in a spreadsheet, or transmitted in any form or by any
means –– electronic, mechanical, photocopying, recording, or
otherwise –– without the permission of the Stanford Graduate
School of Business.
WEST MARINE:
DRIVING GROWTH THROUGH SHIPSHAPE
SUPPLY CHAIN MANAGEMENT
Our goal is to be the best billion dollar boating company every
day.
—John Edmondson, Chief Executive Officer, West Marine
The whole company has culturally undergone a huge shift in
terms of recognizing the value of
supply chain management to the success of the organization and
our ability to grow.
—Pat Murphy, Senior Vice President of Logistics, West Marine
It was the evening of January 13, 2003 at West Marine’s
Watsonville, California headquarters.
In the morning, CEO John Edmondson would announce to West
Marine’s shareholders, the
press, the boating community, and the employees of the two
rival companies that West Marine
was acquiring BoatU.S.’s retail stores, Internet/catalog
business, and wholesale operations.
Although the negotiations had gone on for months, only a small
handful of individuals within
West Marine had been involved. BoatU.S.’s founder and CEO
had insisted on secrecy, and had
changed his mind about the sale more than once during the
negotiation process. The two
companies had been fierce competitors for years. Edmondson,
and his counterpart at BoatU.S.,
knew the announcement would come as a shock to the loyal
employees and customers of both
organizations.
In the spring of 1996, West Marine had acquired another one of
its major competitors: E&B
Marine. While the mechanics of the acquisition had gone
relatively smoothly, the company
quickly discovered that its infrastructure was not strong enough
to support an organization that
had almost doubled in size overnight. West Marine’s supply
chain was especially hard hit, with
its systems and processes proving inadequate to keep all 72
West Marine and 63 E&B Marine
stores amply stocked. The results had been disastrous. Peak
season out-of-stock levels climbed
to more than 12 percent and, correspondingly, sales dropped by
almost 8 percent within the first
year following the transaction.
For the exclusive use of A. Bregante, 2018.
This document is authorized for use only by Anthony Bregante
in SCM 800 Fall 2018 Aggon taught by NORMAN AGGON,
The Pennsylvania State University from Aug 2018 to Jan 2019.
West Marine: Driving Growth Through Shipshape Supply
Chain Management GS-34
p. 2
Edmondson was brought in after the E&B Marine acquisition to
execute a company turnaround.
For more than four and a half years, he had been focused on
rebuilding West Marine. The
company installed a new senior management team, invested in
new systems and processes
throughout the organization, and initiated a major cultural
change. Edmondson and his team
were proud of West Marine’s recent achievements⎯ particularly
in the supply chain arena. Yet,
on the eve of the company’s latest acquisition, he wondered
whether they had done enough to
effectively support another 62 BoatU.S. stores without
experiencing the negative repercussions
of the E&B Marine acquisition.
Edmondson took a deep breath⎯ savoring the “calm before the
storm.” West Marine’s course
had been set. Now he only needed to launch the journey and
hope for smooth sailing.
SETTING SAIL: COMPANY BACKGROUND
Anchors Aweigh
Randy Repass founded West Marine in 1968. Repass worked
briefly as a computer engineer in
Silicon Valley, but found the high technology industry to be
rather cold and impersonal. An avid
boater, he sought refuge in his hobby and began selling nylon
rope by mail order out of his
garage. Driven by a desire to improve the way people shopped
for boating supplies (and his
personal dissatisfaction with service at his local boating store),
Repass next opened a small
boating outlet in Palo Alto, California in 1975. The store sold
rope, as well as other
miscellaneous boating supplies and accessories. Most
importantly, it was dedicated to providing
knowledgeable, friendly customer service to the boating
community⎯ a company of boaters
helping fellow boaters.
As the organization’s customer base grew, so did its business
model. Repass began acquiring
and opening boating supply stores along the West Coast. He
also gradually expanded the
company’s product line to include anchor and dock equipment,
boat hardware, maintenance and
safety products, electronics, boating apparel, water sports
equipment, fishing supplies, and more
(see Exhibit 1 for illustrative store and product photos). In
1978, West Marine founded its port
supply business and began selling products to boat yards, boat
dealers, and other wholesale
customers. By 1987, the company had 15 stores. That same
year, West Marine began producing
its first catalog. In 1991, the company opened its first stores on
the East Coast. In 1993, West
Marine went public under the Nasdaq symbol WMAR (see
Exhibit 2 for a more complete
timeline of company milestones).
Making Headway in 2002
By late 2002, West Marine had become the largest boating
supply retail chain in the nation, with
operations in the U.S., Canada, and Puerto Rico, approximately
5,000 peak season employees,
and annual sales of approximately $530 million. In total, West
Marine offered more than 50,000
products through its stores, Web site, and catalog, including an
extensive collection of private-
label goods.
For the exclusive use of A. Bregante, 2018.
This document is authorized for use only by Anthony Bregante
in SCM 800 Fall 2018 Aggon taught by NORMAN AGGON,
The Pennsylvania State University from Aug 2018 to Jan 2019.
West Marine: Driving Growth Through Shipshape Supply
Chain Management GS-34
p. 3
Channels
The company had more than 250 stores, with retail operation
accounting for approximately 82
percent of its business. West Marine had three primary types of
stores. Most standard stores
averaged 8,000 square feet, carried 8,000 to 10,000 stock
keeping units (SKUs), and generated
roughly $1.5 million in sales per year. The company also had a
growing number of express
stores that averaged 2,800 square feet, carried 2,500 SKUs, and
generated $600,000 to $800,000
in annual sales. In its continued pursuit of growth, West Marine
had recently begun
experimenting with a third store format⎯ the megastore. These
outlets were located in large
markets (like Fort Lauderdale), ranged from 24,000 to 30,000
square feet, carried 30,000 SKUs,
and were expected to generate $10 to $15 million per year.
Megastores were intended to be
“destination stores,” featuring interactive displays, boater
education, and an unparalleled in-
house selection.
The remaining 18 percent of West Marine’s business was
generated via Internet and catalog
orders, as well as sales to commercial customers. West
Marine’s catalog was more than 1,000
pages, making it the most extensive in the industry. It offered
retail and wholesale customers
access to 35,000 of the company’s SKUs, featured full color
photographs of the most popular
products, and reached more than 1 million boaters a year. The
company’s online store included
all 50,000 SKUs, but mirrored the catalog to provide customers
with a consistent experience
across channels. Similarly, West Marine operated a call center
that provided real-time customer
support for catalog, Web, and in-store interactions. Like West
Marine’s associates in the stores,
call center representatives were known for having a depth of
specialized boating experience and
a strong commitment to customer satisfaction.
Because they received a high level of service and a similar
buying experience regardless of the
channel, West Marine’s customers tended to shop freely
between the stores, the Internet, and the
catalog. For example, some customers relied on the stores for
last minute purchases and to
acquire products they wanted to “touch and feel.” However,
they would use the Web or catalog
to research, compare, and buy products when they had more
lead-time, or to take advantage of
special offers. “Our most profitable customers shop in all three
channels,” explained Tony
Gasparich, VP of direct sales. “We broke down the barriers
between catalog, Internet, and our
stores so that our customers can shop wherever, and whenever
it’s most convenient for them.” 1
Customers
West Marine had a strong base of both wholesale and retail
customers. The port supply (or
wholesale) division accounted for approximately 9 percent of
the company’s sales. Typical
wholesale customers included boat yards, boat dealers, and even
some small-scale competitors
(e.g., “mom and pop” marine supply stores). In total, West
Marine had 33,000 wholesale
customers who shopped at its stores (using a wholesale signer’s
card) or ordered via catalog and
Web. A team of 40 direct sales people and 10 inside sales
representatives also served the
company’s larger wholesale accounts, advising them on the best
products for their needs and
nurturing these relationships. “We try to help them do their
jobs better,” explained Chris
Bolling, West Marine’s VP of port supply.
1 All quotations attributed to representatives from West Marine
were collected by the author via personal interviews, unless
otherwise noted.
For the exclusive use of A. Bregante, 2018.
This document is authorized for use only by Anthony Bregante
in SCM 800 Fall 2018 Aggon taught by NORMAN AGGON,
The Pennsylvania State University from Aug 2018 to Jan 2019.
West Marine: Driving Growth Through Shipshape Supply
Chain Management GS-34
p. 4
On the retail side, West Marine’s customers fell into three
primary categories: sailors (30
percent), large power boaters (40 percent), and trailer boaters
(30 percent). The average West
Marine customer tended to be male, college educated, 39 to 55
years old, married with children,
and in the top 10 percent of wage earners in the U.S. The
company amassed considerable
knowledge about its customers through the implementation of
loyalty programs that offered
discounts to shoppers (among other benefits) in exchange for
their membership information.
Loyalty program members accounted for more than 70 percent
of all West Marine sales. As
Tom Carey, the company’s senior VP of marketing put it, “This
level of participation is off-the-
charts for most retailers. It gives us a huge advantage in
looking at what our customers are
doing, understanding what they think, and modeling their
purchasing behaviors.”
West Marine also used this customer data, along with boat
ownership and geographic
information, to customize its marketing efforts. Rather than
blanketing the nation with a single
one-size-fits-all version of a promotional mailing, the company
created different versions of its
fliers for warm and cold weather climates, and for each of its
primary customer segments (for a
total of six targeted mailings for each promotion). The
promotional fliers were created
approximately twice per month, and had a circulation eight
times greater than the largest
independent boating publication. As a result, West Marine’s
vendors were eager to be
spotlighted within the mailers, and would frequently pay the
company to be included, as though
they were buying ad space in a magazine.
Industry Position
In 2002, the boating supply market accounted for approximately
$6 billion of the total $25.6
billion boating industry.2 While general industry performance
was relatively strong, RBC
Capital Market estimated that the boating supply sector was
declining three to five percent per
year.3 At the time, there were more than 5,000 retailers in the
boating aftermarket. However,
West Marine was one of only three major national boating
supply companies.4 West Marine,
BoatU.S., and Boater’s World controlled just 10 percent of the
total market, with local,
independent retailers accounting for the remainder of total
sales.5 Like the rest of the industry,
West Marine’s stores were concentrated in the three primary
U.S. boating markets⎯ the West
Coast, the Northeast, and the Southeast. Despite its West Coast
roots, 68 percent of the
company’s business was located in the two major eastern
regions where industry growth rates
were slightly better and higher population densities enabled the
company to achieve greater
operational efficiencies6 (see Exhibit 3 for highlights from a
2002 analyst report).
The boating aftermarket was considered a specialty retail
market. Outside of its immediate peer
group, West Marine benchmarked itself against companies like
Brookstone, Cost Plus,
Autozone, and other high performing, small cap retailers.
While West Marine performed
competitively against these companies, it had lower sales per
square foot and fewer inventory
turns than many other specialty retailers.7 This was due, in
part, to the extreme seasonality of
West Marine’s business. Over 60 percent of the company’s
total sales typically occurred
2 Carole Buyers, “West Marine Inc.: The Clear Leader in a
Fragmented Industry,” RBC Capital Markets, October 15, 2002,
p. 3.
3 Ibid.
4 Ibid, p. 5.
5 Ibid.
6 Ibid., p. 8.
7 Ibid., p. 9.
For the exclusive use of A. Bregante, 2018.
This document is authorized for use only by Anthony Bregante
in SCM 800 Fall 2018 Aggon taught by NORMAN AGGON,
The Pennsylvania State University from Aug 2018 to Jan 2019.
West Marine: Driving Growth Through Shipshape Supply
Chain Management GS-34
p. 5
between the months of April and September, with stores in most
areas remaining largely
unproductive during the winter season. In addition, West
Marine’s service philosophy
contributed to these challenges. The company’s goal of having
“what the customer needs, when
the customer needs it” meant that the average West Marine store
carried a significant portion of
products with relatively low sales velocities. In fact, the
company estimated that 20 percent of
its in-store items accounted for roughly 80 percent of its sales.
The rationale for this approach
was that boaters had to be able to stop by a West Marine store
on their way to their boats and be
able to find whatever they needed to spend the day on the water.
If the stores did not have the
right products on hand, then their customers would potentially
lose a day of boating (not to
mention their faith in West Marine’s ability to act as a one-
stop-shop for all of their boating
needs). Fortunately, RBC Capital Markets estimated that the
relatively low investment cost of a
West Marine store and its high contribution margin helped
offset its lower inventory turns
relative to other specialty retailers.8
While West Marine had led a trend toward consolidation in the
retail boating supply industry, the
industry’s manufacturers and dealers remained highly
fragmented. Many suppliers were small
organizations with insufficient capital and infrastructure to
support growing, organized retailers
such as West Marine. West Marine’s market research indicated
that, among other factors, supply
chain failures and the corresponding declines in consumer
satisfaction were causing boaters to
leave the sport, as well as deterring new entrants.
Into Rough Waters⎯ The E&B Marine Acquisition
Prior to its acquisition by West Marine, E&B Marine’s 63 retail
stores and its small catalog
operation provided another source of competition to the
company. With approximately $100 M
in annual sales, E&B was one of West Marine’s oldest
competitors. However, while the two
companies had a healthy rivalry, their core customer bases were
different. In 1996, West Marine
was focused first and foremost on the sailing community. E&B
Marine, on the other hand,
catered to a power boating clientele that was more price
sensitive and value driven than a typical
West Marine customer. West Marine was attracted to E&B as
an acquisition target because it
would enable the company to rapidly increase its penetration of
the powerboat segment. In
addition, because E&B had recently fallen on hard financial
times, the seller was highly
motivated to strike a deal. In June 1996, the acquisition
occurred.
Following the transaction, West Marine discovered that internal
E&B operations were in worse
condition than expected. The investment group that had been
running E&B had let the
company’s infrastructure deteriorate and inventories dwindle.
The West Marine team had a
project plan with thousands of action items for executing the
acquisition and addressing some of
these challenges. Yet even the basic systems integration
between the two organizations took six
months to complete. Gasparich recalled, “We got mired down
in the minutia and lost track of
some of the core strategic issues.”
As Bruce Edwards, West Marine’s senior VP of store operations
put it, “We also went into the
E&B acquisition fairly naïve about the impact of a 63-store
chain being assumed by a 72-store
operation.” Pressures behind the scenes within the newly
combined organization led to stock-
8 Ibid.
For the exclusive use of A. Bregante, 2018.
This document is authorized for use only by Anthony Bregante
in SCM 800 Fall 2018 Aggon taught by NORMAN AGGON,
The Pennsylvania State University from Aug 2018 to Jan 2019.
West Marine: Driving Growth Through Shipshape Supply
Chain Management GS-34
p. 6
outs in the stores. West Marine and E&B customers were
frustrated by not being able to find
what they needed, when they needed it. To make matters worse,
West Marine impulsively began
to pull down E&B’s signs and started converting their stores to
the West Marine brand,
assortment, and pricing. Edmondson (who was not CEO at the
time) reflected that, “West
Marine bought E&B because it was different and unique. Then,
they turned all the stores into
West Marine stores and locked out the customer base.”
Edwards added, “We created a lot of
damage to both chains,” as well as losing ground on comparable
sales as a combined
organization.
West Marine’s management team was also beginning to falter
under the stress of such rapid
growth. Repass had always boasted that, at West Marine, team
members were “boaters first and
business men second.”9 Unfortunately, this meant that some
members of the senior management
team increasingly lacked the experience needed to diagnose and
correct the company’s core
problems. Rich Everett, the company’s COO recalled, “We’d
try different things, they wouldn’t
work, so we’d go down a different road. Internally, it was
chaos.”
By 1998, West Marine’s challenges started to show from the
outside. Earnings dropped to six
cents per share⎯ off 80 cents from the decade’s high in 1997.
Further, after at least six years of
steady growth, net income dropped from $15.2 million in 1997
to $1.1 million in 1998.10
According to the analysts, “It became apparent that West
Marine had over-expanded.”11
BATTENING DOWN THE HATCHES: THE WEST MARINE
TURNAROUND
Before the end of that year, West Marine’s board of directors
(led by Repass, the board’s
chairman) persuaded retail industry veteran Edmondson to join
the company as its new CEO.
His immediate charge was to generate cash quickly. However,
the board also expected him to
put the company back on an even footing. To accomplish this,
Edmondson focused on four
specific areas: (1) leadership, (2) strategy, (3) people and
culture, and (4) systems and processes.
Leadership⎯ The Captain Selects His Crew
Edmondson recognized immediately that he needed more
experience in his management team.
West Marine’s boaters in businessmen’s roles had done a
worthy job of bringing the company to
the $500 million mark. Yet, to resolve the company’s
challenges and become a $1 billion
business, Edmondson wanted people who had “been there, done
that” in larger, more complex
retail organizations. Everett recalled, “John changed out almost
all the key players in areas
where the business was failing” (see Exhibit 4 for a high level
view of West Marine’s executive
organization).
Ken Corwin was brought in to lead the merchandising team. Pat
Murphy came in to manage
logistics and distribution. David Schenk took on information
systems. Larry Smith filled a new
position focused on supply chain planning and replenishment.
All of these executives had deep
experience in their respective areas, working in multibillion
dollar companies. For example, Pat
Murphy joined West Marine from Borders Books where he
managed five distributions centers,
9 See West Marine’s Web site at www.westmarine.com under
the Company History section.
10 Mike de Give, “West Marine Products Charts a Steady
Course,” Santa Cruz Sentinel, July 18, 2001.
11 Buyers, op. cit., p. 6.
For the exclusive use of A. Bregante, 2018.
This document is authorized for use only by Anthony Bregante
in SCM 800 Fall 2018 Aggon taught by NORMAN AGGON,
The Pennsylvania State University from Aug 2018 to Jan 2019.
West Marine: Driving Growth Through Shipshape Supply
Chain Management GS-34
p. 7
each twice as big as West Marine’s largest DC. Among other
positions, Larry Smith formerly
headed the supply chain planning team for Kmart’s $8 billion
apparel business (see Exhibit 5 for
selected West Marine team biographies).
Strategy⎯ New Navigation Rules
Upon joining West Marine, each executive was given the
general mandate to turn around his
respective function. However, to keep individual actions
aligned across the organization,
Edmondson enlisted the team’s assistance in defining a new
company strategy. Through an
extensive, collaborative planning process, the leadership team
developed a five-year plan (which
would be updated on an annual basis). The strategic plan
started with West Marine’s vision of
being the best boating products company every day. It then
outlined a series of specific financial
goals (company-wide performance indicators), that included
ROE, cash flow, comp sales, EPS,
product service levels, market share, customer satisfaction, and
associate satisfaction. Next, the
plan outlined six critical success factors that would enable West
Marine to achieve its desired
financial results and realize its vision (see Exhibit 6 for
excerpts from West Marine’s strategic
plan). Finally, it went on to detail the specific strengths and
weaknesses of the organization, and
the select initiatives upon which the company would focus in
the coming year.
As a result of the strategic planning process, every leader at
West Marine understood the
company’s direction and the role he was expected to play in
helping the organization realize its
goals. Edmondson left it up to the individual leaders to define
the specific tactics that would
rapidly deliver the required results in their areas. Then, formal
reports were put into place (with
metrics that cascaded from the enterprise-level performance
indicators) to regularly measure the
company’s progress and hold every manager accountable for his
actions.
People and Culture⎯ All Aboard
Edmondson also expected his new management team to help
drive a cultural change within West
Marine. The company was founded on the idea of providing
“better-than-expected customer
service.” Yet, as the company began to falter, employees
started to interpret this as permission
to take care of the customer at any cost. Edmondson recalled,
“I remember one example where
we spent $1,800 to rush a $200 part to a wholesale customer in
Hawaii. The good thing was that
we continued to take care of our customers despite our internal
challenges. The bad part was that
there were no rules. Everybody was running amok.” Another
issue that created problems within
the organization was a growing sense of protectionism and
secrecy within and across
departments. The more the company struggled, the less willing
its teams were to share
information about their issues, challenges, and needs across
organizational boundaries.
The leadership team addressed these problems head-on. Outside
experts in cultural change were
brought in to more appropriately direct the passion and energy
of the organization. Significant
effort was also invested in redefining roles and refocusing
employees on their jobs so that, as
Edmondson put it, “people would play their positions and work
together to more efficiently solve
problems.” They also made it clear, to new and old employees
alike, that “silo” mentalities
within traditional vertical functions would no longer be
tolerated. Lines of communication were
opened through the initiation of cross-departmental meetings
and project teams. The
For the exclusive use of A. Bregante, 2018.
This document is authorized for use only by Anthony Bregante
in SCM 800 Fall 2018 Aggon taught by NORMAN AGGON,
The Pennsylvania State University from Aug 2018 to Jan 2019.
West Marine: Driving Growth Through Shipshape Supply
Chain Management GS-34
p. 8
organization also achieved increased visibility by holding
functional areas mutually accountable
for meeting shared metrics.
Systems and Processes⎯ Regaining an Even Keel
Repairing West Marine’s foundation to support its recent (and
continued) growth was one of the
most important turnaround initiatives facing the new leadership
team. Corwin recalled that when
he joined West Marine “it was a disorganized, crisis-managed
environment. The company had
grown so fast, its britches were about to pop. We didn’t have
the systems in place, we didn’t
have the structure, and we didn’t have the discipline.” To
address these problems, Edmondson
said, “We began attacking every process. We literally reviewed
tens of thousands of processes
and reinvented all of our systems to figure out how we could
take ongoing SG&A out of the
business at the same time that we started operating more
effectively.”
CHARTING A NEW COURSE: SUPPLY CHAIN
COLLABORATION
Process and system changes would occur throughout the
organization, but particular emphasis
was placed on transforming the company’s supply chain
management practices.12 “Our supply
chain was complex, difficult, and broken,” Edmondson
remembered, “So I saw major cost
opportunities. But, there were also significant opportunities for
improvements in sales and
customer service.” Even though instock rates reached an all-
time low following the E&B
Marine acquisition, the company remained passionate about
having on hand whatever products
its customers needed. Corwin, Smith, Murphy, and Schenk
would have to work together to
completely recreate the company’s systems and processes in this
area. All four executives were
up for the challenge, and they were committed to transforming
West Marine’s supply chain from
a liability into a competitive advantage.
Fighting the Current⎯ West Marine’s Supply Chain Challenges
Even before the E&B Marine acquisition, West Marine’s supply
chain was more complex than
the supply chains of most specialty retailers. The company had
an enormous number of SKUs to
manage. It also had extraordinarily complicated inventory
requirements that were necessitated
by the seasonal nature of its business⎯ every spring West
Marine expanded the amount of
inventory in its stores and DCs by 20 to 30 percent to prepare
for peak season. Given the wide
variety of products offered by West Marine, the company also
had almost 1,000 vendors to
manage in 2003. Each vendor differed in the number and types
of products it supplied, its level
of sophistication, the capabilities of its supporting
infrastructure, and its responsiveness to West
Marine’s needs. Some were mom-and-pop suppliers that
struggled to keep up with West
Marine’s orders. Others were marine divisions within large
organizations (like 3M Marine) that
recognized West Marine’s importance as a customer, but faced
product delays and other barriers
because of cross-divisional management challenges (these
divisions were often smaller off-
shoots of a company’s main business and were, accordingly,
treated like “second-class”
departments within their own organizations). To complicate the
supply chain further, West
12 The term supply chain refers to the trading partners and
processes involved in acquiring materials, producing goods, and
distributing them into the marketplace to satisfy customer
demand. The goal of supply chain management is to get all
parties
involved in the supply chain – including retailers, wholesalers,
distributors, transporters, and manufacturers – working together
to get the right products, distributed in the right quantities, to
the right locations, at the right time.
For the exclusive use of A. Bregante, 2018.
This document is authorized for use only by Anthony Bregante
in SCM 800 Fall 2018 Aggon taught by NORMAN AGGON,
The Pennsylvania State University from Aug 2018 to Jan 2019.
West Marine: Driving Growth Through Shipshape Supply
Chain Management GS-34
p. 9
Marine’s promotions came into play, with advertising decisions
having a tremendous impact on
the volume and timing of products needed in the stores.
At the Home Office
Prior to the turnaround, all supply chain planning and
replenishment activities were disconnected
and poorly coordinated within the merchandising team.
Forecasts were created, but they were
widely considered to be inaccurate, inconsistently shared with
suppliers, and rarely used for
significant planning purposes. Replenishment processes were
somewhat rudimentary and
allowed for a disproportionate number of exceptions from the
stores (which many considered to
be “cowboy” behavior rather than sound supply chain input). In
addition, representatives from
merchandising infrequently considered the supply chain
implications of their actions when they
agreed to special deal-buys with vendors. Instead, the effects of
these decisions were typically
felt after the fact, when rush purchase orders were requested or
products unexpectedly arrived at
the DCs and had to be received, managed, and reconciled with
in-process replenishment
activities.
Two-way communication and collaboration with suppliers was
also substandard. In the absence
of other information, vendors tended to operate on a purchase-
order-to-purchase-order basis. For
example, suppliers would be given advance notice when West
Marine intended to add one of
their products to its assortments, yet they frequently did not
know what quantity would be
required until a purchase order was delivered. As a result, West
Marine was plagued by late
shipments, which negatively impacted instock rates in the
stores. Even more importantly, late
shipments frequently interfered with the availability of products
featured in key promotions.
Both problems contributed to lost sales and decreased customer
satisfaction.
West Marine struggled further with a rash of partial shipments
from vendors. Every purchase
order that was filled in two or three deliveries required two or
three times the manpower to
process, receive, and redistribute to the stores. Partial
shipments were a key contributor to West
Marine’s supply chain costs, which had spiraled out of control.
Few individuals within the
organization understood the inefficiencies that were driving
these cost increases, and the West
Marine team was stuck in the mode of fighting supply chain
fires, not solving their underlying
problems.
The E&B Marine acquisition further compounded central supply
chain challenges by adding
more stores, new SKUs, and different assortments that had to be
managed. The combined
vendor population reached 1,400 at its peak, and communication
with legacy E&B Marine
suppliers was no more productive than it was at West Marine.
From a systems perspective, West
Marine had relatively advanced supply chain management
software in place. However, as
Everett put it, “We had the Ferrari of supply chain management
software, but we only had people
who knew how to drive Ford trucks. They took everything
down to the lowest common
denominator and tried to make it work.” Data integrity between
the DCs and the stores was also
a major problem because they utilized two separate back-end
databases that were not effectively
interfaced. Even after the E&B Marine systems and data had
been integrated with West
Marine’s, it was nearly impossible to get an accurate, end-to-
end understanding of supply chain
performance from the enabling information systems.
For the exclusive use of A. Bregante, 2018.
This document is authorized for use only by Anthony Bregante
in SCM 800 Fall 2018 Aggon taught by NORMAN AGGON,
The Pennsylvania State University from Aug 2018 to Jan 2019.
West Marine: Driving Growth Through Shipshape Supply
Chain Management GS-34
p. 10
In the Distribution Centers
In the mid 1990s, West Marine was outgrowing its 70,000
square foot DC in Charlotte, North
Carolina. Accordingly, the company decided to invest in a new
500,000 square foot facility in
Rock Hill, South Carolina (which would take several years to
build). While there were multiple
delays in construction, the facility was nearing completion just
as West Marine entered into the
E&B Marine acquisition. The company shifted operations from
Charlotte to Rock Hill,
anticipating a relatively smooth transition since many of the
employees from Charlotte agreed to
commute to Rock Hill (which was just 15 miles away from the
original facility). However, the
transition from a small, mostly manual operation to a warehouse
that was more than seven times
as large and highly automated (e.g., with an advanced network
of conveyors) proved to have
many unanticipated challenges. Employees needed different
skill sets, more experience, and
more extensive training.
Within the same timeframe, sales in the stores were surging.
Orders for products were placed at
full speed and vendors made high volumes of shipments in
return. In Rock Hill, deliveries
quickly began to back up on the receiving docks. The DC team
could not receive and process
them fast enough in the new facility to keep up with the
inbound freight. Cartons and containers
piled up. Merchandise was misplaced. Outbound shipments to
stores were delayed, which
further compounded instock problems. As Edwards recalled,
“Our supply chain was crippled.
Out-of-stocks in the stores reached upward of 25 percent for
most of peak season.”
Within the first year following the E&B Marine acquisition,
West Marine had always intended to
close the rather poorly run E&B warehouse in Edison, New
Jersey to help reduce overall
logistics costs. However, the timing for the closure could not
have been worse. Rock Hill, with
its vast capacity, was expected to absorb the inbound and
outbound traffic from Edison (which
meant that its volume nearly doubled). Despite the bottlenecks,
it made little sense from a time
or cost perspective to involve West Marine’s only other DC in
resolving the problems since it
was located on the West Coast. Operations in Rock Hill were
forced to stumble forward.
In response to its mounting problems, the Rock Hill team
started working harder and longer each
day. “At one point, there was a 10-hour rule,” explained
Murphy who inherited this problem
upon joining West Marine. “Our employees could go home for
10 hours to sleep and eat, then we
needed them back on the job.” The shipping dock operated 24
hours a day in an effort to get
needed products to the stores. Warehouse costs mushroomed,
and employee turnover
skyrocketed. Murphy estimated, “In 1999, we probably hired
1,200 people over the course of
the year to keep 280 peak season jobs filled.” Something had to
change.
A Port in the Storm⎯ Supply Chain Improvements
Given the extent of its supply chain challenges, West Marine
recognized that it needed long-
term, holistic solutions that would require a significant
investment of time and resources. The
leadership team put a halt to all store expansion to relieve some
of the immediate pressure on the
supply chain, and to enable the management team to focus all of
its energy on identifying and
fixing its underlying supply chain problems. Critical
importance was placed on improving end-
to-end supply chain visibility and effectiveness, driving down
related costs, and improving the
level of supply chain collaboration within and outside West
Marine. Through increased
collaboration, the company hoped to transition out of its
reactionary mode of fighting perpetual
For the exclusive use of A. Bregante, 2018.
This document is authorized for use only by Anthony Bregante
in SCM 800 Fall 2018 Aggon taught by NORMAN AGGON,
The Pennsylvania State University from Aug 2018 to Jan 2019.
West Marine: Driving Growth Through Shipshape Supply
Chain Management GS-34
p. 11
supply chain related fires, and begin to more proactively
anticipate and prevent issues from
arising.
Smith, who was active in a number of industry associations and
supply chain organizations, had
recently begun hearing about a process called collaborative
planning, forecasting, and
replenishment. Recognizing that many of West Marine’s
problems were related to inadequate,
ineffective, or isolated planning, forecasting, and replenishment
activities, he started to
investigate the approach on the company’s behalf.
Defining CPFR®
Thought leaders in supply chain management had long
recognized the fact that companies
frequently struggled to keep their internal constituencies
aligned in effectively managing the
flow of materials or goods into, through, and out of the
enterprise. Yet, there was also a growing
consensus that coordinating the supply chain within the
boundaries of a single organization was
not enough. Companies had to partner with extended networks
of manufacturers, suppliers,
distributors, and/or retailers to optimize performance all the
way from the time a customer placed
an order through the time that order was fulfilled.
Wal-Mart was one of the first pioneers to embrace the
counterintuitive notion of sharing
proprietary supply chain related data outside the boundaries of
its internal organization when it
launched a co-managed inventory pilot with Warner-Lambert in
1995. When the company
realized some success from its initial efforts, Wal-Mart asked
the Voluntary Interindustry
Commerce Standards (VICS) association to study and develop a
forward-looking process to
promote more productive supply chain management throughout
the retail industry.13 The new
process, published in 1998, was called collaborative planning,
forecasting, and replenishment
(CPFR®).
CPFR® formally combined and capitalized on the intelligence
of multiple trading partners in the
planning and fulfillment of customer demand.14 At the heart of
CPFR® was the development of
a single, shared forecast that supported the joint plans of
trading partners in the supply chain and
drove their mutual replenishment activities. It also provided a
framework within which
exceptions could be systematically identified and addressed.
Clear performance measures were
defined to document operational performance expectations.
Risk was monetized so that partners
faced clear financial consequences when agreements were not
met. Incentives were used to
motivate collaborative, cooperative behavior and to share the
benefits as waste was eliminated
from the supply chain and desired results were achieved (see
Exhibit 7 for the complete VICS
process model).
Much of the value of CPFR® resulted from the exchange of
more timely, complete, and realistic
forecast data, which led to higher forecasting accuracy rather
than more sophisticated forecasting
algorithms.15 CPFR® also linked best practices for sales and
marketing (like category
13 RetailSystemsAlert Group, “A History of CPFR,”
http://www.retailsystems.com/IndustryEvents/Index.cfm?PageN
ame=CPFROHistory (May 5, 2004).
14 Voluntary Interindustry Commerce Standards Association,
“CPFR: An Overview,” May 18, 2004, http://www.cpfr.org
(July
12, 2004).
15 Voluntary Interindustry Commerce Standards Association,
“CPFR Voluntary Guidelines: Nine Step Process Model,” June
2002, http://www.cpfr.org (May 5, 2004).
For the exclusive use of A. Bregante, 2018.
This document is authorized for use only by Anthony Bregante
in SCM 800 Fall 2018 Aggon taught by NORMAN AGGON,
The Pennsylvania State University from Aug 2018 to Jan 2019.
West Marine: Driving Growth Through Shipshape Supply
Chain Management GS-34
p. 12
management) to supply chain operations to improve instock
availability, reduce inventory, and
decrease logistics and transportation costs16. It also helped
eliminate constraints that had
traditionally limited supply chain efficiency. For example:
Most sellers hold finished goods inventory in sufficient
quantities to meet
customer demand. Manufacturing capacity is not used because
buyers’ normally
short order-cycle times are inconsistent with longer
manufacturing cycle times.
By extending the buyer order cycle and thus making it
consistent with the
manufacturing cycle, production could move to a “make-to-
demand” process for
some products. This removes the need to hold a significant
amount of finished
good inventory in the value chain and improves customer
service, which produces
dramatic benefits.17
Despite the promise of potentially dramatic results, the
widespread adoption of CPFR® had been
gradual, with companies in the consumer packaged good
industry acting as the primary
pathfinders. In the late 1990s, some organizations were still
hesitant to initiate CPFR®
programs because they suspected that the potential benefits had
been exaggerated. Others had
recently reengineered their supply chains and felt uncertain
whether enough additional waste
could be eliminated to justify the investment in CPFR®. Still
others chose to allocate their
limited funds and resources to other e-business initiatives.18
Preparing for CPFR® at West Marine
From his initial interview with the company, Smith was
encouraged by the willingness among
the West Marine management team to believe that
replenishment forecasting could be accurate
enough to help drive the company’s core business decisions and
processes. If West Marine
could achieve a more holistic view of all inventory activity
within the company, and
collaboratively share the benefits of this information with its
supply chain partners, it could
realize significant benefits. Convinced that CPFR® would help
the company repair its supply
chain and achieve these desired results, the West Marine
management team committed itself to
implementing the approach.
While CPFR® defined at a high level how trading partners
should work together to plan,
forecast, and manage replenishment, it did not dictate who
fundamentally owned the process.
Instead, different options enabled companies to make this
determination based on the
competencies, resources, and systems of the involved parties.19
Importantly, the retailer and the
manufacturer would both have input into all stages of the
process. However, a single entity
would ultimately take ownership for their execution. Option A
was considered conventional
order management, with the retailer driving the forecast, order
planning, and order generation.
Option B, called supplier-managed inventory, put the retailer in
charge of the forecast, but the
manufacturer in charge of order planning and buying. In Option
C, co-managed inventory, the
retailer developed the forecasts and planned the orders, but the
manufacturer generated the
16 Voluntary Interindustry Commerce Standards Association,
“CPFR: An Overview,” op. cit.
17 Voluntary Interindustry Commerce Standards Association,
“CPFR Voluntary Guidelines: Nine Step Process Model,” op.
cit.
18 Tom Harwick, “Collaborative Planning, Forecasting, and
Replenishment Will Take Off in Next Two Years,” Forrester
Research, June 7, 2001,
http://www.forrester.com/Research/LegacyIT/0,7208,24863,00.h
tml (May 5, 2004).
19 Voluntary Interindustry Commerce Standards Association,
“CPFR Voluntary Guidelines: Nine Step Process Model ,” op.
cit.
For the exclusive use of A. Bregante, 2018.
This document is authorized for use only by Anthony Bregante
in SCM 800 Fall 2018 Aggon taught by NORMAN AGGON,
The Pennsylvania State University from Aug 2018 to Jan 2019.
West Marine: Driving Growth Through Shipshape Supply
Chain Management GS-34
p. 13
orders. Finally, in Option D, the manufacturer was responsible
for all three activities as in
vendor-managed inventory programs (see Exhibit 7 for an
overview of these four role options).
“The key reason for West Marine to focus on the retailer-driven
approach,” explained Smith, “is
that the buyer usually drives the key events that crack the
‘bullwhip’ in the supply chain (for
example, promotions and assortment changes). The buyer-
driven forecast also depends on only
one technological platform, so it is scalable across many items
and suppliers with similarly
accurate results.” Accordingly, the company decided that it
would support Option A, where the
retailer (or buyer) acts as the supply chain hub.
However, before West Marine could begin creating more
accurate forecasts that could be shared
with suppliers as part of its new CPFR® initiative, the company
had some important information
systems changes to make. At the heart of West Marine’s supply
chain systems was JDA’s
Merchandise Management System (MMS)⎯ a robust platform
that the company could build
upon. The MMS was interfaced with the company’s point-of-
sale system in the stores (also
provided by JDA) to keep track of basic inventory levels and
product sales at the store level.
West Marine also used JDA’s Warehouse Management System
(WMS) as the software engine
for its distribution center (DC) operations.
West Marine also had advanced replenishment and forecasting
tools: JDA’s Advanced Store
Replenishment (ASR) and Advanced Warehouse Replenishment
(AWR). The problem was that
both systems required intensive and duplicative maintenance
and management to work well. The
two systems were totally disconnected⎯ none of the work in one
system could be directly
leveraged by the other. Store replenishment planning focused
on historical customer sales.
Warehouse replenishment planning focused on historical
distribution center shipments, which
had no reference to current store forecasts, overstocks,
understocks, assortment changes, store-
DC servicing changes, or new store additions.
If replenishment management and maintenance could be
integrated and then limited to the key
drivers of customer sales, replenishment associates could invest
more time and effort in working
with suppliers to improve on-time and accurate delivery of
goods, and spend less time and effort
executing work-arounds necessitated by suboptimal West
Marine systems. The key drivers to
customer sales forecasts were base annual forecasts, seasonal
selling curves or “profiles,”
ranking or service levels for items by importance to the
business, promotions, and assortment
changes. In West Marine’s business model, sales from
nonstocking locations were also a
significant driver. Items that could be obtained for a customer
from a stocking DC, but not
carried in a store, accounted for approximately 10 percent of all
store sales. In fact, in certain
product categories, nonstocking sales actually accounted for the
majority of item sales.
While many companies, particularly in the retail sector, wanted
and needed multi-echelon
solutions that linked and aggregated store and warehouse
forecasting and replenishment, few had
effectively achieved them. At the time, no leading software
vendors offered such a solution out-
of-the-box. JDA was working on a solution, and Smith
discussed codevelopment options with
the software provider. However, in the end, West Marine
elected to develop a custom
integration solution to link its store and DC level replenishment
platforms. The challenge was
left to Smith, Schenk, and their respective teams to develop the
in-house solution, although their
For the exclusive use of A. Bregante, 2018.
This document is authorized for use only by Anthony Bregante
in SCM 800 Fall 2018 Aggon taught by NORMAN AGGON,
The Pennsylvania State University from Aug 2018 to Jan 2019.
West Marine: Driving Growth Through Shipshape Supply
Chain Management GS-34
p. 14
efforts were aided by the efforts of a San Francisco-based
system engineer and integrator, Matt
Henderson of Amigo, Inc. Ultimately, West Marine
implemented a successful, robust linkage
between the point-of-sale and DC systems that maximized
automation and mass-maintenance
procedures, and gave West Marine one of the first true multi-
echelon replenishment solutions in
the retail sector.
In accomplishing its multi-echelon solution, West Marine
created new user interfaces that
enhanced the user’s view of how products performed across the
network. The company
addressed the challenge of accomplishing accurate seasonal
profiling by implementing JDA’s
Intellect seasonal profiling package. West Marine also installed
JDA’s Advanced Planning
package, populating it with all its replenishment forecasting
information. This provided flexible
perspectives on how key business elements performed, while
constituting what Smith called an
“automatic” open-to-buy policy, because replenishment
forecasts determine future inventory
requirements (see Exhibit 8 for a visual overview of all West
Marine supply chain related
information systems).
Electronic data interchange (EDI) was another important aspect
of West Marine’s supply chain
infrastructure improvements. The purpose of EDI was to
standardize the electronic transfer of
structured information between trading partners to increase
productivity, reduce human error,
and drive down costs. Documents like purchase orders,
invoices, and shipment notifications
were exchanged in a systematic manner that improved advanced
visibility and promoted better
communication between companies. West Marine implemented
EDI using an SPS Commerce
solution. The company then worked with the National Marine
Manufacturers Association
(NMMA) to establish this as the EDI standard in the marine
industry with the hope of more
rapidly stimulating its adoption. Next, West Marine went out to
its suppliers and directly
requested that they begin using EDI. As more and more
suppliers came online, West Marine
primarily benefited from the increased visibility to its inbound
inventory liability and supplier
shipping performance through the EDI advance shipment
notices, which provided the company
discrete shipment information from the time shipments left
suppliers’ shipping docks.
Concurrent with these systems changes, West Marine launched a
significant data clean-up effort.
Evaluating one SKU at a time, West Marine employees
eliminated discrepancies in shipping
multiples, case pack quantities, and other critical data fields
that would reduce internal errors and
minimize supply chain inefficiencies. For example, a legacy
store level replenishment setting
might have triggered the need for “four” paint brushes to be
sent to that store (with the store
expecting to receive four individual units). However, if the DC
level setting for the ship multiple
did not match, the DC might instead send out four cases of paint
brushes⎯ significantly more
inventory than the store could hold or use. The planning and
replenishment team and the
logistics team also worked together to create new business rules
that dictated who could modify
specific data fields (and under what conditions) to help avoid
future discrepancies and
unanticipated changes.
With its new tools, West Marine was able to begin creating
accurate 52-week forecasts of
supplier orders for all of its products with a minimum of manual
intervention. Historical sales
data was used to generate the baseline forecast, which was then
systematically made richer by
taking into account seasonal (geographic based) profiles,
product rank (based on anticipated
For the exclusive use of A. Bregante, 2018.
This document is authorized for use only by Anthony Bregante
in SCM 800 Fall 2018 Aggon taught by NORMAN AGGON,
The Pennsylvania State University from Aug 2018 to Jan 2019.
West Marine: Driving Growth Through Shipshape Supply
Chain Management GS-34
p. 15
sales volume and gross margin), and scheduled promotions
(fliers, special displays in the stores,
and other promotional activities). These forecasts were updated
every 24-hours, based on the
previous day’s sales so that the company always had an up-to-
date forecast of what needed to be
ordered. According to Schenk, “A lot of retail CIOs are taught
to do a store level inventory
replenishment forecast once a week and feel good about it. We
do it daily. Every day.
Timeliness is a significant component of accuracy. That’s why
we have such confidence in our
forecasts.”
To support this new forecasting and replenishment approach,
West Marine also had to get its
own employees working together more effectively. In the home
office, Corwin and Smith
agreed to implement a category management approach that
would drive employees in the
merchandising and planning and replenishment departments to
perform as an integrated unit.
They divided all of West Marine’s products into 24 distinct
product clusters (e.g., electronics,
maintenance, deck hardware) and assigned a category manager
and an assistant category
manager from the merchandising group to each one. In
addition, a merchandise planner and a
replenishment analyst were assigned from the planning and
replenishment department. These
four individuals were colocated in a team “pod” (an open, team-
oriented workspace) and were
charged with working together. Importantly, no staff additions
were authorized to support the
new structure⎯ all positions were filled by reorganizing existing
headcount as redundant
activities were eliminated and low-value activities were
automated via the new supply chain
systems.
The category manager and his/her assistant were responsible for
choosing the items that the
company would stock, assigning a channel (or multiple
channels) to each product, negotiating
vendor agreements, determining price, margin, and volume
goals, developing promotion
strategies, and managing the ongoing vendor relationships. The
merchandise planner acted as
the “supply chain captain,” cutting purchase orders, monitoring
shipments and fill rates,
resolving problems, and coordinating all aspects of the supply
chain from the vendor to the DC.
The replenishment analyst worked closely with the merchandise
planner, but focused on those
aspects of the supply chain related to getting product from the
DC to the stores. Specifically,
s/he entered and monitored the forecasts, interfaced with the
stores to ensure that they got what
products they needed (when they needed them), and managed
special requests from the stores.
The new category teams also worked closely with assortment
planning (part of the planning and
replenishment department), visual merchandising, and
marketing. The assortment planning
group helped ensure that each unique store had the right mix of
products to maximize sales and
profitability in its market. The visual merchandising team
designed the planograms (which
assigned a physical location to every SKU in the store) for each
store’s unique assortment. The
marketing team provided customer and market data to these
groups, and also coordinated the
physical promotions that were agreed to by the category teams.
From a supply chain
perspective, every promotion had to be included in the forecast
no less than 90 days in advance
so that the appropriate products (in the appropriate volumes)
could be ordered, shipped, received,
and incorporated into the physical store design according to the
planogram (see Exhibit 9 for a
simplified view of how category management, merchandise
planning, replenishment analysis,
assortment planning, visual merchandising, and marketing all
worked together).
For the exclusive use of A. Bregante, 2018.
This document is authorized for use only by Anthony Bregante
in SCM 800 Fall 2018 Aggon taught by NORMAN AGGON,
The Pennsylvania State University from Aug 2018 to Jan 2019.
West Marine: Driving Growth Through Shipshape Supply
Chain Management GS-34
p. 16
The West Marine CPFR® Pilot
Once West Marine had implemented the structural, process, and
information system changes
necessary to make significant internal supply chain
improvements, the company was ready to
begin collaborating more directly with its suppliers. West
Marine’s goal was to more proactively
consult with its vendors on shared forecasts and other supply
chain issues to further improve
fulfillment and sales. To get started, West Marine hand-picked
a group of 12 suppliers to be part
of its initial pilot. These suppliers tended to be large vendors
that were struggling with supply
chain issues of some sort (e.g., late or incomplete shipments).
The category management teams
met with the vendors one-on-one to introduce the CPFR®
approach and make plans for its
adoption. These sessions were characterized by honest, fairly
blunt discussion about West
Marine’s desire to have the best supply chain in its class.
Specific goals and expected
performance levels were clearly spelled out. Vendors were
asked directly to commit to these
goals, although the company chose not to require formal,
written agreements.
No specific investments in technology were required from the
vendors, but West Marine did
expect them to designate resources within their organizations to
act as the counterparts to West
Marine’s supply chain captains (the merchandise planners). For
some suppliers, this investment
was considered minimal to keep a sizable customer like West
Marine satisfied. For others, it
represented a potential financial hardship. Most suppliers were
willing to participate. For those
who resisted or declined, West Marine made no secret of the
fact that it might re-evaluate its
relationship with the company following the more widespread
implementation of its CPFR®
program.
With this groundwork laid, West Marine began sharing its
forecasts with vendors in the pilot
group on a weekly basis. Vendors were also provided with
weekly updates on their performance
relative to West Marine’s CPFR® goals (see Exhibit 10 for
examples of these communications).
Cross-functional status meetings were held monthly to review
progress and discuss potential
improvements. The entire category team participated in these
meetings, along with their
respective counterparts from the vendor organization, to
maintain a holistic, integrated
perspective on each vendor relationship. Between these
scheduled meetings, supply chain
exceptions and performance issues were directly addressed on
an as-needed basis.
West Marine’s CPFR® pilot quickly built momentum through
the introduction of quarterly
Supply Chain Summits⎯ three-day working sessions in which
the company could get as many as
28 vendors up to speed and into the CPFR® program at a time.
By the end of 2002, the
company was actively collaborating with its top 150 vendors,
and it also had more than 350 EDI
partners (representing 90 percent of the company’s supplier
spend). Through the more open
exchange of information, standardized processes, and improved
systems, West Marine began to
realize select significant results (see Exhibit 11 for illustrative
vendor success stories). In terms
of the key performance metrics for the CPFR® program, instock
rates at the stores came close to
the goal of 96 percent in every store, even during peak season.
Forecast accuracy climbed to
approximately 85 percent. On-time shipments, on the other
hand, were improving but only
reached 30 percent against a stated goal of 90 percent in 2002.
However, West Marine expected
them to climb to at least 50 percent by the end of 2003.
For the exclusive use of A. Bregante, 2018.
This document is authorized for use only by Anthony Bregante
in SCM 800 Fall 2018 Aggon taught by NORMAN AGGON,
The Pennsylvania State University from Aug 2018 to Jan 2019.
West Marine: Driving Growth Through Shipshape Supply
Chain Management GS-34
p. 17
Buoyed by its progress, West Marine implemented a “no hassle”
guarantee to its suppliers. To
show the seriousness of its commitment to its forecasts, the
company promised to purchase 100
percent of its forecasts every time. While this placed the
burden of any mistakes squarely on
West Marine’s shoulders, it went a long way toward convincing
vendors to trust in the
company’s forecasts.
The implementation, however, was not without its challenges.
West Marine continually had to
“sell” the value of CPFR® to its suppliers, and some remained
unconvinced. Certain vendors
did not believe that benefits warranted the investment of time,
money, and resources. Others felt
West Marine, as the country’s largest boating supply company,
was “throwing its weight
around,” and that its expectations of its vendors were
unrealistic. At times, suppliers became
preoccupied with the metrics and challenged the accuracy of
West Marine’s performance reports.
Distractions like these caused West Marine and its suppliers to
spend more time arguing about
measurements than focusing on performance improvements or
other, more constructive
behaviors. However, many vendors were enthusiastic about the
changes, which increased their
ability to more regularly communicate and collaborate with
West Marine. In fact, as word began
to spread among its suppliers, more companies specifically
asked to be included.
In the home office, initial employee reactions to West Marine’s
CPFR® program were mixed.
While some individuals resented the more restrictive processes
and the more rule-based
environment, others believed in the changes and were energized
by the results the company was
starting to realize. Regardless of their personal feelings, all of
West Marine’s employees agreed
that the supply chain worked significantly better than it had
following the E&B Marine
acquisition. More people, at all levels of the organization,
understood the end-to-end process
and the impact of their actions on supply chain effectiveness.
In addition, there was a much
higher level of cooperation and collaboration within West
Marine⎯ even among those who had
not yet bought-in to the value of CPFR®.
Other Supply Chain Improvements in West Marine’s DCs
In the DCs, West Marine started to use the improved forecasts
to plan shipping and receiving
activities and use its dock space more productively. For
example, if the forecast called for 150
truckloads of antifreeze to support the company’s winterizing
campaign, the DC team would
know to coordinate with the planning and replenishment
department to make sure all 150
truckloads of product did not arrive at the DC at one time.
Working together, these teams used
the forecasts to smooth demand spikes and schedule/sequence
inbound and outbound shipments
to maximize the efficiency of its internal supply chain
operations. Coordination based upon
forecasting also allowed Murphy and his distribution managers
to proactively plan and manage
the labor requirements for each season to create an optimal
balance among seasonal hiring,
overtime, and year-round staffing alternatives.
To institutionalize more collaborative supply chain interactions,
the planning and replenishment
department and the DCs established weekly meetings. As
Murphy put it, “The marriage of
replenishment and physical logistics and distribution cannot
ever be separated. They have to
work in total concert. Otherwise, you’re going to have serious
trouble.” In these sessions, the
two groups agreed on a tactical, 30-day view of the forecast and
used it to optimize near-term
supply chain planning and execution. The merchandise planners
brought insights from the
For the exclusive use of A. Bregante, 2018.
This document is authorized for use only by Anthony Bregante
in SCM 800 Fall 2018 Aggon taught by NORMAN AGGON,
The Pennsylvania State University from Aug 2018 to Jan 2019.
West Marine: Driving Growth Through Shipshape Supply
Chain Management GS-34
p. 18
vendors to these discussions, and the DC team offered a reality
check from the warehouse floor.
The focus was on troubleshooting, problem resolution, and the
elimination of unanticipated
changes and supply chain delays.
In addition to working more closely with the planning and
replenishment group, the distribution
team implemented a series of major process improvements.
West Marine leveraged its new IS
capabilities to convert all of its DCs to radio frequency (RF)
item and parcel identification. West
Marine also used JDA’s WMS to support differentiation of
shipping methods and multiples by
location. Further, the company began more fully using its
Cubiscan system. Cubiscan was a
computer used on the receiving dock to measure the cubic
displacement of every item, case, or
other unit received (e.g., its physical dimensions, weight, and
other data). With this information,
the DC teams could more efficiently manage storage space
within the warehouse by optimizing
the capacity of every aisle. It also enabled them to more
effectively plan pick lists and fill
cartons. By knowing exactly how much space each item would
require in a carton, West Marine
saved money by filling its cartons to 85 percent capacity and, in
turn, making fewer shipments to
move the same volume of product. Since outbound shipping
represented the vast majority of
most DC labor and operating cost, the focus on standard (and
inner) pack utilization reaped
significant benefits, including a 3x improvement in the use of
standard carton distribution to
West Marine’s stores.
Murphy also used the Cubiscan data as input toward the creation
of engineered operating
standards for the warehouses. Working with an outside
consultant, the DC teams completed
three-dimensional studies of the warehouse facilities to
determine the time and distance
requirements of every job in the DCs. Using this data,
management could define the optimal
sequence and anticipated time required to shelve any
combination of products, complete any pick
lists, prepare cartons for shipping, and execute other common
operating procedures. This meant
that for every standard process in the warehouses, there was a
benchmark against which the
efficiency and effectiveness of West Marine’s employees was
measured.
To drive additional logistics efficiencies through transportation,
West Marine took control of its
inbound freight and directly managed close to 85 percent of all
inbound shipments by 2003.
Rather than relying on vendors to independently arrange for the
delivery of products to the DCs,
West Marine instructed them to call the company to arrange for
a pick-up. West Marine
committed to executing the pick-ups within 48 hours of being
notified, which was good for the
vendor. There were also many benefits to West Marine,
including significantly lower freight
rates. The company was also able to coordinate pick-ups to
maximize truck capacity and reduce
traffic at the DCs (e.g., one truck arrived with 25 pallets from a
variety of different vendors
rather than 25 trucks showing up at the DC carrying one pallet
each). Finally, directly managing
its inbound freight gave West Marine additional, advanced
visibility into upstream supply chain
activities “rather than just hoping that everything shows up
where it’s supposed to be,” according
to Murphy. “The sooner you take ownership of the physical
product and the physical movement
of that product, the more likely you’re going to achieve your
goals.”
At the same time as executing these performance improvements,
West Marine invested
significant time and energy in training its DC employees.
Because the company had been
operating in a crisis management mode for several years, the
training of hourly and management
For the exclusive use of A. Bregante, 2018.
This document is authorized for use only by Anthony Bregante
in SCM 800 Fall 2018 Aggon taught by NORMAN AGGON,
The Pennsylvania State University from Aug 2018 to Jan 2019.
West Marine: Driving Growth Through Shipshape Supply
Chain Management GS-34
p. 19
associates had fallen by the wayside. However, with the latest
round of changes in the DCs,
West Marine wanted to be sure that all staff members
understood how things worked, and why
they worked that way, so that they could make independent
decisions that positively (rather than
negatively) impacted the efficiency and effectiveness of the
supply chain. Employees took on
increased responsibility for achieving desired results and,
through the company’s training
program, they acquired the knowledge and tools they needed to
be successful.
TESTING WEST MARINE’S SEAWORTHINESS: THE
BOATU.S. ACQUISITION
On a Slightly Different Course
BoatU.S. (Boat Owners Association of the United States) began
as a boater’s advocacy group in
1966. Over the years, BoatU.S. grew to more than 500,000
members. Its primary member
services included marine insurance, boat financing, marina
discounts, towing, government
representation and lobbying, consumer advocacy, boating news
(through BoatU.S. Magazine)
and programs to improve environmental responsibility and
safety within the boating industry.
The group also expanded its services to include a boating
equipment division that had 62 stores,
Internet/catalog operations, and a small wholesale business by
2003.
Initially, BoatU.S. stores were located primarily on the east
coast, while West Marine was
concentrated in the West. As founder Richard Schwartz put it
in an article for his magazine,
“Our two organizations watched each other grow⎯ first with
interest from distant coasts and then
in the same market areas as our stores moved closer
together.”20 As both chains sought to
expand, and as consolidation started to occur within the
industry (e.g., the E&B Marine
acquisition), a rivalry emerged between the two companies.
While BoatU.S. tended to serve more trailer boat customers than
West Marine, there was
significant overlap within their customer bases. Regardless of
this common ground, BoatU.S.
and its customers considered themselves unique. According to
Schwartz, “BoatU.S. was quite
different. We were a membership association formed not only
to save boaters money on
equipment and supplies, but to give them a voice on legislation,
government regulations, safety,
and consumer issues.”21 This difference affected both
companies’ perceptions of one another
and fueled competition between the two chains.
Despite its best efforts, BoatU.S. could not keep up with West
Marine’s expansion. The
organization quietly entered acquisition talks with West Marine.
Schwartz was originally
interested in selling the entire BoatU.S. organization to West
Marine, but West Marine
determined that it was only potentially interested in its
equipment business (the retail stores,
catalog/Internet, and wholesale operations, excluding the
BoatU.S. headquarters staff). Eric
Nelson, West Marine’s CFO explained, “We were prudent
enough to recognize we were
retailers. Many companies get so cocky that they think they can
do anything.” Eventually, the
BoatU.S. team warmed to this approach, stating that it would
allow the association to refocus its
efforts on its core mission⎯ providing members with boating
related services. However, due to
the intensity of the rivalry between the companies and his own
mixed emotions about the sale,
20 Richard Schwartz, “Behind the Buoy,” BoatU.S. Magazine,
March 2003.
21 Ibid.
For the exclusive use of A. Bregante, 2018.
This document is authorized for use only by Anthony Bregante
in SCM 800 Fall 2018 Aggon taught by NORMAN AGGON,
The Pennsylvania State University from Aug 2018 to Jan 2019.
West Marine: Driving Growth Through Shipshape Supply
Chain Management GS-34
p. 20
Schwartz insisted that all negotiations had to be kept secret
until the day the transaction was
executed.
Planning the Overhaul⎯ High Pain, Short Duration
BoatU.S.’s requirements for secrecy made planning for the
acquisition extremely challenging for
West Marine. According to Edmondson, “Up until one or two
weeks before the acquisition,
there probably weren’t 15 people in our organization who knew
it was coming.” Edmondson
went only to select members of his executive team and asked
them how much time and money
they would need to execute the acquisition. “He said if it’s too
expensive or too complex, we’re
not going to do it,” remembered Schenk. From a financial
perspective, West Marine’s results
were just beginning to improve and the company couldn’t afford
a high-cost acquisition. From a
customer perspective, it had successfully repaired much of the
damage caused by the E&B
Marine transaction, but it could not sustain another slow,
painful integration.
Those issues aside, the West Marine management team was
ready to start growing again. As
Nelson put it, “We had invested millions of dollars in
infrastructure, getting good people,
supporting them, giving them time to get their operations in
order. Finance was fixed. IS was
fixed. Logistics and the supply chain were fixed. We had
become lean and we were getting
good numbers. We were anxious to do something.”
With peak season rapidly approaching, Edmondson decided that
if West Marine was going to
move forward with the acquisition, it needed to integrate the
two companies within 60 days.
“When I told him it might take four to six months to get the
systems fully integrated, he told me
that was the ‘wrong answer,’” recalled Schenk. Edmondson’s
direction was clear: (1) integrate
and begin operating as one business within 60 days, (2) ensure
minimal disruption to peak season
sales, (3) make the acquisition profitable in the first year.
From a supply chain perspective, the acquisition would be
challenging. BoatU.S. had
approximately the same number of stores as E&B Marine. Yet
the integration would be more
complicated due to the inclusion of its robust Internet/catalog
operations and growing wholesale
business. BoatU.S. had its own catalog with a sizable
circulation, an extensive Internet store,
and a call center in Florida. The company also had a significant
loyalty program and marketing
flier programs to take into account. From a wholesale
perspective, BoatU.S.’s port supply
division was less mature and had not clearly defined its
customer base (so that numerous retail
customers qualified for unwarranted wholesale discounts). To
complicate matters further,
because West Marine elected not to acquire the BoatU.S. home
office staff, the company would
have limited assistance from legacy BoatU.S. employees in
terms of providing information,
continuity, and other forms of assistance related to supply chain
planning, forecasting, and
replenishment.
Both BoatU.S. and West Marine offered 50,000 SKUs via their
stores, Internet sites, and
catalogs. Yet, only 10,000 SKUs matched between the two
organizations. Similarly, both
companies had approximately 750 suppliers, with only 100 in
common. West Marine and
BoatU.S. were both using EDI, but BoatU.S. transacted with a
much smaller percentage of its
vendors this way (roughly 30 percent). BoatU.S. did not
provide regular forecasts to its
suppliers, nor did it participate in any other CPFR® activities.
The two companies received
For the exclusive use of A. Bregante, 2018.
This document is authorized for use only by Anthony Bregante
in SCM 800 Fall 2018 Aggon taught by NORMAN AGGON,
The Pennsylvania State University from Aug 2018 to Jan 2019.
West Marine: Driving Growth Through Shipshape Supply
Chain Management GS-34
p. 21
different pricing from suppliers and, in turn, offered different
pricing to customers on the same
and/or similar products. BoatU.S.’s product assortments were
less well-defined, with popular,
new products and high-volume/high-margin items missing from
certain stores. Clearly, a vendor
and SKU rationalization effort would be needed but, if West
Marine decided to maintain the
BoatU.S. brand, the company would need to purposefully
develop a more diverse product base
and more unique assortments than ever before.
In terms of its distribution capabilities, BoatU.S. operated one
DC in Hagerstown, Maryland.
While this warehouse utilized technology that was not available
at the time of the E&B Marine
acquisition (e.g., bar coding and radio-frequency tracking), the
building itself was not conducive
to efficient logistics operations and the company’s warehouse
processes had not been optimized.
BoatU.S.’s warehouse management systems were comparable
(in terms of functionality and
comprehensiveness) to what West Marine was using, but they
were not directly compatible.
Similarly, the two companies had compatible hardware in its
stores, but operated on different
point-of-sale software systems. The stores drove the majority
of replenishment activities via
mostly manual processes.
One additional challenge related directly to West Marine’s
suppliers. While supplier
performance had improved dramatically through West Marine’s
CPFR® efforts, it still fell short
of the company’s expectations. While West Marine now felt
confident of its own supply chain
processes, systems and controls, it could not yet fully depend on
its suppliers to keep their
promises. Some suppliers had risen to the occasion and were
performing at a consistent and
reliable level. Others, however, were still unpredictable,
disengaged, or unconcerned with West
Marine’s assessment of their performance. Ultimately, West
Marine’s management team had to
determine if its confidence in its own internal supply chain
operations was strong enough to
offset the remaining weakness in its vendor community.
FULL SPEED AHEAD
To achieve the company’s objectives for the BoatU.S.
acquisition, the West Marine management
team had prepared a plan to overcome and manage the many
obstacles and risks that might
prevent it from quickly getting the newly combined organization
on an even keel. The team was
certain that West Marine was better prepared for this acquisition
than it had been for the E&B
Marine transaction. However, each member wondered what new
“soft spots” might be
discovered as the company again ramped up its growth engine
on its way to becoming a $1
billion business.
For the exclusive use of A. Bregante, 2018.
This document is authorized for use only by Anthony Bregante
in SCM 800 Fall 2018 Aggon taught by NORMAN AGGON,
The Pennsylvania State University from Aug 2018 to Jan 2019.
West Marine: Driving Growth Through Shipshape Supply
Chain Management GS-34
p. 22
Exhibit 1
Illustrative Store and Product Photos
Source: Photographs provided by West Marine.
For the exclusive use of A. Bregante, 2018.
This document is authorized for use only by Anthony Bregante
in SCM 800 Fall 2018 Aggon taught by NORMAN AGGON,
The Pennsylvania State University from Aug 2018 to Jan 2019.
West Marine: Driving Growth Through Shipshape Supply
Chain Management GS-34
p. 23
Exhibit 2
Timeline of Company Milestones (through 2002)
Yr
#
Stores
Sales
(000,000) EPS Major Milestones
1968
Randy Repass, founder and chairman of the Board of Directors,
began selling rope
by mail-order out of his garage under the name West Coast
Ropes. The only
product offered is a 3-strand nylon rope.
1975 1 The first West Coast Ropes store opened in Palo Alto,
California.
1977 2
The Company acquired Boston-based West Products, a well
known mail-order
business, and changed its name from West Coast Ropes to West
Marine Products.
The second store opened in Oakland, California.
1980 3 Store three opened in Sausalito, California.
1983 8 Acquired five-store Newport Supply chain in Southern
California. Opened South San Francisco store.
1986 13 $31.8 The Company acquired three-store Cal Marine
chain in the Pacific Northwest.
1988 16 $56.3
The Company introduced its first Master Catalog, 330 black-
and-white pages
packed with boating gear.
The first West Marine Pacific Cup race from San Francisco to
Hawaii took place.
1991 19 $74.8 West Marine opened its first stores on the East
Coast in Miami and Annapolis. More stores followed in Florida,
Virginia, New York, Connecticut, Rhode Island
and Massachusetts.
1993 37 $122.8 The Company went public under the symbol
WMAR on the Nasdaq exchange. The Initial Public Offering
was for 1,800,000 @ $14.00/share.
1995 72 $224.2 $0.61 Follow-on offering of 1,380,000 shares
made @ $24.75/share.
1996 151 $323.3 $0.68 Opened Hollister Distribution center in
California.
West Marine merged with one of its oldest and most respected
competitors, E&B
Marine. After the completion of the merger, West Marine had
150 stores across the
U.S.
1998 212 $449.3 $0.06 Opened Rock Hill distribution center in
South Carolina.
John Edmondson joined West Marine as President and Chief
Executive Officer.
1999 227 $486.5 $0.50 Ken Corwin joined West Marine as
senior vice president of merchandising.
Pat Murphy joined West Marine as senior vice president of
logistics.
Larry Smith joined West Marine as senior vice president of
planning &
replenishment.
2000 233 $508.4 $0.42 David Schenk joined West Marine in
October of 2000 as vice president and CIO.
2001 240 $512.9 $0.77 West Marine exceeded 1,000,000 in
West Advantage customer loyalty members.
More than 98% of inventory replenishment now automated.
2002 257 $530.6 $0.97 Opened two new stores in Canada and
two new West Marine Express stores.
Source: Information provided under “Investor
Information/Timeline” at www.westmarine.com.
For the exclusive use of A. Bregante, 2018.
This document is authorized for use only by Anthony Bregante
in SCM 800 Fall 2018 Aggon taught by NORMAN AGGON,
The Pennsylvania State University from Aug 2018 to Jan 2019.
West Marine: Driving Growth Through Shipshape Supply
Chain Management GS-34
p. 24
Exhibit 3
Highlights from 2002 Analyst Report
West Marine’s Historical Performance
1993 1994 1995 1996 1997 1998 1999 2000 2001
Stores 37 54 72 151 184 212 227 233 240
Store
Growth
37% 45.9% 33.3% 109.7% 21.9% 15.2% 7.1% 2.6% 3.0%
Sales
(000,000)
$123 $170 $224 $328 $421 $545 $492 $508 $513
Sales
Growth
26.5% 38.4% 31.9% 46.2% 28.3% 8.0% 8.3% 3.3% 0.9%
EPS $0.34 $0.45 $0.61 $0.79 $0.86 $0.14 $0.50 $0.50 $0.77
EPS
Growth
13.3% 32.4% 35.6% 29.5% 9.6% -83.5% 252.1% 0.0% 54.2%
West Marine’s 2002 Market Position Relative to Top
Competitors
West Marine BoatU.S. Boater’s World
Sales (000,000) $440 $120 $80
Market Share* 7.3% 2.0% 1.3%
Total Stores 252 63 100
* Based on an estimate that the total boating market is
approximately $6 billion in size.
West Marine’s Store Location Mix Relative to Industry
Percent of Retail Sales West Coast Northeast Southeast
West Marine 32% 37% 31%
Industry** 40% 33% 27%
**Estimated by RBC Capital Markets using data from NMMA
1999 U.S. Recreational Boat Registration statistics.
Source: Compiled from an RBC Capital Markets report titled
“West Marine Inc: The Clear Leader in a Fragmented
Market” (October 15, 2002).
For the exclusive use of A. Bregante, 2018.
This document is authorized for use only by Anthony Bregante
in SCM 800 Fall 2018 Aggon taught by NORMAN AGGON,
The Pennsylvania State University from Aug 2018 to Jan 2019.
West Marine: Driving Growth Through Shipshape Supply
Chain Management GS-34
p. 25
Exhibit 4
Partial Executive Organization (2003)
Source: Information provided by West Marine.
John Edmondson
CEO
Rich Everett
COO
Eric Nelson
CFO
Ken Corwin
Senior VP
Merchandising
Larry Smith
Senior VP Planning
& Replenishment
Tom Carey
Senior VP
Marketing
Bruce Edwards
Senior VP Store
Operations
David Schenk
CIO
Pat Murphy
Senior VP
Logistics
Chris Bolling
VP Port Supply
Tony Gasparich
VP Direct Sales
For the exclusive use of A. Bregante, 2018.
This document is authorized for use only by Anthony Bregante
in SCM 800 Fall 2018 Aggon taught by NORMAN AGGON,
The Pennsylvania State University from Aug 2018 to Jan 2019.
West Marine: Driving Growth Through Shipshape Supply
Chain Management GS-34
p. 26
Exhibit 5
Partial List of Key West Marine Team Members (2003)
Chris Bolling – Chris Bolling joined West Marine in 1994 and
has been responsible for real
estate strategy, market research, and support of new company
initiatives. He has had a role in
growing the store base from 54 units to over 350 units and was
actively involved in the
company’s expansion into Canada, the development of the small
format West Marine Express
stores, and the company’s most recent acquisitions. Bolling
also managed West Marine’s
wholesale division, where he developed a regional sales and
support structure to address the
needs of multiple market segments.
Tom Carey – Tom Carey joined West Marine as the senior vice
president of marketing in 2003.
He was the senior vice president of marketing for Goody's
Family Clothing Inc. from 2001 to
2002, senior vice president of marketing for Sunglass Hut
International from 1999 to 2001, vice
president of marketing for Bloomingdale’s from 1997 to 1999,
vice president of marketing for
Builder's Square from 1994 to 1997, and Fogarty Klein &
Partners from 1994 to 1995. Before
that, Carey worked for advertising agencies including Ogilvy &
Mather and Young & Rubicam,
for clients such as American Express, Lincoln Mercury,
Kenmore and JC Penney.
Ken Corwin – Ken Corwin joined West Marine in 1999 as the
senior vice president of
merchandising and general merchandise manager. He has 34
years of experience in all facets of
retail management. Corwin served as the president of World
Duty Free International’s airport
division from 1998 to 1999, senior vice president for Venture
stores from 1997 to 1998, and vice
president-director of stores for Gottschalk’s from 1990 to 1997.
He also held merchandising
management positions with both Target and the J.C. Penney
Company from 1971 to 1988.
John Edmondson – John Edmondson joined West Marine in
1998 as the company’s president
and chief executive officer. Edmondson was formerly president
and CEO of World Duty Free
International, Inc. where he helped lead the industry-leading
retail organization to significant
sales and profit growth. He joined World Duty Free in 1992 as
president of the company's largest
operating divisions. During his tenure with the organization he
also held the role of corporate
chief operating officer. Edmondson began his career with
Allied Store's Maas Bros./Jordan
Marsh division in 1965 and held various senior management
positions with several retailers.
From 1976 to 1980 he served as senior vice president and
general merchandise manager of
Allied Store's Joske's of Texas division before leaving to join
Federated Department Store's
Filenes division in Boston. Prior to joining World Duty Free
International Inc., Edmondson was
general manager of Marriott's Host and Sports & Entertainment
divisions.
Bruce Edwards – Bruce Edwards joined West Marine in 1985
and has been responsible for
running all three of the company’s profit centers (catalog, port
supply, and stores). He had an
instrumental role in the long-term growth of West Marine from
10 to 350 stores, including active
management of over 10 of the company's acquisitions. Edwards
has been involved in the marine
industry his entire career and has a background in sail making
and boat building.
For the exclusive use of A. Bregante, 2018.
This document is authorized for use only by Anthony Bregante
in SCM 800 Fall 2018 Aggon taught by NORMAN AGGON,
The Pennsylvania State University from Aug 2018 to Jan 2019.
West Marine: Driving Growth Through Shipshape Supply
Chain Management GS-34
p. 27
Rich Everett – Rich Everett served as a director of West Marine
since 1994 and as the
company’s chief operating officer since 1995. From 1998 to
2001, Everett was president of
stores. In this role, he directed the day-to-day operations and
expansion of West Marine's
nationwide retail store network and (effective in 2001) oversaw
the company’s catalog and
Internet divisions. From 1996 to 1998, he served as executive
vice president and has held
various other positions since joining West Marine in 1981.
Tony Gasparich – Tony Gasparich served as vice president of
Internet at West Marine since
1999. In 2002, he assumed the role of vice president of direct
sales (catalog and Internet). In
this position, he directs day-to-day operations and strategic
direction for the direct sales division.
Between 1997 and 1999 he served as merchandise manager, and
has held various other positions
since joining West Marine in 1979.
Pat Murphy – Pat Murphy joined West Marine in 1999 as the
senior vice president of logistics.
He has vast experience working in the retail industry with a
focus on logistics and distribution.
From 1993 to 1999, Murphy was group vice president of
logistics for Borders Group, Inc. He
served as general manager and president of the Midwest
operating division of the Southland
Corp. from 1989 to 1992, as director of distribution for Wilson
Foods from 1985 to 1989, and as
general manager for Levi Strauss & Company's distribution
center from 1980 to 1985.
Eric Nelson – Eric Nelson joined West Marine in 2000 as the
controller and vice president of
finance, then moved into the roles of chief financial officer,
chief accounting officer, senior vice
president of finance, and secretary. Previously, Nelson served
as CFO for Dental Components
International from 1999 to 2000, CFO for Fluid-Air
Components from 1995 to 1999, and CFO
for Etcetera Retail Chain Stores, Inc. from 1989 to 1994. He
also worked as a "troubled
company" turnaround specialist from 1994 to 1995 and was the
assistant controller for May
Department Stores from 1979 to 1989.
David Schenk – David Schenk joined West Marine in October
2000 as vice president and chief
information officer and was soon promoted to senior vice
president. As the leader of
information systems for the company, he oversaw software
development, retail systems, and
network systems and security. He and his team were
responsible for supporting over 350 West
Marine retail stores, plus West Marine’s catalog, Internet and
port supply/wholesale businesses.
Prior to West Marine, Schenk was a corporate senior vice
president for McKesson Corporation
for 18 years, where he was responsible for several business
units including software
implementation and support, outsourcing and network design,
installation and support.
Larry Smith – Larry Smith joined West Marine in 1999 as the
senior vice president of planning
and replenishment. Prior to joining West Marine, Smith served
as the divisional vice president
of planning and replenishment for Kmart Corporation from 1996
to 1999. He also served as the
director of planning & replenishment for Staples from 1995 to
1996 and the director of inventory
management for Kaybee Toy Stores from 1994 to 1995. Smith
published several articles and
received RIS News Magazine's "Retail Pacesetter Award" in
June of 2003, honoring the 20
leading retail technology executives.
Source: Information provided by West Marine.
For the exclusive use of A. Bregante, 2018.
This document is authorized for use only by Anthony Bregante
in SCM 800 Fall 2018 Aggon taught by NORMAN AGGON,
The Pennsylvania State University from Aug 2018 to Jan 2019.
West Marine: Driving Growth Through Shipshape Supply
Chain Management GS-34
p. 28
Exhibit 6
West Marine Strategic Framework
Source: Information provided by West Marine.
CRITICAL SUCCESS FACTORS
CSF #1
CSF #2
CSF #3
CSF #4
CSF #5
CSF #6
STRATEGIC PERFORMANCE INDICATORS
Best of class supply
chain management
Right product
assortments at the
right place at the
right time
Strong customer
relationship culture
that maximizes sales,
profitably
Efficient, reliable,
accountable, and
quality execution
Effective mktg strategy
that communicates our
leadership position &
grows brand equity
High Performing
team of motivated
professional,
associates
VISION
The best boating products company,
every day.
ROE, Cash Flow, Comp Sales, EPS, Product Service Levels,
Market Share,
Customer Satisfaction, Associate Satisfaction
For the exclusive use of A. Bregante, 2018.
This document is authorized for use only by Anthony Bregante
in SCM 800 Fall 2018 Aggon taught by NORMAN AGGON,
The Pennsylvania State University from Aug 2018 to Jan 2019.
West Marine: Driving Growth Through Shipshape Supply
Chain Management GS-34
p. 29
Exhibit 7
CPFR® Process Model
Collaboration Roles
Alternatives Sales Forecasting Order Planning/
Forecasting
Order
Generation
Option A: Conventional Order
Management
Retailer Retailer Retailer
Option B: Supplier-Managed
Inventory
Retailer Manufacturer Manufacturer
Option C: Co-Managed
Inventory
Retailer Retailer Manufacturer
Option D: Retail Vendor-
Managed Inventory
Manufacturer Manufacturer Manufacturer
Source: CPFR® Overview, May 18, 2004. Copyright ©
Voluntary Interindustry Commerce Standards (VICS)
Association. All rights reserved. Reprinted by permission of
VICS.
For the exclusive use of A. Bregante, 2018.
This document is authorized for use only by Anthony Bregante
in SCM 800 Fall 2018 Aggon taught by NORMAN AGGON,
The Pennsylvania State University from Aug 2018 to Jan 2019.
West Marine: Driving Growth Through Shipshape Supply
Chain Management GS-34
p. 30
Exhibit 8
West Marine’s Multi-Echelon Replenishment
Solution
Source: Information provided by West Marine.
Customer Sales Determinants Systems
Used to manage:
• Replenishment location*
• Start/stop date*
• Purchase/ship multiples*
• Base annual forecast*
• Seasonality*
• Item ranking*
• Promotions*
• Non-stocking sales*
Promotion
Planning
System
Used to
manage
impact of
promotions
on demand
Profiling
System
Used to
manage
impact of
seasonality
and
regionality
on demand
Visual
Merchan-
dising
System
Used to
manage
planograms
and
assortment
data
Store Level
Forecasting
and
Replenishment
System
Used to develop
item forecasts at
the individual
store level
Point of
Sales
Forecast
Planning System
Used to:
• Plan targeted results
(sales, margins)
• Determine anticipated
receipt and inventory
results
Distribution Center
Level Forecasting and
Replenishment
System
Used to aggregate store
level forecasts and
optimize inventory
enterprise-wide*
Store Order
Forecast
Supplier
Orders and
Order
Forecasts
* Prior to the implementation of the multi-echelon solution,
these activities were performed manually (or not done at all)
Custom User Interface
Provides users with a transparent, integrated view across all
components of the multi-echelon solution
For the exclusive use of A. Bregante, 2018.
This document is authorized for use only by Anthony Bregante
in SCM 800 Fall 2018 Aggon taught by NORMAN AGGON,
The Pennsylvania State University from Aug 2018 to Jan 2019.
West Marine: Driving Growth Through Shipshape Supply
Chain Management GS-34
p. 31
Exhibit 9
Collaborative West Marine Supply Chain Process
Legend
CM = Category Management
AP = Assortment Planning
MP = Merchandise Planning
RA = Replenishment Analysis
Mktg = Marketing
Visual = Visual Merchandising
- TRIGGERS -
New customer need
Need for category reset
New vendor product introduction
New market opportunity
CONCEPT
Primary
Activities
Owner
Source product CM
Negotiate vendor
agreement
CM,
Vendor
Determine
pricing profile
and margin
CM
Determine
promotability
CM,
Vendor
PLAN
Primary
Activities
Owner
Define
appropriate
assortment
CM,
AP,
Vendor
Formalize
pricing
CM
Incorporate into
planograms
AP,
CM,
Visual
Create initial
forecast
CM,
MP
Determine
launch date and
prepare for roll-
out
CM,
RA,
Vendor
Plan specific
promotions
CM,
MP,
Mktg,
Vendor
ACTION
Primary
Activities
Owner
Set up seasonal
profile and load
forecast into
replenishment
system
AP,
RA
Share forecast
with vendor
MP
Purchase initial
fill
MP
Implement new
product roll-out
at store level
Stores
Execute ongoing
collaborative
processes
(ongoing)
CM,
MP,
RA
Execute
scheduled
promotions
(ongoing)
CM,
MP,
Mktg,
Stores
Note: Process simplified for illustrative purposes.
Source: Information provided by West Marine.
For the exclusive use of A. Bregante, 2018.
This document is authorized for use only by Anthony Bregante
in SCM 800 Fall 2018 Aggon taught by NORMAN AGGON,
The Pennsylvania State University from Aug 2018 to Jan 2019.
West Marine: Driving Growth Through Shipshape Supply
Chain Management GS-34
p. 32
Exhibit 10
Sample Vendor Performance Reports
Weekly Instock E-mail
Weekly Instock Analysis
Source: Information provided by West Marine.
The current instock results for LEWMAR, supplier #012123
items at West Marine this morning is as follows:
Instock percent in West Marine Stores is 97.70%. West
Marine's goal is 96% instock in every store every week.
Late Orders, reflecting late shipments for EDI suppliers, and
late receipts for non-EDI suppliers: $1,700.
Understock at West Marine stores, items you and West Marine
would ship to stores now, but which are not available: $2,520.
Thanks for your ongoing commitment to growing your sales
with West Marine. Great Job!
For the exclusive use of A. Bregante, 2018.
This document is authorized for use only by Anthony Bregante
in SCM 800 Fall 2018 Aggon taught by NORMAN AGGON,
The Pennsylvania State University from Aug 2018 to Jan 2019.
West Marine: Driving Growth Through Shipshape Supply
Chain Management GS-34
p. 33
Exhibit 11
West Marine CPFR® Vendor Success Stories
Interlux
Interlux supplied more than 500 products to West Marine,
including key items like bottom paints
and varnishes required to help boaters prepare for the peak
boating season each spring. If West
Marine did not have these products instock at the beginning of
the season, these sales would
potentially be lost until the beginning of the following season
(painting was typically done
annually, before the first time a customer put his/her boat into
the water for the season).
Initially, Interlux agreed to participate in West Marine’s
CPFR® program, but did not invest
itself in the process. The company did not use the forecasts
provided by West Marine to plan
advanced production or build up safety stocks prior to peak
season. As a result, when preseason
demand for products like bottom paint ramped up, the
company’s standard production capacity
could not keep pace with West Marine’s needs. When boaters
needed Interlux products the
most, West Marine was unable to keep them stocked in the
stores. In a single season, West
Marine estimated that it lost more than $1 million in sales of
Interlux products due to late
shipments and instock problems.
At the urging of West Marine’s category management team for
maintenance products, the
Interlux team finally agreed to more actively begin using the
forecasts and collaborating with
West Marine to resolve these supply chain challenges. The
head of Interlux’s U.S. operations
began regularly participating in monthly collaborative calls with
West Marine’s merchandise
planner, along with representatives from the company’s vendor
relations, logistics, and customer
support teams. The company also dedicated an analyst to
carefully study West Marine’s
projections and determine the most effective way to incorporate
them into the company’s
advance planning processes.
Working together, the two organizations collaboratively
implemented significant improvements.
By the next spring season, the company’s instock rates
improved from 94 percent to 97 percent
in all stores. Similarly, Interlux increased its on-time
shipments to West Marine by more than 55
percent. Sales climbed by more than 17 percent over the
previous season. Improved supply
chain effectiveness also enabled West Marine to rely on Interlux
to ship more than $1.1 million
in products directly to its stores (up from $200,000 the previous
year), thereby reducing the time
required to move products to the stores, saving West Marine
significant logistics costs, and
reducing seasonal bottlenecks in West Marine’s DCs.
Interlux is now one of West Marine’s greatest CPFR®
advocates, and both companies are
directly benefiting from increased cooperation and
collaboration.
RayMarine
RayMarine provided West Marine with a wide variety of high-
end marine electronics, including
radar and GPS systems and related accessories. Formerly a
division of Raytheon, the company
became an independent organization just as West Marine was
implementing its CPFR®
program. However, rather than using West Marine’s forecasts
to begin operating more
efficiently (in its new, leaner environment), the company
reduced its safety stocks, planned its
For the exclusive use of A. Bregante, 2018.
This document is authorized for use only by Anthony Bregante
in SCM 800 Fall 2018 Aggon taught by NORMAN AGGON,
The Pennsylvania State University from Aug 2018 to Jan 2019.
West Marine: Driving Growth Through Shipshape Supply
Chain Management GS-34
p. 34
product lifecycles, and scheduled production with little or no
direct input from West Marine (or
its other customers). As a result, RayMarine was frequently
caught by surprise when West
Marine’s purchase orders arrived (despite their inclusion in the
forecasts), leading to late and
incomplete shipments, as well as instock levels well below
target. RayMarine also began
discontinuing its products every 18 months without providing
notice to West Marine. With these
items discontinued faster than West Marine could sell them
(high-end electronics products turned
over at a rate of just 80 percent a year), the short product
lifecycles caused RayMarine’s total
SKU count with West Marine to mushroom. This also left West
Marine with a sizable backlog
of discontinued products, as well as cables and other
accessories that only worked with items that
were no longer produced.
West Marine had been providing weekly forecasts and
performance reports to RayMarine for
quite some time. When the company finally began to review
them in detail, they realized how
inefficient their interactions with West Marine had become. At
this point, RayMarine engaged
with West Marine’s category management team for electronics
and actively started to
collaborate. Through a series of frank discussions, RayMarine
started to better understand West
Marine’s forecasts and appreciate the impact of its short product
lifecycles on the company.
RayMarine extended its product lifecycles to three years and
reduced its total SKU count by
more than 30 percent, in part by designing cables and
accessories that would be backward-and-
forward compatible (to work with old and new products).
RayMarine also dedicated an analyst
to reviewing its sales with West Marine and helping the
company reduce its discontinued
inventory (suggesting where to move it, how to price it, etc.).
This effort enabled West Marine
to decrease its backlog of discontinued items by more than 50
percent. By using West Marine’s
forecasts, RayMarine also increased its instock rate to levels
well above West Marine’s target.
Through better instore availability and more collaborative sales
planning, the two companies also
drove a 40 percent sales increase over the previous year.
Even while still in the midst of a transition, West Marine and
RayMarine, both acknowledged
having benefited from increased collaboration, and had every
intention of staying the course.
For the exclusive use of A. Bregante, 2018.
This document is authorized for use only by Anthony Bregante
in SCM 800 Fall 2018 Aggon taught by NORMAN AGGON,
The Pennsylvania State University from Aug 2018 to Jan 2019.
SCM 800
West Marine Case Team Assignment
Assignment Document:
This document includes the following assignment information
needed to complete this case assignment:
I. Assignment Objectives
II. Assignment Introduction
III. Assignment Directions
IV. Assignment Guidelines and Requirements
V. Assignment Questions
VI. Grading Criteria
VII. Cover Page
VIII.
I. Assignment Objectives:
The goal of this assignment is to utilize concepts mastered and
apply them in a real world setting. West Marine explores
various themes including but not limited to the following:
1. Evaluate CPFR and its impact of a firm
2. Explore issues surrounding collaboration and coordination in
a supply chain environment
3. Analyze the impact of mergers and acquisitions on supply
chain management
4. Illustrate implementation challenges and propose solutions
utilizing CPFR
5. Specify and analyze various costing issues
6. Assess risk and mitigation strategies
II. Assignment Introduction:
This real world case assignment is designed to help students
evaluate the use of a collaborative approach to integrating
across the SCOR processes of Plan, Source and Deliver
(Customer Fulfillment) within the context of a retail
environment. Teams will assess the firm’s supply chain before
and after the implementation of CPFR. They will analyze the
existing supply chain’s problems, propose solutions, and will
critically evaluate the CPFR process—including its strengths,
weaknesses, implementation challenges, and operational issues.
III. Assignment Directions:
You are to develop a 17 slide professional PowerPoint
presentation. You must use proper grammar, punctuation,
spelling, sentence construction, proper paragraph usage, etc.
Assume you will be using this deck in a presentation for
corporate leaders within the West Marine organization!
Therefore, you need to prepare the slides in a professional
manner. For example--in a professional slideshow you would
not use complete sentences on a particular slide…you would
normally use bullet points. Also, graphs, URL’s to short video
clips, etc. would be helpful.
Please note I will be evaluating the slides in the presentation
mode. If the slides cannot be read in that manner, you will lose
points.
Since you cannot answer the questions totally on the slides
themselves, teams should use the Notes portion (see Notes page
under the View tab of the PowerPoint slide presentation) of the
PowerPoint slides for areas that require in depth explanation.
When you utilize the Notes section, you are limited to the
PowerPoint slide on the top of the Notes page and the
information below it.
All extra information about a particular slide must fit on that
8.5 by 11 portrait version of the Notes page for a particular
slide. I would suggest on this portion of the slide to reference
the question you are answering by stating on the first line Q1,
Q2, etc. By seeing this marker--Q1, Q2, etc.--I will know what
question you are answering. No need to repeat the questions--I
know them.
One of the early slides should include an agenda slideand/or
objective slide--this slide is not counted toward the total. Also,
you will be required to have a summary slide that includes a
“next set of steps” recommendation--this slide is not counted
toward the total.
Please note: The team should place citations on the slides as
needed that illustrate the problems/questions/goals/objectives,
etc. you are trying to obtain.
See the Course Schedule for due dates for these deliverables.
IV. Assignment Guidelines and Requirements:
1. Your team’s responses should be organized into a PowerPoint
presentation of approximately 17 slides. Is the presentation
concise and succinct?
2. All extra information about a particular slide must fit on that
8.5 by 11 portrait version of the Notes page for a particular
slide.
3. Utilize graphics or even a short video to help emphasize a
particular concept or elaborate on an answer to a question.
4. Are the slides logically organized?
5. Are proper grammar rules, punctuation, spelling, and
sentence construction used?
6. Do the slides support, amplify, and clarify your answers?
7. Do the slides represent correct information?
8. Is the presentation visually attractive?
9. Do the slides have a common font, theme, etc.?
10. Does the PowerPoint deck contain an agenda slide,
overview, or objectives slide?
11. Does the PowerPoint deck have a summary slide?
12. Please include a cover page that includes the team name,
assignment name, date, and individual names of team members.
13. Please use proper citations on the appropriate slides when
necessary. Do not plagiarize.
14. Points will be deducted for not following formatting
directions and not answering all assignment questions.
V. Assignment Questions:
Note: The instructor reserves the right to change the points for
this assignment and these questions at his discretion. Points
shown below are only approximate and may change.
Please answer the following questions in your presentation:
Note: Question 1 through Question 5 pertains to WM after the
E&B Marine acquisition.
Question 1: Please draw a schematic diagram of the West
Marine supply chain. This diagram would fit somewhere
between a process flow diagram and a value stream map. (20
total points)
· Based upon the information in the case only, add all the
information to the diagram that you would think a responsible
supply chain manager would require using this diagram to help
him/her analyze this supply chain. (For example number of
sku's, inventory safety stock, etc.)
· Utilizing the notes section of the slide, list the three most
important bits of information (not mentioned in Part 1 above)
you think would be beneficial to assist a supply chain manager
in evaluating this supply chain. So, what information is missing
from the case that you would like to know so that you could
analyze the case more fully? This situation happens all the time
in industry!
· Briefly (and the key word is briefly) explain why you would
need this information from Part 2 of the question.
· How might you actually obtain the information in Part 3?
Question 2: List and explain the primary dangers of executing
an acquisition when the company does not have a solid supply
chain foundation? Utilize the point in time just after the E&B
acquisition. (20 total points)
· Sometimes when you are inside a company it is difficult to see
the forest for the trees--always fighting today’s battles!
Therefore, for this question place yourself in the position of a
consultant with 100% complete access to West Marine via the
case.
· The intent of this question is for you to probe the case for the
strategic dangers that lurk in the absence of a solid supply chain
infrastructure
· An average response will identify at least two dangers. A top-
level response will identify four. Do not exceed four! I am not
looking for extensive lists---I am looking for depth and breadth.
Question 3: What supply chain improvements were necessary
for WM to turnaround its supply chain performance? (20 total
points)
· The intent of this question is for you to probe the case for the
most important underlying causes of the problems that WM
must address. You must define the problem before you can
solve the problem!
· An average response will identify at least two improvements.
A top-level response will identify four. Do not exceed four! I
am not looking for extensive lists---I am looking for depth and
breadth.
· Also, be sure to explain or make an argument justifying why
your solution solves an existing problem.
Question 4: Why is CPFR important? How did CPFR help WM
address its supply chain challenges? (20 total points)
· This question consists of two parts: Why and How!
· Be specific and freely use examples from the case when
responding to this question! The lack of examples from the case
is a typical area where students lose points.
Question 5: For WM what are the two most important
ingredients needed to achieve “break through supply chain
performance” utilizing CPFR? (20 total points)
· Be specific and use examples from the case when responding
to this question! The lack of examples from the case is a typical
area where students lose points.
Question 6: Is WM ready for the Boat U.S. acquisition….yes or
no? What are its primary supply chain risks--especially as it
relates to CPFR? What should the top priorities be in
integrating the two organizations? Explain your reasoning and
how it might tie back into previous modules. (20 total points)
· For this set of questions, be certain that you focus on the Boat
U.S. acquisition!
· An average response will identify at least two items. A top-
level response will identify four. Do not exceed four! I am not
looking for extensive lists---I am looking for depth and breadth.
VI. Grading Criteria: West Marine PowerPoint Presentation
Assignment:
(The instructor reserves the right to change the grading criteria
for this assignment without notice.)
PowerPoint presentations are another communication device
that stresses organizing thoughts in the appropriate hierarchy
and sequence, selecting words for their power and
expressiveness, using technical terms in appropriate contexts,
and representing complex data and symbols precisely in prose.
Analysis:
1. Does the PowerPoint deck answer each of the questions?
2. Does each answer to a question contain analysis of the major
issues?
3. Does the analysis for each question incorporate
concepts/techniques from all readings (including previous
modules)?
4. Does the analysis show relationships among important
factors?
5. Are assumptions explicitly stated?
6. Does the analysis isolate fundamental causes of the
problems?
7. Does the analysis contain enough detail to support your
answers?
8. When the analysis is undertaken, does it use the information
at its disposal correctly, thereby leading to correct answers?
9. Does the presentation utilize the information and apply it to
today’s business environment?
Quality of Professional PowerPoint Slides:
1. Are the slides logically organized?
2. Are proper rules of grammar, punctuation, spelling, sentence
construction, etc. are used?
3. Is the presentation concise and succinct—length 17 to 20
slides?
4. Do the PowerPoint slides support, amplify and clarify your
answers?
5. Do the PowerPoint slides represent correct information?
6. Is the presentation visually attractive?
7. Was the Notes section in the PowerPoint utilized to add depth
to the presentation?
8. Do the PowerPoint slides have a common font, theme, etc.?
9. Does the PowerPoint deck contain an agenda slide, overview,
or objectives slide?
10. Does the PowerPoint deck contain a schematic of the supply
chain that is under analysis?
11. Does the PowerPoint deck have a summary slide? Does it
point out “next steps?”
12. Do the PowerPoint slides have graphics, a short video, etc.
that help to emphasize particular points? You must explain in
the Notes section how this clip adds to your answer.
Overall Criteria:
1. Is the Power Point presentation logically consistent and
effectively structured so it sells its ideas?
Miscellaneous Comments
Cover Sheet
West Marine Case
GRADE: __________ /200
Date Submitted: ____________________
Team Number: ____________________
Individual Team Member Names:
Team Member’s Name ___________________________
Email_______________
Team Member’s Name ___________________________
Email_______________
Team Member’s Name ___________________________
Email_______________
Team Member’s Name ___________________________
Email_______________
Team Member’s Name ___________________________
Email_______________
1
Discussion on International Trade Policy of Saudi Arabia with
other Countries
Instructions and steps for the assignment:
1. This is a group discussion assignment. You can form a team
of up to 4 members.
2. Study the trade policy of Saudi Arabia and compare these
policies with one any of its trading partners.
3. Read Chapter 6 and prepare a discussion report on the
comparative study. The write up must clearly introduce the
trading policies of the two countries and highlight the main
discussion points of the team.
4. The discussion report must be prepared in a neat professional
report format with the following sections
a. Format (10 Marks): Title Page, Table of Contents,
Appendices etc.
b. Introduction: countries, background, discussion topic and
reference to points to be highlighted
c. Discussion (10 Marks): Detailed discussion of the trade
policies of both countries (minimum 4 paragraphs)
d. Analysis/ Evaluation(10 Marks): comparative study, reasons,
impact, advantages, disadvantages etc. Do use original
comparative tables, figures and graphs
e. Conclusion(5 Marks): Your learning, how it was useful to
understand the context and trade policies and its importance,
how this knowledge would be used in your professional lives
f. References (5 Marks): minimum 5 sources reference from the
recommended sites, research papers and journal articles
5. The team will then demonstrate their learning, evaluation of
the cases and their own conclusions during the group
discussion. (20 Marks):
6. Submit both soft copy and printed copy of the Assignment
(instructions and the report as one file).
7. Research from relevant academic sources like research
papers, journal articles and company websites is expected.
BUS 412 International Business
Semester 391 - Assignment 2
Discussion on International Trade Policy of Saudi Arabia with
other Countries
Student Name
Format
Discussion
Analysis and Evaluation
Conclusion
References
Group Discussion
Total
10
10
10
5
5
20
60
1
2
3
4
Recommended Sources for Reference:
1.
https://www.wto.org/english/thewto_e/countries_e/saudi_arabia
_e.htm
2. https://www.wto.org/english/tratop_e/tpr_e/tp433_e.htm
3. https://www.export.gov/article?id=Saudi-Arabia-trade-
barriers
4. https://www.export.gov/article?id=Saudi-Arabia-Trade-
Agreements
Wish you an Interesting Experience!!

6-International BusinessEnvironments & Operations.docx

  • 1.
    6-* International Business Environments &Operations 15e, Global Edition Daniels ● Radebaugh ● Sullivan Copyright © 2015 Pearson Education Ltd. * International Business Environments and Operations 15e, Global Edition by Daniels, Radebaugh, and Sullivan 6-* Chapter 6 Trade Protectionism Copyright © 2015 Pearson Education Ltd. * Chapter 6: Trade Protectionism 6-* Learning ObjectivesExplain why governments try to enhance and restrict tradeShow the effects of pressure groups on trade
  • 2.
    policiesCompare the potentialand actual effects of government intervention on the free flow of tradeIllustrate the major means by which trade is restricted and regulated Copyright © 2015 Pearson Education Ltd. * The Learning Objectives for this chapter areTo explain the rationales for governmental policies that enhance and restrict tradeTo show the effects of pressure groups on trade policiesTo describe the potential and actual effects of governmental intervention on the free flow of tradeTo illustrate the major means by which trade is restricted and regulatedTo demonstrate the business uncertainties and business opportunities created by governmental trade policies Learning ObjectivesDemonstrate the business uncertainties and opportunities created by governmental trade policiesDiscern how businesses may respond to import competitionFathom how the growing complexity of products and trade regulations may affect the future 6-* Copyright © 2015 Pearson Education Ltd. Copyright © 2015 Pearson Education, Inc. 6-* IntroductionProtectionism - policies that affect the ability of foreign producers to compete in your home marketlimit or enhance your company’s ability to sell abroad or acquire needed foreign supplies Copyright © 2015 Pearson Education, Inc.
  • 3.
    * While free tradeis beneficial, in reality all countries regulate the flow of goods and services across their borders. Governments want to help companies that are struggling, but it’s difficult to do so without hurting those that are doing well. Copyright © 2015 Pearson Education, Inc. 6-* Introduction Physical and Social Factors Affecting the Flow of Goods and Services Copyright © 2015 Pearson Education, Inc. * This Figure shows the physical and social factors that affect the flow of goods and services. 6-* Conflicting Results of Trade PoliciesGovernments intervene in trade to achieve economic, social, and political goalsPolicymakers are challenged byconflicting objectivesinterest groups Copyright © 2015 Pearson Education Ltd. * Government officials use trade policy to try to achieve economic, social, and political goals. However, their efforts are hampered by uncertain and conflicting policy outcomes, as well
  • 4.
    as the goalsof special interest groups. 6-* The Role of StakeholdersProposed policies on trade spark debate Stakeholders include WorkersOwnersSuppliersLocal politiciansConsumers usually don’t care Copyright © 2015 Pearson Education Ltd. * Proposed government policies often spark fierce debate among those who could be affected. Those who are most directly affected tend to be loudest in voicing their concerns. 6-* Economic Rationales for Governmental Intervention Learning Objective: Explain why governments try to enhance and restrict trade Copyright © 2015 Pearson Education Ltd. * Learning Objective : To explain the rationales for governmental policies that enhance and restrict trade. 6-* Economic Rationales for Government Intervention Why governments intervene in tradeEconomic rationalesFighting unemploymentProtecting infant industriesPromoting industrializationImproving comparative
  • 5.
    positionNon-economic rationalesMaintaining essential industriesPromotingacceptable practices abroadMaintaining or extending spheres of influencePreserving national culture Copyright © 2015 Pearson Education Ltd. * This Table shows the reasons for government intervention in trade. Notice that there are both economic and noneconomic reasons for intervention. 6-* Fighting Unemployment Learning Objective: Show the effects of pressure groups on trade policies Copyright © 2015 Pearson Education Ltd. * Learning Objective : To show the effects of pressure groups on trade policies. 6-* Fighting UnemploymentThe unemployed are the most effective pressure groupBut, import restrictionscan lead to retaliation by other countriesare less likely retaliated against effectively by small economiesare less likely to be met with retaliation if implemented by small economiesmay decrease export jobs because of price increases for componentsmay decrease export jobs because of lower incomes abroad Copyright © 2015 Pearson Education Ltd.
  • 6.
    * Unemployed people areone of the most effective pressure groups for restrictions on imports. But, trying to fix employment problems using trade policy can create new challenges. Costs that are often associated with import restrictions include higher prices and higher taxes. Governments must balance the potential for these costs with the benefits of creating new jobs. Fiscal and monetary policies may be more effective at correcting unemployment problems. 6-* Protecting ‘Infant Industries’ Learning Objective: Compare the potential and actual effects of government intervention on the free flow of trade Copyright © 2015 Pearson Education Ltd. * Learning Objective : To describe the potential and actual effects of governmental intervention on the free flow of trade. 6-* Protecting ‘Infant Industries’The infant industry argument government protection of import competition is necessary to help certain industries evolve from high-cost to low-cost productionUsed by developing countries Copyright © 2015 Pearson Education Ltd.
  • 7.
    * According to theinfant industry argument, production becomes more competitive over time because of increased economies of scale and greater work efficiency. Therefore, if an emerging industry is protected during its infancy it has a greater chance for success. Many developing countries use this argument as a rationale for implementing protectionist policies. Keep in mind though that production costs may never fall far enough to make an industry competitive making it important to clearly identify those industries with the greatest chance for success. Even then, because of the costs involved, protectionism may not be automatic. 6-* Developing an Industrial BaseCountries promote industrialization because itbrings faster growth than agriculturebrings in investment fundsdiversifies the economycreates growth in manufactured goodsreduces imports and promotes exportshelps the nation-building process Copyright © 2015 Pearson Education Ltd. * Generally, countries with higher per capita GDP have larger manufacturing bases. So, countries that are trying to develop an industrial base may intervene in trade flows. The United States for example, has restricted imports to grow its manufacturing base. 6-* Economic Relationships
  • 8.
    With Other CountriesTradecontrols can be usedto improve the balance of paymentsto gain fair access to foreign marketscomparable access argumentas a bargaining toolbelievability and importanceto control pricesdumpingoptimum-tariff theory Copyright © 2015 Pearson Education Ltd. * Countries can use trade controls to improve their relationships with other countries. In addition to using trade restrictions to improve the nation’s balance of payments, governments may also intervene in trade to ensure that domestic producers have the same access to other markets as foreign companies have to their markets, to encourage countries to change their policies, and to control prices. Keep in mind that governments have to be careful when using trade restrictions to control prices. If prices get too high, it could result in smuggling or substitution. Similarly, if prices get too low, there’s an incentive to produce less or to shift foreign production and sales. Trade restrictions can be used to prevent a practice known as dumping which involves exporting below cost or below home country prices, and to get foreign producers to lower their prices. According to the optimum tariff theory, a foreign producer will lower its prices if the importing company places a tax on its products. 6-* Noneconomic Rationales for Government InterventionNoneconomic rationales includeMaintaining essential industriesPromoting acceptable practices abroadMaintaining or extending spheres of influencePreserving
  • 9.
    national culture Copyright ©2015 Pearson Education Ltd. * Sometimes governments may intervene in trade for political reasons including maintaining essential industries, promoting acceptable practices abroad, maintaining or extending spheres of influence, or preserving national culture. 6-* Maintaining Essential IndustriesThe essential industry argumentprotect essential industries so the country is not dependent on foreign supplies during warCountries mustdetermine which industries are essentialconsider costs and alternativesconsider political consequences Copyright © 2015 Pearson Education Ltd. * The essential industry argument of protecting certain industries to avoid dependency on foreign supplies can be appealing, but keep in mind that in theory almost any product could be deemed essential. 6-* Promoting Acceptable Practices AbroadImport trade controls can be usedto promote changes in foreign countries’ political policies or capabilitiesas a foreign policy weaponto pressure governments to alter their stances on a variety of issues human rightsenvironmental
  • 10.
    protection Copyright © 2015Pearson Education Ltd. * Governments can use trade policy to encourage or discourage certain types of behavior by other countries. 6-* Maintaining or Extending Spheres of InfluenceGovernments provide assistance and encourage imports from countries that join a political alliance or vote a preferred way within international bodiesCotonou AgreementA country’s trade restrictions may coerce governments to follow certain political actions or punish companies whose governments do not Copyright © 2015 Pearson Education Ltd. * Trade restrictions can also be used to support a country’s sphere of influence. 6-* Preserving National CultureIn order to preserve national culture, countrieslimit foreign products and services in certain sectorsCanada’s cultural sovereigntyprohibit exports of art and historical items deemed important to national heritage Copyright © 2015 Pearson Education Ltd. * Sustaining the collective identity that sets their citizens apart
  • 11.
    from those inother nations, is another reason why countries intervene in trade flows. Rice imports were strictly limited for years in Japan for example, because rice farming was considered to be a historically cohesive force in the country. 6-* Instruments of Trade Control Learning Objective: Illustrate the major means by which trade is restricted and regulated Copyright © 2015 Pearson Education Ltd. * Learning Objective : To illustrate the major means by which trade is restricted and regulated. 6-* Instruments of Trade ControlTwo types of trade controlsthose that indirectly affect the amount traded by directly influencing prices of exports or importsthose that directly limit the amount of a good that can be traded Copyright © 2015 Pearson Education Ltd. * There are many different ways to intervene in trade flows. It’s important to choose the right instrument to achieve a particular objective.
  • 12.
    6-* TariffsTariffs are alsoknown as dutiesrefer to a government levied tax on goods shipped internationallyTariffs may be levied on goods entering, leaving, or passing through a country for protection or revenueon a per unit basis or a value basisexport tariffstransit tariffsimport tariffs Copyright © 2015 Pearson Education Ltd. * Tariffs directly influence prices, while nontariff barriers affect either price or quantity. When a country assesses a tariff on a per unit basis it’s applying a specific duty. A tariff that’s assessed as a percentage of the item’s value is an ad valorem tariff. A compound duty is due when both a specific and an ad valorem tariff are assessed. 6-* Nontariff Barriers: Direct Price Influencers Subsidies direct assistance to companies to make them more competitiveagricultural subsidies overcoming market imperfectionsvaluation problems Copyright © 2015 Pearson Education Ltd. * Nontariff barriers can affect either quantity sold or price. Subsidies are one of the most common ways to influence price.
  • 13.
    6-* Nontariff Barriers: Direct PriceInfluencers Aid and loanstied untiedCustoms valuationOther direct-price influences special fees and requirements Copyright © 2015 Pearson Education Ltd. * In addition to subsidies which help companies be more competitive, other policies that affect price include aid and loans to help companies win contracts, arbitrary customs valuations, and other special fees and requirements that ultimately result in higher priced goods. 6-* Nontariff Barriers: Quantity ControlsQuotaslimit the quantity of a product that can be imported or exported in a given time frame Voluntary export restraint (VER)Embargoes Copyright © 2015 Pearson Education Ltd. * The most common type of nontariff barriers that directly influence the quantity of imports are quotas which limit the quantity of a product that can be exported or imported. Voluntary export restraints and embargoes that prohibit all trade are types of quotas.
  • 14.
    6-* Nontariff Barriers: Quantity Controls“Buylocal” legislationStandards and labelsSpecific permission requirementsimport or export license Administrative delaysReciprocal requirementsCountertrade or offsetsRestrictions on services Copyright © 2015 Pearson Education Ltd. * Other nontariff barriers affecting quantity include “buy local” legislation, special standards and labels, specific permission requirements, administrative delays, and reciprocal requirements. Keep in mind that trade restrictions affect services as well as manufactured and agricultural products. Countries deciding whether to restrict trade in services consider essentiality, not- for-profit-preference, standards, and immigration. 6-* Dealing with Governmental Trade Influencers Learning Objective: Demonstrate the business uncertainties and business opportunities created by governmental trade policies Copyright © 2015 Pearson Education Ltd. * Learning Objective : To demonstrate the business uncertainties and business opportunities created by governmental trade policies.
  • 15.
    6-* Dealing with GovernmentalTrade InfluencersCompanies facing import competition canMove abroadSeek other market nichesCreate greater efficiency or superior products Try to get governmental protection Copyright © 2015 Pearson Education Ltd. * Companies facing losses because of import competition have several options. 6-* Tactics For Dealing With Import CompetitionConvince decision makers of the merits of particular policiesInvolve the industry and stakeholdersPrepare for changes in the competitive environment Copyright © 2015 Pearson Education Ltd. * The tactics for dealing with import competition vary according to industry and business. It’s not always possible, for example, to simply shift production to another location or find new suppliers. The development of an international strategy can help determine whether a company will benefit more from protectionist measures or from some other method of countering foreign competition.
  • 16.
    6-* Dynamics and ComplexityTraderestriction changes bring about winners and losers among countries, companies, and workersGains to consumers from freer trade may come at the expense of companies and workers The international regulatory situation is becoming more complex Copyright © 2015 Pearson Education Ltd. * Looking forward, there is likely to be both support for freer trade, and also support for more protectionism. 6-* All rights reserved. No part of this publication may be reproduced, stored in a retrieval system, or transmitted, in any form or by any means, electronic, mechanical, photocopying, recording, or otherwise, without the prior written permission of the publisher. Printed in the United States of America. Copyright © 2015 Pearson Education Ltd. *
  • 17.
    COUNTRY A Political policiesand legal practices Cultural values, attitudes, and beliefs Economic forces Geographic influences TRADE ENHANCEMENTS TRADE RESTRICTIONS COMPANIES’ COMPETITIVE ENVIRONMENT • • • • COUNTRY B Political policies and legal practices Cultural values, attitudes, and beliefs Economic forces Geographic influences •
  • 18.
    • • • GLOBAL SUPPLY MANAGEMENTFORUM CASE: GS-34 DATE: 9/27/04 (REV’D. 04/07/05) Lyn Denend prepared this case under the supervision of Professor Hau Lee as the basis for class discussion rather than to illustrate either effective or ineffective handling of an administrative situation. Copyright © 2004 by the Board of Trustees of the Leland Stanford Junior University. All rights reserved. To order copies or request permission to reproduce materials, e-mail the Case Writing Office at: [email protected] or write: Case Writing Office, Stanford Graduate School of Business, 518 Memorial Way, Stanford University, Stanford, CA 94305-5015. No part of this publication may be reproduced, stored in a retrieval system, used in a spreadsheet, or transmitted in any form or by any means –– electronic, mechanical, photocopying, recording, or otherwise –– without the permission of the Stanford Graduate
  • 19.
    School of Business. WESTMARINE: DRIVING GROWTH THROUGH SHIPSHAPE SUPPLY CHAIN MANAGEMENT Our goal is to be the best billion dollar boating company every day. —John Edmondson, Chief Executive Officer, West Marine The whole company has culturally undergone a huge shift in terms of recognizing the value of supply chain management to the success of the organization and our ability to grow. —Pat Murphy, Senior Vice President of Logistics, West Marine It was the evening of January 13, 2003 at West Marine’s Watsonville, California headquarters. In the morning, CEO John Edmondson would announce to West Marine’s shareholders, the press, the boating community, and the employees of the two rival companies that West Marine was acquiring BoatU.S.’s retail stores, Internet/catalog business, and wholesale operations. Although the negotiations had gone on for months, only a small handful of individuals within
  • 20.
    West Marine hadbeen involved. BoatU.S.’s founder and CEO had insisted on secrecy, and had changed his mind about the sale more than once during the negotiation process. The two companies had been fierce competitors for years. Edmondson, and his counterpart at BoatU.S., knew the announcement would come as a shock to the loyal employees and customers of both organizations. In the spring of 1996, West Marine had acquired another one of its major competitors: E&B Marine. While the mechanics of the acquisition had gone relatively smoothly, the company quickly discovered that its infrastructure was not strong enough to support an organization that had almost doubled in size overnight. West Marine’s supply chain was especially hard hit, with its systems and processes proving inadequate to keep all 72 West Marine and 63 E&B Marine stores amply stocked. The results had been disastrous. Peak season out-of-stock levels climbed to more than 12 percent and, correspondingly, sales dropped by almost 8 percent within the first year following the transaction. For the exclusive use of A. Bregante, 2018. This document is authorized for use only by Anthony Bregante in SCM 800 Fall 2018 Aggon taught by NORMAN AGGON, The Pennsylvania State University from Aug 2018 to Jan 2019. West Marine: Driving Growth Through Shipshape Supply Chain Management GS-34
  • 21.
    p. 2 Edmondson wasbrought in after the E&B Marine acquisition to execute a company turnaround. For more than four and a half years, he had been focused on rebuilding West Marine. The company installed a new senior management team, invested in new systems and processes throughout the organization, and initiated a major cultural change. Edmondson and his team were proud of West Marine’s recent achievements⎯ particularly in the supply chain arena. Yet, on the eve of the company’s latest acquisition, he wondered whether they had done enough to effectively support another 62 BoatU.S. stores without experiencing the negative repercussions of the E&B Marine acquisition. Edmondson took a deep breath⎯ savoring the “calm before the storm.” West Marine’s course had been set. Now he only needed to launch the journey and hope for smooth sailing. SETTING SAIL: COMPANY BACKGROUND Anchors Aweigh Randy Repass founded West Marine in 1968. Repass worked briefly as a computer engineer in Silicon Valley, but found the high technology industry to be rather cold and impersonal. An avid boater, he sought refuge in his hobby and began selling nylon rope by mail order out of his
  • 22.
    garage. Driven bya desire to improve the way people shopped for boating supplies (and his personal dissatisfaction with service at his local boating store), Repass next opened a small boating outlet in Palo Alto, California in 1975. The store sold rope, as well as other miscellaneous boating supplies and accessories. Most importantly, it was dedicated to providing knowledgeable, friendly customer service to the boating community⎯ a company of boaters helping fellow boaters. As the organization’s customer base grew, so did its business model. Repass began acquiring and opening boating supply stores along the West Coast. He also gradually expanded the company’s product line to include anchor and dock equipment, boat hardware, maintenance and safety products, electronics, boating apparel, water sports equipment, fishing supplies, and more (see Exhibit 1 for illustrative store and product photos). In 1978, West Marine founded its port supply business and began selling products to boat yards, boat dealers, and other wholesale customers. By 1987, the company had 15 stores. That same year, West Marine began producing its first catalog. In 1991, the company opened its first stores on the East Coast. In 1993, West Marine went public under the Nasdaq symbol WMAR (see Exhibit 2 for a more complete timeline of company milestones). Making Headway in 2002 By late 2002, West Marine had become the largest boating supply retail chain in the nation, with
  • 23.
    operations in theU.S., Canada, and Puerto Rico, approximately 5,000 peak season employees, and annual sales of approximately $530 million. In total, West Marine offered more than 50,000 products through its stores, Web site, and catalog, including an extensive collection of private- label goods. For the exclusive use of A. Bregante, 2018. This document is authorized for use only by Anthony Bregante in SCM 800 Fall 2018 Aggon taught by NORMAN AGGON, The Pennsylvania State University from Aug 2018 to Jan 2019. West Marine: Driving Growth Through Shipshape Supply Chain Management GS-34 p. 3 Channels The company had more than 250 stores, with retail operation accounting for approximately 82 percent of its business. West Marine had three primary types of stores. Most standard stores averaged 8,000 square feet, carried 8,000 to 10,000 stock keeping units (SKUs), and generated roughly $1.5 million in sales per year. The company also had a growing number of express stores that averaged 2,800 square feet, carried 2,500 SKUs, and generated $600,000 to $800,000 in annual sales. In its continued pursuit of growth, West Marine had recently begun experimenting with a third store format⎯ the megastore. These
  • 24.
    outlets were locatedin large markets (like Fort Lauderdale), ranged from 24,000 to 30,000 square feet, carried 30,000 SKUs, and were expected to generate $10 to $15 million per year. Megastores were intended to be “destination stores,” featuring interactive displays, boater education, and an unparalleled in- house selection. The remaining 18 percent of West Marine’s business was generated via Internet and catalog orders, as well as sales to commercial customers. West Marine’s catalog was more than 1,000 pages, making it the most extensive in the industry. It offered retail and wholesale customers access to 35,000 of the company’s SKUs, featured full color photographs of the most popular products, and reached more than 1 million boaters a year. The company’s online store included all 50,000 SKUs, but mirrored the catalog to provide customers with a consistent experience across channels. Similarly, West Marine operated a call center that provided real-time customer support for catalog, Web, and in-store interactions. Like West Marine’s associates in the stores, call center representatives were known for having a depth of specialized boating experience and a strong commitment to customer satisfaction. Because they received a high level of service and a similar buying experience regardless of the channel, West Marine’s customers tended to shop freely between the stores, the Internet, and the catalog. For example, some customers relied on the stores for last minute purchases and to acquire products they wanted to “touch and feel.” However,
  • 25.
    they would usethe Web or catalog to research, compare, and buy products when they had more lead-time, or to take advantage of special offers. “Our most profitable customers shop in all three channels,” explained Tony Gasparich, VP of direct sales. “We broke down the barriers between catalog, Internet, and our stores so that our customers can shop wherever, and whenever it’s most convenient for them.” 1 Customers West Marine had a strong base of both wholesale and retail customers. The port supply (or wholesale) division accounted for approximately 9 percent of the company’s sales. Typical wholesale customers included boat yards, boat dealers, and even some small-scale competitors (e.g., “mom and pop” marine supply stores). In total, West Marine had 33,000 wholesale customers who shopped at its stores (using a wholesale signer’s card) or ordered via catalog and Web. A team of 40 direct sales people and 10 inside sales representatives also served the company’s larger wholesale accounts, advising them on the best products for their needs and nurturing these relationships. “We try to help them do their jobs better,” explained Chris Bolling, West Marine’s VP of port supply. 1 All quotations attributed to representatives from West Marine were collected by the author via personal interviews, unless otherwise noted.
  • 26.
    For the exclusiveuse of A. Bregante, 2018. This document is authorized for use only by Anthony Bregante in SCM 800 Fall 2018 Aggon taught by NORMAN AGGON, The Pennsylvania State University from Aug 2018 to Jan 2019. West Marine: Driving Growth Through Shipshape Supply Chain Management GS-34 p. 4 On the retail side, West Marine’s customers fell into three primary categories: sailors (30 percent), large power boaters (40 percent), and trailer boaters (30 percent). The average West Marine customer tended to be male, college educated, 39 to 55 years old, married with children, and in the top 10 percent of wage earners in the U.S. The company amassed considerable knowledge about its customers through the implementation of loyalty programs that offered discounts to shoppers (among other benefits) in exchange for their membership information. Loyalty program members accounted for more than 70 percent of all West Marine sales. As Tom Carey, the company’s senior VP of marketing put it, “This level of participation is off-the- charts for most retailers. It gives us a huge advantage in looking at what our customers are doing, understanding what they think, and modeling their purchasing behaviors.” West Marine also used this customer data, along with boat
  • 27.
    ownership and geographic information,to customize its marketing efforts. Rather than blanketing the nation with a single one-size-fits-all version of a promotional mailing, the company created different versions of its fliers for warm and cold weather climates, and for each of its primary customer segments (for a total of six targeted mailings for each promotion). The promotional fliers were created approximately twice per month, and had a circulation eight times greater than the largest independent boating publication. As a result, West Marine’s vendors were eager to be spotlighted within the mailers, and would frequently pay the company to be included, as though they were buying ad space in a magazine. Industry Position In 2002, the boating supply market accounted for approximately $6 billion of the total $25.6 billion boating industry.2 While general industry performance was relatively strong, RBC Capital Market estimated that the boating supply sector was declining three to five percent per year.3 At the time, there were more than 5,000 retailers in the boating aftermarket. However, West Marine was one of only three major national boating supply companies.4 West Marine, BoatU.S., and Boater’s World controlled just 10 percent of the total market, with local, independent retailers accounting for the remainder of total sales.5 Like the rest of the industry, West Marine’s stores were concentrated in the three primary U.S. boating markets⎯ the West Coast, the Northeast, and the Southeast. Despite its West Coast roots, 68 percent of the
  • 28.
    company’s business waslocated in the two major eastern regions where industry growth rates were slightly better and higher population densities enabled the company to achieve greater operational efficiencies6 (see Exhibit 3 for highlights from a 2002 analyst report). The boating aftermarket was considered a specialty retail market. Outside of its immediate peer group, West Marine benchmarked itself against companies like Brookstone, Cost Plus, Autozone, and other high performing, small cap retailers. While West Marine performed competitively against these companies, it had lower sales per square foot and fewer inventory turns than many other specialty retailers.7 This was due, in part, to the extreme seasonality of West Marine’s business. Over 60 percent of the company’s total sales typically occurred 2 Carole Buyers, “West Marine Inc.: The Clear Leader in a Fragmented Industry,” RBC Capital Markets, October 15, 2002, p. 3. 3 Ibid. 4 Ibid, p. 5. 5 Ibid. 6 Ibid., p. 8. 7 Ibid., p. 9. For the exclusive use of A. Bregante, 2018. This document is authorized for use only by Anthony Bregante in SCM 800 Fall 2018 Aggon taught by NORMAN AGGON, The Pennsylvania State University from Aug 2018 to Jan 2019.
  • 29.
    West Marine: DrivingGrowth Through Shipshape Supply Chain Management GS-34 p. 5 between the months of April and September, with stores in most areas remaining largely unproductive during the winter season. In addition, West Marine’s service philosophy contributed to these challenges. The company’s goal of having “what the customer needs, when the customer needs it” meant that the average West Marine store carried a significant portion of products with relatively low sales velocities. In fact, the company estimated that 20 percent of its in-store items accounted for roughly 80 percent of its sales. The rationale for this approach was that boaters had to be able to stop by a West Marine store on their way to their boats and be able to find whatever they needed to spend the day on the water. If the stores did not have the right products on hand, then their customers would potentially lose a day of boating (not to mention their faith in West Marine’s ability to act as a one- stop-shop for all of their boating needs). Fortunately, RBC Capital Markets estimated that the relatively low investment cost of a West Marine store and its high contribution margin helped offset its lower inventory turns relative to other specialty retailers.8 While West Marine had led a trend toward consolidation in the retail boating supply industry, the
  • 30.
    industry’s manufacturers anddealers remained highly fragmented. Many suppliers were small organizations with insufficient capital and infrastructure to support growing, organized retailers such as West Marine. West Marine’s market research indicated that, among other factors, supply chain failures and the corresponding declines in consumer satisfaction were causing boaters to leave the sport, as well as deterring new entrants. Into Rough Waters⎯ The E&B Marine Acquisition Prior to its acquisition by West Marine, E&B Marine’s 63 retail stores and its small catalog operation provided another source of competition to the company. With approximately $100 M in annual sales, E&B was one of West Marine’s oldest competitors. However, while the two companies had a healthy rivalry, their core customer bases were different. In 1996, West Marine was focused first and foremost on the sailing community. E&B Marine, on the other hand, catered to a power boating clientele that was more price sensitive and value driven than a typical West Marine customer. West Marine was attracted to E&B as an acquisition target because it would enable the company to rapidly increase its penetration of the powerboat segment. In addition, because E&B had recently fallen on hard financial times, the seller was highly motivated to strike a deal. In June 1996, the acquisition occurred. Following the transaction, West Marine discovered that internal E&B operations were in worse condition than expected. The investment group that had been
  • 31.
    running E&B hadlet the company’s infrastructure deteriorate and inventories dwindle. The West Marine team had a project plan with thousands of action items for executing the acquisition and addressing some of these challenges. Yet even the basic systems integration between the two organizations took six months to complete. Gasparich recalled, “We got mired down in the minutia and lost track of some of the core strategic issues.” As Bruce Edwards, West Marine’s senior VP of store operations put it, “We also went into the E&B acquisition fairly naïve about the impact of a 63-store chain being assumed by a 72-store operation.” Pressures behind the scenes within the newly combined organization led to stock- 8 Ibid. For the exclusive use of A. Bregante, 2018. This document is authorized for use only by Anthony Bregante in SCM 800 Fall 2018 Aggon taught by NORMAN AGGON, The Pennsylvania State University from Aug 2018 to Jan 2019. West Marine: Driving Growth Through Shipshape Supply Chain Management GS-34 p. 6 outs in the stores. West Marine and E&B customers were
  • 32.
    frustrated by notbeing able to find what they needed, when they needed it. To make matters worse, West Marine impulsively began to pull down E&B’s signs and started converting their stores to the West Marine brand, assortment, and pricing. Edmondson (who was not CEO at the time) reflected that, “West Marine bought E&B because it was different and unique. Then, they turned all the stores into West Marine stores and locked out the customer base.” Edwards added, “We created a lot of damage to both chains,” as well as losing ground on comparable sales as a combined organization. West Marine’s management team was also beginning to falter under the stress of such rapid growth. Repass had always boasted that, at West Marine, team members were “boaters first and business men second.”9 Unfortunately, this meant that some members of the senior management team increasingly lacked the experience needed to diagnose and correct the company’s core problems. Rich Everett, the company’s COO recalled, “We’d try different things, they wouldn’t work, so we’d go down a different road. Internally, it was chaos.” By 1998, West Marine’s challenges started to show from the outside. Earnings dropped to six cents per share⎯ off 80 cents from the decade’s high in 1997. Further, after at least six years of steady growth, net income dropped from $15.2 million in 1997 to $1.1 million in 1998.10 According to the analysts, “It became apparent that West Marine had over-expanded.”11
  • 33.
    BATTENING DOWN THEHATCHES: THE WEST MARINE TURNAROUND Before the end of that year, West Marine’s board of directors (led by Repass, the board’s chairman) persuaded retail industry veteran Edmondson to join the company as its new CEO. His immediate charge was to generate cash quickly. However, the board also expected him to put the company back on an even footing. To accomplish this, Edmondson focused on four specific areas: (1) leadership, (2) strategy, (3) people and culture, and (4) systems and processes. Leadership⎯ The Captain Selects His Crew Edmondson recognized immediately that he needed more experience in his management team. West Marine’s boaters in businessmen’s roles had done a worthy job of bringing the company to the $500 million mark. Yet, to resolve the company’s challenges and become a $1 billion business, Edmondson wanted people who had “been there, done that” in larger, more complex retail organizations. Everett recalled, “John changed out almost all the key players in areas where the business was failing” (see Exhibit 4 for a high level view of West Marine’s executive organization). Ken Corwin was brought in to lead the merchandising team. Pat Murphy came in to manage logistics and distribution. David Schenk took on information systems. Larry Smith filled a new position focused on supply chain planning and replenishment.
  • 34.
    All of theseexecutives had deep experience in their respective areas, working in multibillion dollar companies. For example, Pat Murphy joined West Marine from Borders Books where he managed five distributions centers, 9 See West Marine’s Web site at www.westmarine.com under the Company History section. 10 Mike de Give, “West Marine Products Charts a Steady Course,” Santa Cruz Sentinel, July 18, 2001. 11 Buyers, op. cit., p. 6. For the exclusive use of A. Bregante, 2018. This document is authorized for use only by Anthony Bregante in SCM 800 Fall 2018 Aggon taught by NORMAN AGGON, The Pennsylvania State University from Aug 2018 to Jan 2019. West Marine: Driving Growth Through Shipshape Supply Chain Management GS-34 p. 7 each twice as big as West Marine’s largest DC. Among other positions, Larry Smith formerly headed the supply chain planning team for Kmart’s $8 billion apparel business (see Exhibit 5 for selected West Marine team biographies). Strategy⎯ New Navigation Rules Upon joining West Marine, each executive was given the general mandate to turn around his
  • 35.
    respective function. However,to keep individual actions aligned across the organization, Edmondson enlisted the team’s assistance in defining a new company strategy. Through an extensive, collaborative planning process, the leadership team developed a five-year plan (which would be updated on an annual basis). The strategic plan started with West Marine’s vision of being the best boating products company every day. It then outlined a series of specific financial goals (company-wide performance indicators), that included ROE, cash flow, comp sales, EPS, product service levels, market share, customer satisfaction, and associate satisfaction. Next, the plan outlined six critical success factors that would enable West Marine to achieve its desired financial results and realize its vision (see Exhibit 6 for excerpts from West Marine’s strategic plan). Finally, it went on to detail the specific strengths and weaknesses of the organization, and the select initiatives upon which the company would focus in the coming year. As a result of the strategic planning process, every leader at West Marine understood the company’s direction and the role he was expected to play in helping the organization realize its goals. Edmondson left it up to the individual leaders to define the specific tactics that would rapidly deliver the required results in their areas. Then, formal reports were put into place (with metrics that cascaded from the enterprise-level performance indicators) to regularly measure the company’s progress and hold every manager accountable for his actions.
  • 36.
    People and Culture⎯All Aboard Edmondson also expected his new management team to help drive a cultural change within West Marine. The company was founded on the idea of providing “better-than-expected customer service.” Yet, as the company began to falter, employees started to interpret this as permission to take care of the customer at any cost. Edmondson recalled, “I remember one example where we spent $1,800 to rush a $200 part to a wholesale customer in Hawaii. The good thing was that we continued to take care of our customers despite our internal challenges. The bad part was that there were no rules. Everybody was running amok.” Another issue that created problems within the organization was a growing sense of protectionism and secrecy within and across departments. The more the company struggled, the less willing its teams were to share information about their issues, challenges, and needs across organizational boundaries. The leadership team addressed these problems head-on. Outside experts in cultural change were brought in to more appropriately direct the passion and energy of the organization. Significant effort was also invested in redefining roles and refocusing employees on their jobs so that, as Edmondson put it, “people would play their positions and work together to more efficiently solve problems.” They also made it clear, to new and old employees alike, that “silo” mentalities within traditional vertical functions would no longer be tolerated. Lines of communication were opened through the initiation of cross-departmental meetings
  • 37.
    and project teams.The For the exclusive use of A. Bregante, 2018. This document is authorized for use only by Anthony Bregante in SCM 800 Fall 2018 Aggon taught by NORMAN AGGON, The Pennsylvania State University from Aug 2018 to Jan 2019. West Marine: Driving Growth Through Shipshape Supply Chain Management GS-34 p. 8 organization also achieved increased visibility by holding functional areas mutually accountable for meeting shared metrics. Systems and Processes⎯ Regaining an Even Keel Repairing West Marine’s foundation to support its recent (and continued) growth was one of the most important turnaround initiatives facing the new leadership team. Corwin recalled that when he joined West Marine “it was a disorganized, crisis-managed environment. The company had grown so fast, its britches were about to pop. We didn’t have the systems in place, we didn’t have the structure, and we didn’t have the discipline.” To address these problems, Edmondson said, “We began attacking every process. We literally reviewed tens of thousands of processes and reinvented all of our systems to figure out how we could take ongoing SG&A out of the
  • 38.
    business at thesame time that we started operating more effectively.” CHARTING A NEW COURSE: SUPPLY CHAIN COLLABORATION Process and system changes would occur throughout the organization, but particular emphasis was placed on transforming the company’s supply chain management practices.12 “Our supply chain was complex, difficult, and broken,” Edmondson remembered, “So I saw major cost opportunities. But, there were also significant opportunities for improvements in sales and customer service.” Even though instock rates reached an all- time low following the E&B Marine acquisition, the company remained passionate about having on hand whatever products its customers needed. Corwin, Smith, Murphy, and Schenk would have to work together to completely recreate the company’s systems and processes in this area. All four executives were up for the challenge, and they were committed to transforming West Marine’s supply chain from a liability into a competitive advantage. Fighting the Current⎯ West Marine’s Supply Chain Challenges Even before the E&B Marine acquisition, West Marine’s supply chain was more complex than the supply chains of most specialty retailers. The company had an enormous number of SKUs to manage. It also had extraordinarily complicated inventory requirements that were necessitated by the seasonal nature of its business⎯ every spring West Marine expanded the amount of
  • 39.
    inventory in itsstores and DCs by 20 to 30 percent to prepare for peak season. Given the wide variety of products offered by West Marine, the company also had almost 1,000 vendors to manage in 2003. Each vendor differed in the number and types of products it supplied, its level of sophistication, the capabilities of its supporting infrastructure, and its responsiveness to West Marine’s needs. Some were mom-and-pop suppliers that struggled to keep up with West Marine’s orders. Others were marine divisions within large organizations (like 3M Marine) that recognized West Marine’s importance as a customer, but faced product delays and other barriers because of cross-divisional management challenges (these divisions were often smaller off- shoots of a company’s main business and were, accordingly, treated like “second-class” departments within their own organizations). To complicate the supply chain further, West 12 The term supply chain refers to the trading partners and processes involved in acquiring materials, producing goods, and distributing them into the marketplace to satisfy customer demand. The goal of supply chain management is to get all parties involved in the supply chain – including retailers, wholesalers, distributors, transporters, and manufacturers – working together to get the right products, distributed in the right quantities, to the right locations, at the right time. For the exclusive use of A. Bregante, 2018. This document is authorized for use only by Anthony Bregante
  • 40.
    in SCM 800Fall 2018 Aggon taught by NORMAN AGGON, The Pennsylvania State University from Aug 2018 to Jan 2019. West Marine: Driving Growth Through Shipshape Supply Chain Management GS-34 p. 9 Marine’s promotions came into play, with advertising decisions having a tremendous impact on the volume and timing of products needed in the stores. At the Home Office Prior to the turnaround, all supply chain planning and replenishment activities were disconnected and poorly coordinated within the merchandising team. Forecasts were created, but they were widely considered to be inaccurate, inconsistently shared with suppliers, and rarely used for significant planning purposes. Replenishment processes were somewhat rudimentary and allowed for a disproportionate number of exceptions from the stores (which many considered to be “cowboy” behavior rather than sound supply chain input). In addition, representatives from merchandising infrequently considered the supply chain implications of their actions when they agreed to special deal-buys with vendors. Instead, the effects of these decisions were typically felt after the fact, when rush purchase orders were requested or products unexpectedly arrived at the DCs and had to be received, managed, and reconciled with in-process replenishment
  • 41.
    activities. Two-way communication andcollaboration with suppliers was also substandard. In the absence of other information, vendors tended to operate on a purchase- order-to-purchase-order basis. For example, suppliers would be given advance notice when West Marine intended to add one of their products to its assortments, yet they frequently did not know what quantity would be required until a purchase order was delivered. As a result, West Marine was plagued by late shipments, which negatively impacted instock rates in the stores. Even more importantly, late shipments frequently interfered with the availability of products featured in key promotions. Both problems contributed to lost sales and decreased customer satisfaction. West Marine struggled further with a rash of partial shipments from vendors. Every purchase order that was filled in two or three deliveries required two or three times the manpower to process, receive, and redistribute to the stores. Partial shipments were a key contributor to West Marine’s supply chain costs, which had spiraled out of control. Few individuals within the organization understood the inefficiencies that were driving these cost increases, and the West Marine team was stuck in the mode of fighting supply chain fires, not solving their underlying problems. The E&B Marine acquisition further compounded central supply chain challenges by adding more stores, new SKUs, and different assortments that had to be
  • 42.
    managed. The combined vendorpopulation reached 1,400 at its peak, and communication with legacy E&B Marine suppliers was no more productive than it was at West Marine. From a systems perspective, West Marine had relatively advanced supply chain management software in place. However, as Everett put it, “We had the Ferrari of supply chain management software, but we only had people who knew how to drive Ford trucks. They took everything down to the lowest common denominator and tried to make it work.” Data integrity between the DCs and the stores was also a major problem because they utilized two separate back-end databases that were not effectively interfaced. Even after the E&B Marine systems and data had been integrated with West Marine’s, it was nearly impossible to get an accurate, end-to- end understanding of supply chain performance from the enabling information systems. For the exclusive use of A. Bregante, 2018. This document is authorized for use only by Anthony Bregante in SCM 800 Fall 2018 Aggon taught by NORMAN AGGON, The Pennsylvania State University from Aug 2018 to Jan 2019. West Marine: Driving Growth Through Shipshape Supply Chain Management GS-34 p. 10 In the Distribution Centers
  • 43.
    In the mid1990s, West Marine was outgrowing its 70,000 square foot DC in Charlotte, North Carolina. Accordingly, the company decided to invest in a new 500,000 square foot facility in Rock Hill, South Carolina (which would take several years to build). While there were multiple delays in construction, the facility was nearing completion just as West Marine entered into the E&B Marine acquisition. The company shifted operations from Charlotte to Rock Hill, anticipating a relatively smooth transition since many of the employees from Charlotte agreed to commute to Rock Hill (which was just 15 miles away from the original facility). However, the transition from a small, mostly manual operation to a warehouse that was more than seven times as large and highly automated (e.g., with an advanced network of conveyors) proved to have many unanticipated challenges. Employees needed different skill sets, more experience, and more extensive training. Within the same timeframe, sales in the stores were surging. Orders for products were placed at full speed and vendors made high volumes of shipments in return. In Rock Hill, deliveries quickly began to back up on the receiving docks. The DC team could not receive and process them fast enough in the new facility to keep up with the inbound freight. Cartons and containers piled up. Merchandise was misplaced. Outbound shipments to stores were delayed, which further compounded instock problems. As Edwards recalled, “Our supply chain was crippled. Out-of-stocks in the stores reached upward of 25 percent for most of peak season.”
  • 44.
    Within the firstyear following the E&B Marine acquisition, West Marine had always intended to close the rather poorly run E&B warehouse in Edison, New Jersey to help reduce overall logistics costs. However, the timing for the closure could not have been worse. Rock Hill, with its vast capacity, was expected to absorb the inbound and outbound traffic from Edison (which meant that its volume nearly doubled). Despite the bottlenecks, it made little sense from a time or cost perspective to involve West Marine’s only other DC in resolving the problems since it was located on the West Coast. Operations in Rock Hill were forced to stumble forward. In response to its mounting problems, the Rock Hill team started working harder and longer each day. “At one point, there was a 10-hour rule,” explained Murphy who inherited this problem upon joining West Marine. “Our employees could go home for 10 hours to sleep and eat, then we needed them back on the job.” The shipping dock operated 24 hours a day in an effort to get needed products to the stores. Warehouse costs mushroomed, and employee turnover skyrocketed. Murphy estimated, “In 1999, we probably hired 1,200 people over the course of the year to keep 280 peak season jobs filled.” Something had to change. A Port in the Storm⎯ Supply Chain Improvements Given the extent of its supply chain challenges, West Marine recognized that it needed long- term, holistic solutions that would require a significant
  • 45.
    investment of timeand resources. The leadership team put a halt to all store expansion to relieve some of the immediate pressure on the supply chain, and to enable the management team to focus all of its energy on identifying and fixing its underlying supply chain problems. Critical importance was placed on improving end- to-end supply chain visibility and effectiveness, driving down related costs, and improving the level of supply chain collaboration within and outside West Marine. Through increased collaboration, the company hoped to transition out of its reactionary mode of fighting perpetual For the exclusive use of A. Bregante, 2018. This document is authorized for use only by Anthony Bregante in SCM 800 Fall 2018 Aggon taught by NORMAN AGGON, The Pennsylvania State University from Aug 2018 to Jan 2019. West Marine: Driving Growth Through Shipshape Supply Chain Management GS-34 p. 11 supply chain related fires, and begin to more proactively anticipate and prevent issues from arising. Smith, who was active in a number of industry associations and supply chain organizations, had recently begun hearing about a process called collaborative planning, forecasting, and
  • 46.
    replenishment. Recognizing thatmany of West Marine’s problems were related to inadequate, ineffective, or isolated planning, forecasting, and replenishment activities, he started to investigate the approach on the company’s behalf. Defining CPFR® Thought leaders in supply chain management had long recognized the fact that companies frequently struggled to keep their internal constituencies aligned in effectively managing the flow of materials or goods into, through, and out of the enterprise. Yet, there was also a growing consensus that coordinating the supply chain within the boundaries of a single organization was not enough. Companies had to partner with extended networks of manufacturers, suppliers, distributors, and/or retailers to optimize performance all the way from the time a customer placed an order through the time that order was fulfilled. Wal-Mart was one of the first pioneers to embrace the counterintuitive notion of sharing proprietary supply chain related data outside the boundaries of its internal organization when it launched a co-managed inventory pilot with Warner-Lambert in 1995. When the company realized some success from its initial efforts, Wal-Mart asked the Voluntary Interindustry Commerce Standards (VICS) association to study and develop a forward-looking process to promote more productive supply chain management throughout the retail industry.13 The new process, published in 1998, was called collaborative planning, forecasting, and replenishment (CPFR®).
  • 47.
    CPFR® formally combinedand capitalized on the intelligence of multiple trading partners in the planning and fulfillment of customer demand.14 At the heart of CPFR® was the development of a single, shared forecast that supported the joint plans of trading partners in the supply chain and drove their mutual replenishment activities. It also provided a framework within which exceptions could be systematically identified and addressed. Clear performance measures were defined to document operational performance expectations. Risk was monetized so that partners faced clear financial consequences when agreements were not met. Incentives were used to motivate collaborative, cooperative behavior and to share the benefits as waste was eliminated from the supply chain and desired results were achieved (see Exhibit 7 for the complete VICS process model). Much of the value of CPFR® resulted from the exchange of more timely, complete, and realistic forecast data, which led to higher forecasting accuracy rather than more sophisticated forecasting algorithms.15 CPFR® also linked best practices for sales and marketing (like category 13 RetailSystemsAlert Group, “A History of CPFR,” http://www.retailsystems.com/IndustryEvents/Index.cfm?PageN ame=CPFROHistory (May 5, 2004). 14 Voluntary Interindustry Commerce Standards Association, “CPFR: An Overview,” May 18, 2004, http://www.cpfr.org (July
  • 48.
    12, 2004). 15 VoluntaryInterindustry Commerce Standards Association, “CPFR Voluntary Guidelines: Nine Step Process Model,” June 2002, http://www.cpfr.org (May 5, 2004). For the exclusive use of A. Bregante, 2018. This document is authorized for use only by Anthony Bregante in SCM 800 Fall 2018 Aggon taught by NORMAN AGGON, The Pennsylvania State University from Aug 2018 to Jan 2019. West Marine: Driving Growth Through Shipshape Supply Chain Management GS-34 p. 12 management) to supply chain operations to improve instock availability, reduce inventory, and decrease logistics and transportation costs16. It also helped eliminate constraints that had traditionally limited supply chain efficiency. For example: Most sellers hold finished goods inventory in sufficient quantities to meet customer demand. Manufacturing capacity is not used because buyers’ normally short order-cycle times are inconsistent with longer manufacturing cycle times. By extending the buyer order cycle and thus making it consistent with the manufacturing cycle, production could move to a “make-to-
  • 49.
    demand” process for someproducts. This removes the need to hold a significant amount of finished good inventory in the value chain and improves customer service, which produces dramatic benefits.17 Despite the promise of potentially dramatic results, the widespread adoption of CPFR® had been gradual, with companies in the consumer packaged good industry acting as the primary pathfinders. In the late 1990s, some organizations were still hesitant to initiate CPFR® programs because they suspected that the potential benefits had been exaggerated. Others had recently reengineered their supply chains and felt uncertain whether enough additional waste could be eliminated to justify the investment in CPFR®. Still others chose to allocate their limited funds and resources to other e-business initiatives.18 Preparing for CPFR® at West Marine From his initial interview with the company, Smith was encouraged by the willingness among the West Marine management team to believe that replenishment forecasting could be accurate enough to help drive the company’s core business decisions and processes. If West Marine could achieve a more holistic view of all inventory activity within the company, and collaboratively share the benefits of this information with its supply chain partners, it could realize significant benefits. Convinced that CPFR® would help the company repair its supply chain and achieve these desired results, the West Marine
  • 50.
    management team committeditself to implementing the approach. While CPFR® defined at a high level how trading partners should work together to plan, forecast, and manage replenishment, it did not dictate who fundamentally owned the process. Instead, different options enabled companies to make this determination based on the competencies, resources, and systems of the involved parties.19 Importantly, the retailer and the manufacturer would both have input into all stages of the process. However, a single entity would ultimately take ownership for their execution. Option A was considered conventional order management, with the retailer driving the forecast, order planning, and order generation. Option B, called supplier-managed inventory, put the retailer in charge of the forecast, but the manufacturer in charge of order planning and buying. In Option C, co-managed inventory, the retailer developed the forecasts and planned the orders, but the manufacturer generated the 16 Voluntary Interindustry Commerce Standards Association, “CPFR: An Overview,” op. cit. 17 Voluntary Interindustry Commerce Standards Association, “CPFR Voluntary Guidelines: Nine Step Process Model,” op. cit. 18 Tom Harwick, “Collaborative Planning, Forecasting, and Replenishment Will Take Off in Next Two Years,” Forrester Research, June 7, 2001, http://www.forrester.com/Research/LegacyIT/0,7208,24863,00.h tml (May 5, 2004).
  • 51.
    19 Voluntary InterindustryCommerce Standards Association, “CPFR Voluntary Guidelines: Nine Step Process Model ,” op. cit. For the exclusive use of A. Bregante, 2018. This document is authorized for use only by Anthony Bregante in SCM 800 Fall 2018 Aggon taught by NORMAN AGGON, The Pennsylvania State University from Aug 2018 to Jan 2019. West Marine: Driving Growth Through Shipshape Supply Chain Management GS-34 p. 13 orders. Finally, in Option D, the manufacturer was responsible for all three activities as in vendor-managed inventory programs (see Exhibit 7 for an overview of these four role options). “The key reason for West Marine to focus on the retailer-driven approach,” explained Smith, “is that the buyer usually drives the key events that crack the ‘bullwhip’ in the supply chain (for example, promotions and assortment changes). The buyer- driven forecast also depends on only one technological platform, so it is scalable across many items and suppliers with similarly accurate results.” Accordingly, the company decided that it would support Option A, where the retailer (or buyer) acts as the supply chain hub. However, before West Marine could begin creating more
  • 52.
    accurate forecasts thatcould be shared with suppliers as part of its new CPFR® initiative, the company had some important information systems changes to make. At the heart of West Marine’s supply chain systems was JDA’s Merchandise Management System (MMS)⎯ a robust platform that the company could build upon. The MMS was interfaced with the company’s point-of- sale system in the stores (also provided by JDA) to keep track of basic inventory levels and product sales at the store level. West Marine also used JDA’s Warehouse Management System (WMS) as the software engine for its distribution center (DC) operations. West Marine also had advanced replenishment and forecasting tools: JDA’s Advanced Store Replenishment (ASR) and Advanced Warehouse Replenishment (AWR). The problem was that both systems required intensive and duplicative maintenance and management to work well. The two systems were totally disconnected⎯ none of the work in one system could be directly leveraged by the other. Store replenishment planning focused on historical customer sales. Warehouse replenishment planning focused on historical distribution center shipments, which had no reference to current store forecasts, overstocks, understocks, assortment changes, store- DC servicing changes, or new store additions. If replenishment management and maintenance could be integrated and then limited to the key drivers of customer sales, replenishment associates could invest more time and effort in working with suppliers to improve on-time and accurate delivery of
  • 53.
    goods, and spendless time and effort executing work-arounds necessitated by suboptimal West Marine systems. The key drivers to customer sales forecasts were base annual forecasts, seasonal selling curves or “profiles,” ranking or service levels for items by importance to the business, promotions, and assortment changes. In West Marine’s business model, sales from nonstocking locations were also a significant driver. Items that could be obtained for a customer from a stocking DC, but not carried in a store, accounted for approximately 10 percent of all store sales. In fact, in certain product categories, nonstocking sales actually accounted for the majority of item sales. While many companies, particularly in the retail sector, wanted and needed multi-echelon solutions that linked and aggregated store and warehouse forecasting and replenishment, few had effectively achieved them. At the time, no leading software vendors offered such a solution out- of-the-box. JDA was working on a solution, and Smith discussed codevelopment options with the software provider. However, in the end, West Marine elected to develop a custom integration solution to link its store and DC level replenishment platforms. The challenge was left to Smith, Schenk, and their respective teams to develop the in-house solution, although their For the exclusive use of A. Bregante, 2018. This document is authorized for use only by Anthony Bregante in SCM 800 Fall 2018 Aggon taught by NORMAN AGGON, The Pennsylvania State University from Aug 2018 to Jan 2019.
  • 54.
    West Marine: DrivingGrowth Through Shipshape Supply Chain Management GS-34 p. 14 efforts were aided by the efforts of a San Francisco-based system engineer and integrator, Matt Henderson of Amigo, Inc. Ultimately, West Marine implemented a successful, robust linkage between the point-of-sale and DC systems that maximized automation and mass-maintenance procedures, and gave West Marine one of the first true multi- echelon replenishment solutions in the retail sector. In accomplishing its multi-echelon solution, West Marine created new user interfaces that enhanced the user’s view of how products performed across the network. The company addressed the challenge of accomplishing accurate seasonal profiling by implementing JDA’s Intellect seasonal profiling package. West Marine also installed JDA’s Advanced Planning package, populating it with all its replenishment forecasting information. This provided flexible perspectives on how key business elements performed, while constituting what Smith called an “automatic” open-to-buy policy, because replenishment forecasts determine future inventory requirements (see Exhibit 8 for a visual overview of all West Marine supply chain related information systems).
  • 55.
    Electronic data interchange(EDI) was another important aspect of West Marine’s supply chain infrastructure improvements. The purpose of EDI was to standardize the electronic transfer of structured information between trading partners to increase productivity, reduce human error, and drive down costs. Documents like purchase orders, invoices, and shipment notifications were exchanged in a systematic manner that improved advanced visibility and promoted better communication between companies. West Marine implemented EDI using an SPS Commerce solution. The company then worked with the National Marine Manufacturers Association (NMMA) to establish this as the EDI standard in the marine industry with the hope of more rapidly stimulating its adoption. Next, West Marine went out to its suppliers and directly requested that they begin using EDI. As more and more suppliers came online, West Marine primarily benefited from the increased visibility to its inbound inventory liability and supplier shipping performance through the EDI advance shipment notices, which provided the company discrete shipment information from the time shipments left suppliers’ shipping docks. Concurrent with these systems changes, West Marine launched a significant data clean-up effort. Evaluating one SKU at a time, West Marine employees eliminated discrepancies in shipping multiples, case pack quantities, and other critical data fields that would reduce internal errors and minimize supply chain inefficiencies. For example, a legacy store level replenishment setting
  • 56.
    might have triggeredthe need for “four” paint brushes to be sent to that store (with the store expecting to receive four individual units). However, if the DC level setting for the ship multiple did not match, the DC might instead send out four cases of paint brushes⎯ significantly more inventory than the store could hold or use. The planning and replenishment team and the logistics team also worked together to create new business rules that dictated who could modify specific data fields (and under what conditions) to help avoid future discrepancies and unanticipated changes. With its new tools, West Marine was able to begin creating accurate 52-week forecasts of supplier orders for all of its products with a minimum of manual intervention. Historical sales data was used to generate the baseline forecast, which was then systematically made richer by taking into account seasonal (geographic based) profiles, product rank (based on anticipated For the exclusive use of A. Bregante, 2018. This document is authorized for use only by Anthony Bregante in SCM 800 Fall 2018 Aggon taught by NORMAN AGGON, The Pennsylvania State University from Aug 2018 to Jan 2019. West Marine: Driving Growth Through Shipshape Supply Chain Management GS-34 p. 15
  • 57.
    sales volume andgross margin), and scheduled promotions (fliers, special displays in the stores, and other promotional activities). These forecasts were updated every 24-hours, based on the previous day’s sales so that the company always had an up-to- date forecast of what needed to be ordered. According to Schenk, “A lot of retail CIOs are taught to do a store level inventory replenishment forecast once a week and feel good about it. We do it daily. Every day. Timeliness is a significant component of accuracy. That’s why we have such confidence in our forecasts.” To support this new forecasting and replenishment approach, West Marine also had to get its own employees working together more effectively. In the home office, Corwin and Smith agreed to implement a category management approach that would drive employees in the merchandising and planning and replenishment departments to perform as an integrated unit. They divided all of West Marine’s products into 24 distinct product clusters (e.g., electronics, maintenance, deck hardware) and assigned a category manager and an assistant category manager from the merchandising group to each one. In addition, a merchandise planner and a replenishment analyst were assigned from the planning and replenishment department. These four individuals were colocated in a team “pod” (an open, team- oriented workspace) and were charged with working together. Importantly, no staff additions were authorized to support the new structure⎯ all positions were filled by reorganizing existing
  • 58.
    headcount as redundant activitieswere eliminated and low-value activities were automated via the new supply chain systems. The category manager and his/her assistant were responsible for choosing the items that the company would stock, assigning a channel (or multiple channels) to each product, negotiating vendor agreements, determining price, margin, and volume goals, developing promotion strategies, and managing the ongoing vendor relationships. The merchandise planner acted as the “supply chain captain,” cutting purchase orders, monitoring shipments and fill rates, resolving problems, and coordinating all aspects of the supply chain from the vendor to the DC. The replenishment analyst worked closely with the merchandise planner, but focused on those aspects of the supply chain related to getting product from the DC to the stores. Specifically, s/he entered and monitored the forecasts, interfaced with the stores to ensure that they got what products they needed (when they needed them), and managed special requests from the stores. The new category teams also worked closely with assortment planning (part of the planning and replenishment department), visual merchandising, and marketing. The assortment planning group helped ensure that each unique store had the right mix of products to maximize sales and profitability in its market. The visual merchandising team designed the planograms (which assigned a physical location to every SKU in the store) for each store’s unique assortment. The
  • 59.
    marketing team providedcustomer and market data to these groups, and also coordinated the physical promotions that were agreed to by the category teams. From a supply chain perspective, every promotion had to be included in the forecast no less than 90 days in advance so that the appropriate products (in the appropriate volumes) could be ordered, shipped, received, and incorporated into the physical store design according to the planogram (see Exhibit 9 for a simplified view of how category management, merchandise planning, replenishment analysis, assortment planning, visual merchandising, and marketing all worked together). For the exclusive use of A. Bregante, 2018. This document is authorized for use only by Anthony Bregante in SCM 800 Fall 2018 Aggon taught by NORMAN AGGON, The Pennsylvania State University from Aug 2018 to Jan 2019. West Marine: Driving Growth Through Shipshape Supply Chain Management GS-34 p. 16 The West Marine CPFR® Pilot Once West Marine had implemented the structural, process, and information system changes necessary to make significant internal supply chain improvements, the company was ready to begin collaborating more directly with its suppliers. West Marine’s goal was to more proactively
  • 60.
    consult with itsvendors on shared forecasts and other supply chain issues to further improve fulfillment and sales. To get started, West Marine hand-picked a group of 12 suppliers to be part of its initial pilot. These suppliers tended to be large vendors that were struggling with supply chain issues of some sort (e.g., late or incomplete shipments). The category management teams met with the vendors one-on-one to introduce the CPFR® approach and make plans for its adoption. These sessions were characterized by honest, fairly blunt discussion about West Marine’s desire to have the best supply chain in its class. Specific goals and expected performance levels were clearly spelled out. Vendors were asked directly to commit to these goals, although the company chose not to require formal, written agreements. No specific investments in technology were required from the vendors, but West Marine did expect them to designate resources within their organizations to act as the counterparts to West Marine’s supply chain captains (the merchandise planners). For some suppliers, this investment was considered minimal to keep a sizable customer like West Marine satisfied. For others, it represented a potential financial hardship. Most suppliers were willing to participate. For those who resisted or declined, West Marine made no secret of the fact that it might re-evaluate its relationship with the company following the more widespread implementation of its CPFR® program. With this groundwork laid, West Marine began sharing its
  • 61.
    forecasts with vendorsin the pilot group on a weekly basis. Vendors were also provided with weekly updates on their performance relative to West Marine’s CPFR® goals (see Exhibit 10 for examples of these communications). Cross-functional status meetings were held monthly to review progress and discuss potential improvements. The entire category team participated in these meetings, along with their respective counterparts from the vendor organization, to maintain a holistic, integrated perspective on each vendor relationship. Between these scheduled meetings, supply chain exceptions and performance issues were directly addressed on an as-needed basis. West Marine’s CPFR® pilot quickly built momentum through the introduction of quarterly Supply Chain Summits⎯ three-day working sessions in which the company could get as many as 28 vendors up to speed and into the CPFR® program at a time. By the end of 2002, the company was actively collaborating with its top 150 vendors, and it also had more than 350 EDI partners (representing 90 percent of the company’s supplier spend). Through the more open exchange of information, standardized processes, and improved systems, West Marine began to realize select significant results (see Exhibit 11 for illustrative vendor success stories). In terms of the key performance metrics for the CPFR® program, instock rates at the stores came close to the goal of 96 percent in every store, even during peak season. Forecast accuracy climbed to approximately 85 percent. On-time shipments, on the other hand, were improving but only
  • 62.
    reached 30 percentagainst a stated goal of 90 percent in 2002. However, West Marine expected them to climb to at least 50 percent by the end of 2003. For the exclusive use of A. Bregante, 2018. This document is authorized for use only by Anthony Bregante in SCM 800 Fall 2018 Aggon taught by NORMAN AGGON, The Pennsylvania State University from Aug 2018 to Jan 2019. West Marine: Driving Growth Through Shipshape Supply Chain Management GS-34 p. 17 Buoyed by its progress, West Marine implemented a “no hassle” guarantee to its suppliers. To show the seriousness of its commitment to its forecasts, the company promised to purchase 100 percent of its forecasts every time. While this placed the burden of any mistakes squarely on West Marine’s shoulders, it went a long way toward convincing vendors to trust in the company’s forecasts. The implementation, however, was not without its challenges. West Marine continually had to “sell” the value of CPFR® to its suppliers, and some remained unconvinced. Certain vendors did not believe that benefits warranted the investment of time, money, and resources. Others felt West Marine, as the country’s largest boating supply company,
  • 63.
    was “throwing itsweight around,” and that its expectations of its vendors were unrealistic. At times, suppliers became preoccupied with the metrics and challenged the accuracy of West Marine’s performance reports. Distractions like these caused West Marine and its suppliers to spend more time arguing about measurements than focusing on performance improvements or other, more constructive behaviors. However, many vendors were enthusiastic about the changes, which increased their ability to more regularly communicate and collaborate with West Marine. In fact, as word began to spread among its suppliers, more companies specifically asked to be included. In the home office, initial employee reactions to West Marine’s CPFR® program were mixed. While some individuals resented the more restrictive processes and the more rule-based environment, others believed in the changes and were energized by the results the company was starting to realize. Regardless of their personal feelings, all of West Marine’s employees agreed that the supply chain worked significantly better than it had following the E&B Marine acquisition. More people, at all levels of the organization, understood the end-to-end process and the impact of their actions on supply chain effectiveness. In addition, there was a much higher level of cooperation and collaboration within West Marine⎯ even among those who had not yet bought-in to the value of CPFR®. Other Supply Chain Improvements in West Marine’s DCs In the DCs, West Marine started to use the improved forecasts
  • 64.
    to plan shippingand receiving activities and use its dock space more productively. For example, if the forecast called for 150 truckloads of antifreeze to support the company’s winterizing campaign, the DC team would know to coordinate with the planning and replenishment department to make sure all 150 truckloads of product did not arrive at the DC at one time. Working together, these teams used the forecasts to smooth demand spikes and schedule/sequence inbound and outbound shipments to maximize the efficiency of its internal supply chain operations. Coordination based upon forecasting also allowed Murphy and his distribution managers to proactively plan and manage the labor requirements for each season to create an optimal balance among seasonal hiring, overtime, and year-round staffing alternatives. To institutionalize more collaborative supply chain interactions, the planning and replenishment department and the DCs established weekly meetings. As Murphy put it, “The marriage of replenishment and physical logistics and distribution cannot ever be separated. They have to work in total concert. Otherwise, you’re going to have serious trouble.” In these sessions, the two groups agreed on a tactical, 30-day view of the forecast and used it to optimize near-term supply chain planning and execution. The merchandise planners brought insights from the For the exclusive use of A. Bregante, 2018. This document is authorized for use only by Anthony Bregante in SCM 800 Fall 2018 Aggon taught by NORMAN AGGON,
  • 65.
    The Pennsylvania StateUniversity from Aug 2018 to Jan 2019. West Marine: Driving Growth Through Shipshape Supply Chain Management GS-34 p. 18 vendors to these discussions, and the DC team offered a reality check from the warehouse floor. The focus was on troubleshooting, problem resolution, and the elimination of unanticipated changes and supply chain delays. In addition to working more closely with the planning and replenishment group, the distribution team implemented a series of major process improvements. West Marine leveraged its new IS capabilities to convert all of its DCs to radio frequency (RF) item and parcel identification. West Marine also used JDA’s WMS to support differentiation of shipping methods and multiples by location. Further, the company began more fully using its Cubiscan system. Cubiscan was a computer used on the receiving dock to measure the cubic displacement of every item, case, or other unit received (e.g., its physical dimensions, weight, and other data). With this information, the DC teams could more efficiently manage storage space within the warehouse by optimizing the capacity of every aisle. It also enabled them to more effectively plan pick lists and fill cartons. By knowing exactly how much space each item would require in a carton, West Marine
  • 66.
    saved money byfilling its cartons to 85 percent capacity and, in turn, making fewer shipments to move the same volume of product. Since outbound shipping represented the vast majority of most DC labor and operating cost, the focus on standard (and inner) pack utilization reaped significant benefits, including a 3x improvement in the use of standard carton distribution to West Marine’s stores. Murphy also used the Cubiscan data as input toward the creation of engineered operating standards for the warehouses. Working with an outside consultant, the DC teams completed three-dimensional studies of the warehouse facilities to determine the time and distance requirements of every job in the DCs. Using this data, management could define the optimal sequence and anticipated time required to shelve any combination of products, complete any pick lists, prepare cartons for shipping, and execute other common operating procedures. This meant that for every standard process in the warehouses, there was a benchmark against which the efficiency and effectiveness of West Marine’s employees was measured. To drive additional logistics efficiencies through transportation, West Marine took control of its inbound freight and directly managed close to 85 percent of all inbound shipments by 2003. Rather than relying on vendors to independently arrange for the delivery of products to the DCs, West Marine instructed them to call the company to arrange for a pick-up. West Marine committed to executing the pick-ups within 48 hours of being
  • 67.
    notified, which wasgood for the vendor. There were also many benefits to West Marine, including significantly lower freight rates. The company was also able to coordinate pick-ups to maximize truck capacity and reduce traffic at the DCs (e.g., one truck arrived with 25 pallets from a variety of different vendors rather than 25 trucks showing up at the DC carrying one pallet each). Finally, directly managing its inbound freight gave West Marine additional, advanced visibility into upstream supply chain activities “rather than just hoping that everything shows up where it’s supposed to be,” according to Murphy. “The sooner you take ownership of the physical product and the physical movement of that product, the more likely you’re going to achieve your goals.” At the same time as executing these performance improvements, West Marine invested significant time and energy in training its DC employees. Because the company had been operating in a crisis management mode for several years, the training of hourly and management For the exclusive use of A. Bregante, 2018. This document is authorized for use only by Anthony Bregante in SCM 800 Fall 2018 Aggon taught by NORMAN AGGON, The Pennsylvania State University from Aug 2018 to Jan 2019. West Marine: Driving Growth Through Shipshape Supply Chain Management GS-34
  • 68.
    p. 19 associates hadfallen by the wayside. However, with the latest round of changes in the DCs, West Marine wanted to be sure that all staff members understood how things worked, and why they worked that way, so that they could make independent decisions that positively (rather than negatively) impacted the efficiency and effectiveness of the supply chain. Employees took on increased responsibility for achieving desired results and, through the company’s training program, they acquired the knowledge and tools they needed to be successful. TESTING WEST MARINE’S SEAWORTHINESS: THE BOATU.S. ACQUISITION On a Slightly Different Course BoatU.S. (Boat Owners Association of the United States) began as a boater’s advocacy group in 1966. Over the years, BoatU.S. grew to more than 500,000 members. Its primary member services included marine insurance, boat financing, marina discounts, towing, government representation and lobbying, consumer advocacy, boating news (through BoatU.S. Magazine) and programs to improve environmental responsibility and safety within the boating industry. The group also expanded its services to include a boating equipment division that had 62 stores, Internet/catalog operations, and a small wholesale business by 2003.
  • 69.
    Initially, BoatU.S. storeswere located primarily on the east coast, while West Marine was concentrated in the West. As founder Richard Schwartz put it in an article for his magazine, “Our two organizations watched each other grow⎯ first with interest from distant coasts and then in the same market areas as our stores moved closer together.”20 As both chains sought to expand, and as consolidation started to occur within the industry (e.g., the E&B Marine acquisition), a rivalry emerged between the two companies. While BoatU.S. tended to serve more trailer boat customers than West Marine, there was significant overlap within their customer bases. Regardless of this common ground, BoatU.S. and its customers considered themselves unique. According to Schwartz, “BoatU.S. was quite different. We were a membership association formed not only to save boaters money on equipment and supplies, but to give them a voice on legislation, government regulations, safety, and consumer issues.”21 This difference affected both companies’ perceptions of one another and fueled competition between the two chains. Despite its best efforts, BoatU.S. could not keep up with West Marine’s expansion. The organization quietly entered acquisition talks with West Marine. Schwartz was originally interested in selling the entire BoatU.S. organization to West Marine, but West Marine determined that it was only potentially interested in its equipment business (the retail stores, catalog/Internet, and wholesale operations, excluding the BoatU.S. headquarters staff). Eric
  • 70.
    Nelson, West Marine’sCFO explained, “We were prudent enough to recognize we were retailers. Many companies get so cocky that they think they can do anything.” Eventually, the BoatU.S. team warmed to this approach, stating that it would allow the association to refocus its efforts on its core mission⎯ providing members with boating related services. However, due to the intensity of the rivalry between the companies and his own mixed emotions about the sale, 20 Richard Schwartz, “Behind the Buoy,” BoatU.S. Magazine, March 2003. 21 Ibid. For the exclusive use of A. Bregante, 2018. This document is authorized for use only by Anthony Bregante in SCM 800 Fall 2018 Aggon taught by NORMAN AGGON, The Pennsylvania State University from Aug 2018 to Jan 2019. West Marine: Driving Growth Through Shipshape Supply Chain Management GS-34 p. 20 Schwartz insisted that all negotiations had to be kept secret until the day the transaction was executed. Planning the Overhaul⎯ High Pain, Short Duration
  • 71.
    BoatU.S.’s requirements forsecrecy made planning for the acquisition extremely challenging for West Marine. According to Edmondson, “Up until one or two weeks before the acquisition, there probably weren’t 15 people in our organization who knew it was coming.” Edmondson went only to select members of his executive team and asked them how much time and money they would need to execute the acquisition. “He said if it’s too expensive or too complex, we’re not going to do it,” remembered Schenk. From a financial perspective, West Marine’s results were just beginning to improve and the company couldn’t afford a high-cost acquisition. From a customer perspective, it had successfully repaired much of the damage caused by the E&B Marine transaction, but it could not sustain another slow, painful integration. Those issues aside, the West Marine management team was ready to start growing again. As Nelson put it, “We had invested millions of dollars in infrastructure, getting good people, supporting them, giving them time to get their operations in order. Finance was fixed. IS was fixed. Logistics and the supply chain were fixed. We had become lean and we were getting good numbers. We were anxious to do something.” With peak season rapidly approaching, Edmondson decided that if West Marine was going to move forward with the acquisition, it needed to integrate the two companies within 60 days. “When I told him it might take four to six months to get the systems fully integrated, he told me that was the ‘wrong answer,’” recalled Schenk. Edmondson’s
  • 72.
    direction was clear:(1) integrate and begin operating as one business within 60 days, (2) ensure minimal disruption to peak season sales, (3) make the acquisition profitable in the first year. From a supply chain perspective, the acquisition would be challenging. BoatU.S. had approximately the same number of stores as E&B Marine. Yet the integration would be more complicated due to the inclusion of its robust Internet/catalog operations and growing wholesale business. BoatU.S. had its own catalog with a sizable circulation, an extensive Internet store, and a call center in Florida. The company also had a significant loyalty program and marketing flier programs to take into account. From a wholesale perspective, BoatU.S.’s port supply division was less mature and had not clearly defined its customer base (so that numerous retail customers qualified for unwarranted wholesale discounts). To complicate matters further, because West Marine elected not to acquire the BoatU.S. home office staff, the company would have limited assistance from legacy BoatU.S. employees in terms of providing information, continuity, and other forms of assistance related to supply chain planning, forecasting, and replenishment. Both BoatU.S. and West Marine offered 50,000 SKUs via their stores, Internet sites, and catalogs. Yet, only 10,000 SKUs matched between the two organizations. Similarly, both companies had approximately 750 suppliers, with only 100 in common. West Marine and BoatU.S. were both using EDI, but BoatU.S. transacted with a
  • 73.
    much smaller percentageof its vendors this way (roughly 30 percent). BoatU.S. did not provide regular forecasts to its suppliers, nor did it participate in any other CPFR® activities. The two companies received For the exclusive use of A. Bregante, 2018. This document is authorized for use only by Anthony Bregante in SCM 800 Fall 2018 Aggon taught by NORMAN AGGON, The Pennsylvania State University from Aug 2018 to Jan 2019. West Marine: Driving Growth Through Shipshape Supply Chain Management GS-34 p. 21 different pricing from suppliers and, in turn, offered different pricing to customers on the same and/or similar products. BoatU.S.’s product assortments were less well-defined, with popular, new products and high-volume/high-margin items missing from certain stores. Clearly, a vendor and SKU rationalization effort would be needed but, if West Marine decided to maintain the BoatU.S. brand, the company would need to purposefully develop a more diverse product base and more unique assortments than ever before. In terms of its distribution capabilities, BoatU.S. operated one DC in Hagerstown, Maryland. While this warehouse utilized technology that was not available at the time of the E&B Marine
  • 74.
    acquisition (e.g., barcoding and radio-frequency tracking), the building itself was not conducive to efficient logistics operations and the company’s warehouse processes had not been optimized. BoatU.S.’s warehouse management systems were comparable (in terms of functionality and comprehensiveness) to what West Marine was using, but they were not directly compatible. Similarly, the two companies had compatible hardware in its stores, but operated on different point-of-sale software systems. The stores drove the majority of replenishment activities via mostly manual processes. One additional challenge related directly to West Marine’s suppliers. While supplier performance had improved dramatically through West Marine’s CPFR® efforts, it still fell short of the company’s expectations. While West Marine now felt confident of its own supply chain processes, systems and controls, it could not yet fully depend on its suppliers to keep their promises. Some suppliers had risen to the occasion and were performing at a consistent and reliable level. Others, however, were still unpredictable, disengaged, or unconcerned with West Marine’s assessment of their performance. Ultimately, West Marine’s management team had to determine if its confidence in its own internal supply chain operations was strong enough to offset the remaining weakness in its vendor community. FULL SPEED AHEAD To achieve the company’s objectives for the BoatU.S. acquisition, the West Marine management
  • 75.
    team had prepareda plan to overcome and manage the many obstacles and risks that might prevent it from quickly getting the newly combined organization on an even keel. The team was certain that West Marine was better prepared for this acquisition than it had been for the E&B Marine transaction. However, each member wondered what new “soft spots” might be discovered as the company again ramped up its growth engine on its way to becoming a $1 billion business. For the exclusive use of A. Bregante, 2018. This document is authorized for use only by Anthony Bregante in SCM 800 Fall 2018 Aggon taught by NORMAN AGGON, The Pennsylvania State University from Aug 2018 to Jan 2019. West Marine: Driving Growth Through Shipshape Supply Chain Management GS-34 p. 22 Exhibit 1 Illustrative Store and Product Photos Source: Photographs provided by West Marine.
  • 76.
    For the exclusiveuse of A. Bregante, 2018. This document is authorized for use only by Anthony Bregante in SCM 800 Fall 2018 Aggon taught by NORMAN AGGON, The Pennsylvania State University from Aug 2018 to Jan 2019. West Marine: Driving Growth Through Shipshape Supply Chain Management GS-34 p. 23 Exhibit 2 Timeline of Company Milestones (through 2002) Yr # Stores Sales (000,000) EPS Major Milestones 1968 Randy Repass, founder and chairman of the Board of Directors, began selling rope by mail-order out of his garage under the name West Coast Ropes. The only product offered is a 3-strand nylon rope. 1975 1 The first West Coast Ropes store opened in Palo Alto,
  • 77.
    California. 1977 2 The Companyacquired Boston-based West Products, a well known mail-order business, and changed its name from West Coast Ropes to West Marine Products. The second store opened in Oakland, California. 1980 3 Store three opened in Sausalito, California. 1983 8 Acquired five-store Newport Supply chain in Southern California. Opened South San Francisco store. 1986 13 $31.8 The Company acquired three-store Cal Marine chain in the Pacific Northwest. 1988 16 $56.3 The Company introduced its first Master Catalog, 330 black- and-white pages packed with boating gear. The first West Marine Pacific Cup race from San Francisco to Hawaii took place. 1991 19 $74.8 West Marine opened its first stores on the East Coast in Miami and Annapolis. More stores followed in Florida, Virginia, New York, Connecticut, Rhode Island and Massachusetts. 1993 37 $122.8 The Company went public under the symbol WMAR on the Nasdaq exchange. The Initial Public Offering was for 1,800,000 @ $14.00/share. 1995 72 $224.2 $0.61 Follow-on offering of 1,380,000 shares
  • 78.
    made @ $24.75/share. 1996151 $323.3 $0.68 Opened Hollister Distribution center in California. West Marine merged with one of its oldest and most respected competitors, E&B Marine. After the completion of the merger, West Marine had 150 stores across the U.S. 1998 212 $449.3 $0.06 Opened Rock Hill distribution center in South Carolina. John Edmondson joined West Marine as President and Chief Executive Officer. 1999 227 $486.5 $0.50 Ken Corwin joined West Marine as senior vice president of merchandising. Pat Murphy joined West Marine as senior vice president of logistics. Larry Smith joined West Marine as senior vice president of planning & replenishment. 2000 233 $508.4 $0.42 David Schenk joined West Marine in October of 2000 as vice president and CIO. 2001 240 $512.9 $0.77 West Marine exceeded 1,000,000 in West Advantage customer loyalty members. More than 98% of inventory replenishment now automated. 2002 257 $530.6 $0.97 Opened two new stores in Canada and two new West Marine Express stores. Source: Information provided under “Investor Information/Timeline” at www.westmarine.com.
  • 79.
    For the exclusiveuse of A. Bregante, 2018. This document is authorized for use only by Anthony Bregante in SCM 800 Fall 2018 Aggon taught by NORMAN AGGON, The Pennsylvania State University from Aug 2018 to Jan 2019. West Marine: Driving Growth Through Shipshape Supply Chain Management GS-34 p. 24 Exhibit 3 Highlights from 2002 Analyst Report West Marine’s Historical Performance 1993 1994 1995 1996 1997 1998 1999 2000 2001 Stores 37 54 72 151 184 212 227 233 240 Store Growth 37% 45.9% 33.3% 109.7% 21.9% 15.2% 7.1% 2.6% 3.0% Sales (000,000) $123 $170 $224 $328 $421 $545 $492 $508 $513 Sales Growth
  • 80.
    26.5% 38.4% 31.9%46.2% 28.3% 8.0% 8.3% 3.3% 0.9% EPS $0.34 $0.45 $0.61 $0.79 $0.86 $0.14 $0.50 $0.50 $0.77 EPS Growth 13.3% 32.4% 35.6% 29.5% 9.6% -83.5% 252.1% 0.0% 54.2% West Marine’s 2002 Market Position Relative to Top Competitors West Marine BoatU.S. Boater’s World Sales (000,000) $440 $120 $80 Market Share* 7.3% 2.0% 1.3% Total Stores 252 63 100 * Based on an estimate that the total boating market is approximately $6 billion in size. West Marine’s Store Location Mix Relative to Industry Percent of Retail Sales West Coast Northeast Southeast West Marine 32% 37% 31% Industry** 40% 33% 27% **Estimated by RBC Capital Markets using data from NMMA 1999 U.S. Recreational Boat Registration statistics.
  • 81.
    Source: Compiled froman RBC Capital Markets report titled “West Marine Inc: The Clear Leader in a Fragmented Market” (October 15, 2002). For the exclusive use of A. Bregante, 2018. This document is authorized for use only by Anthony Bregante in SCM 800 Fall 2018 Aggon taught by NORMAN AGGON, The Pennsylvania State University from Aug 2018 to Jan 2019. West Marine: Driving Growth Through Shipshape Supply Chain Management GS-34 p. 25 Exhibit 4 Partial Executive Organization (2003) Source: Information provided by West Marine. John Edmondson CEO Rich Everett COO
  • 82.
    Eric Nelson CFO Ken Corwin SeniorVP Merchandising Larry Smith Senior VP Planning & Replenishment Tom Carey Senior VP Marketing Bruce Edwards Senior VP Store Operations David Schenk CIO Pat Murphy Senior VP Logistics Chris Bolling VP Port Supply Tony Gasparich VP Direct Sales
  • 83.
    John Edmondson CEO Rich Everett COO EricNelson CFO Ken Corwin Senior VP Merchandising Larry Smith Senior VP Planning & Replenishment Tom Carey Senior VP Marketing Bruce Edwards Senior VP Store Operations David Schenk CIO Pat Murphy Senior VP Logistics Chris Bolling
  • 84.
    VP Port Supply TonyGasparich VP Direct Sales For the exclusive use of A. Bregante, 2018. This document is authorized for use only by Anthony Bregante in SCM 800 Fall 2018 Aggon taught by NORMAN AGGON, The Pennsylvania State University from Aug 2018 to Jan 2019. West Marine: Driving Growth Through Shipshape Supply Chain Management GS-34 p. 26 Exhibit 5 Partial List of Key West Marine Team Members (2003) Chris Bolling – Chris Bolling joined West Marine in 1994 and has been responsible for real estate strategy, market research, and support of new company initiatives. He has had a role in growing the store base from 54 units to over 350 units and was actively involved in the company’s expansion into Canada, the development of the small format West Marine Express stores, and the company’s most recent acquisitions. Bolling also managed West Marine’s wholesale division, where he developed a regional sales and support structure to address the
  • 85.
    needs of multiplemarket segments. Tom Carey – Tom Carey joined West Marine as the senior vice president of marketing in 2003. He was the senior vice president of marketing for Goody's Family Clothing Inc. from 2001 to 2002, senior vice president of marketing for Sunglass Hut International from 1999 to 2001, vice president of marketing for Bloomingdale’s from 1997 to 1999, vice president of marketing for Builder's Square from 1994 to 1997, and Fogarty Klein & Partners from 1994 to 1995. Before that, Carey worked for advertising agencies including Ogilvy & Mather and Young & Rubicam, for clients such as American Express, Lincoln Mercury, Kenmore and JC Penney. Ken Corwin – Ken Corwin joined West Marine in 1999 as the senior vice president of merchandising and general merchandise manager. He has 34 years of experience in all facets of retail management. Corwin served as the president of World Duty Free International’s airport division from 1998 to 1999, senior vice president for Venture stores from 1997 to 1998, and vice president-director of stores for Gottschalk’s from 1990 to 1997. He also held merchandising management positions with both Target and the J.C. Penney Company from 1971 to 1988. John Edmondson – John Edmondson joined West Marine in 1998 as the company’s president and chief executive officer. Edmondson was formerly president and CEO of World Duty Free International, Inc. where he helped lead the industry-leading retail organization to significant
  • 86.
    sales and profitgrowth. He joined World Duty Free in 1992 as president of the company's largest operating divisions. During his tenure with the organization he also held the role of corporate chief operating officer. Edmondson began his career with Allied Store's Maas Bros./Jordan Marsh division in 1965 and held various senior management positions with several retailers. From 1976 to 1980 he served as senior vice president and general merchandise manager of Allied Store's Joske's of Texas division before leaving to join Federated Department Store's Filenes division in Boston. Prior to joining World Duty Free International Inc., Edmondson was general manager of Marriott's Host and Sports & Entertainment divisions. Bruce Edwards – Bruce Edwards joined West Marine in 1985 and has been responsible for running all three of the company’s profit centers (catalog, port supply, and stores). He had an instrumental role in the long-term growth of West Marine from 10 to 350 stores, including active management of over 10 of the company's acquisitions. Edwards has been involved in the marine industry his entire career and has a background in sail making and boat building. For the exclusive use of A. Bregante, 2018. This document is authorized for use only by Anthony Bregante in SCM 800 Fall 2018 Aggon taught by NORMAN AGGON, The Pennsylvania State University from Aug 2018 to Jan 2019.
  • 87.
    West Marine: DrivingGrowth Through Shipshape Supply Chain Management GS-34 p. 27 Rich Everett – Rich Everett served as a director of West Marine since 1994 and as the company’s chief operating officer since 1995. From 1998 to 2001, Everett was president of stores. In this role, he directed the day-to-day operations and expansion of West Marine's nationwide retail store network and (effective in 2001) oversaw the company’s catalog and Internet divisions. From 1996 to 1998, he served as executive vice president and has held various other positions since joining West Marine in 1981. Tony Gasparich – Tony Gasparich served as vice president of Internet at West Marine since 1999. In 2002, he assumed the role of vice president of direct sales (catalog and Internet). In this position, he directs day-to-day operations and strategic direction for the direct sales division. Between 1997 and 1999 he served as merchandise manager, and has held various other positions since joining West Marine in 1979. Pat Murphy – Pat Murphy joined West Marine in 1999 as the senior vice president of logistics. He has vast experience working in the retail industry with a focus on logistics and distribution. From 1993 to 1999, Murphy was group vice president of logistics for Borders Group, Inc. He served as general manager and president of the Midwest
  • 88.
    operating division ofthe Southland Corp. from 1989 to 1992, as director of distribution for Wilson Foods from 1985 to 1989, and as general manager for Levi Strauss & Company's distribution center from 1980 to 1985. Eric Nelson – Eric Nelson joined West Marine in 2000 as the controller and vice president of finance, then moved into the roles of chief financial officer, chief accounting officer, senior vice president of finance, and secretary. Previously, Nelson served as CFO for Dental Components International from 1999 to 2000, CFO for Fluid-Air Components from 1995 to 1999, and CFO for Etcetera Retail Chain Stores, Inc. from 1989 to 1994. He also worked as a "troubled company" turnaround specialist from 1994 to 1995 and was the assistant controller for May Department Stores from 1979 to 1989. David Schenk – David Schenk joined West Marine in October 2000 as vice president and chief information officer and was soon promoted to senior vice president. As the leader of information systems for the company, he oversaw software development, retail systems, and network systems and security. He and his team were responsible for supporting over 350 West Marine retail stores, plus West Marine’s catalog, Internet and port supply/wholesale businesses. Prior to West Marine, Schenk was a corporate senior vice president for McKesson Corporation for 18 years, where he was responsible for several business units including software implementation and support, outsourcing and network design, installation and support.
  • 89.
    Larry Smith –Larry Smith joined West Marine in 1999 as the senior vice president of planning and replenishment. Prior to joining West Marine, Smith served as the divisional vice president of planning and replenishment for Kmart Corporation from 1996 to 1999. He also served as the director of planning & replenishment for Staples from 1995 to 1996 and the director of inventory management for Kaybee Toy Stores from 1994 to 1995. Smith published several articles and received RIS News Magazine's "Retail Pacesetter Award" in June of 2003, honoring the 20 leading retail technology executives. Source: Information provided by West Marine. For the exclusive use of A. Bregante, 2018. This document is authorized for use only by Anthony Bregante in SCM 800 Fall 2018 Aggon taught by NORMAN AGGON, The Pennsylvania State University from Aug 2018 to Jan 2019. West Marine: Driving Growth Through Shipshape Supply Chain Management GS-34 p. 28 Exhibit 6 West Marine Strategic Framework
  • 90.
    Source: Information providedby West Marine. CRITICAL SUCCESS FACTORS CSF #1 CSF #2 CSF #3 CSF #4 CSF #5 CSF #6 STRATEGIC PERFORMANCE INDICATORS Best of class supply chain management Right product assortments at the right place at the right time Strong customer relationship culture
  • 91.
    that maximizes sales, profitably Efficient,reliable, accountable, and quality execution Effective mktg strategy that communicates our leadership position & grows brand equity High Performing team of motivated professional, associates VISION The best boating products company, every day. ROE, Cash Flow, Comp Sales, EPS, Product Service Levels, Market Share, Customer Satisfaction, Associate Satisfaction CRITICAL SUCCESS FACTORS CSF #1 CSF #2 CSF #3 CSF #4
  • 92.
    CSF #5 CSF #6 STRATEGICPERFORMANCE INDICATORS Best of class supply chain management Right product assortments at the right place at the right time Strong customer relationship culture that maximizes sales, profitably Efficient, reliable, accountable, and quality execution Effective mktg strategy that communicates our leadership position & grows brand equity High Performing team of motivated professional, associates
  • 93.
    VISION The best boatingproducts company, every day. ROE, Cash Flow, Comp Sales, EPS, Product Service Levels, Market Share, Customer Satisfaction, Associate Satisfaction For the exclusive use of A. Bregante, 2018. This document is authorized for use only by Anthony Bregante in SCM 800 Fall 2018 Aggon taught by NORMAN AGGON, The Pennsylvania State University from Aug 2018 to Jan 2019. West Marine: Driving Growth Through Shipshape Supply Chain Management GS-34 p. 29 Exhibit 7 CPFR® Process Model Collaboration Roles Alternatives Sales Forecasting Order Planning/ Forecasting
  • 94.
    Order Generation Option A: ConventionalOrder Management Retailer Retailer Retailer Option B: Supplier-Managed Inventory Retailer Manufacturer Manufacturer Option C: Co-Managed Inventory Retailer Retailer Manufacturer Option D: Retail Vendor- Managed Inventory Manufacturer Manufacturer Manufacturer Source: CPFR® Overview, May 18, 2004. Copyright © Voluntary Interindustry Commerce Standards (VICS) Association. All rights reserved. Reprinted by permission of VICS. For the exclusive use of A. Bregante, 2018. This document is authorized for use only by Anthony Bregante in SCM 800 Fall 2018 Aggon taught by NORMAN AGGON, The Pennsylvania State University from Aug 2018 to Jan 2019.
  • 95.
    West Marine: DrivingGrowth Through Shipshape Supply Chain Management GS-34 p. 30 Exhibit 8 West Marine’s Multi-Echelon Replenishment Solution
  • 96.
    Source: Information providedby West Marine. Customer Sales Determinants Systems Used to manage: • Replenishment location* • Start/stop date* • Purchase/ship multiples* • Base annual forecast* • Seasonality* • Item ranking* • Promotions* • Non-stocking sales* Promotion Planning System Used to manage impact of promotions on demand Profiling
  • 97.
    System Used to manage impact of seasonality and regionality ondemand Visual Merchan- dising System Used to manage planograms and assortment data Store Level Forecasting
  • 98.
    and Replenishment System Used to develop itemforecasts at the individual store level Point of Sales Forecast Planning System Used to: • Plan targeted results (sales, margins) • Determine anticipated receipt and inventory results
  • 99.
    Distribution Center Level Forecastingand Replenishment System Used to aggregate store level forecasts and optimize inventory enterprise-wide* Store Order Forecast Supplier Orders and Order Forecasts * Prior to the implementation of the multi-echelon solution, these activities were performed manually (or not done at all) Custom User Interface
  • 100.
    Provides users witha transparent, integrated view across all components of the multi-echelon solution Customer Sales Determinants Systems Used to manage: • Replenishment location* • Start/stop date* • Purchase/ship multiples* • Base annual forecast* • Seasonality* • Item ranking* • Promotions* • Non-stocking sales* Promotion Planning System Used to manage impact of promotions on demand
  • 101.
    Profiling System Used to manage impact of seasonality and regionality ondemand Visual Merchan- dising System Used to manage planograms and assortment data Store Level
  • 102.
    Forecasting and Replenishment System Used to develop itemforecasts at the individual store level Point of Sales Forecast Planning System Used to: • Plan targeted results (sales, margins) • Determine anticipated receipt and inventory
  • 103.
    results Distribution Center Level Forecastingand Replenishment System Used to aggregate store level forecasts and optimize inventory enterprise-wide* Store Order Forecast Supplier Orders and Order Forecasts * Prior to the implementation of the multi-echelon solution, these activities were performed manually (or not done at all)
  • 104.
    Custom User Interface Providesusers with a transparent, integrated view across all components of the multi-echelon solution For the exclusive use of A. Bregante, 2018. This document is authorized for use only by Anthony Bregante in SCM 800 Fall 2018 Aggon taught by NORMAN AGGON, The Pennsylvania State University from Aug 2018 to Jan 2019. West Marine: Driving Growth Through Shipshape Supply Chain Management GS-34 p. 31 Exhibit 9 Collaborative West Marine Supply Chain Process Legend CM = Category Management AP = Assortment Planning
  • 105.
    MP = MerchandisePlanning RA = Replenishment Analysis Mktg = Marketing Visual = Visual Merchandising - TRIGGERS - New customer need Need for category reset New vendor product introduction New market opportunity CONCEPT Primary Activities Owner Source product CM Negotiate vendor agreement
  • 106.
  • 107.
  • 108.
    prepare for roll- out CM, RA, Vendor Planspecific promotions CM, MP, Mktg, Vendor ACTION Primary Activities Owner Set up seasonal profile and load
  • 109.
    forecast into replenishment system AP, RA Share forecast withvendor MP Purchase initial fill MP Implement new product roll-out at store level Stores Execute ongoing collaborative
  • 110.
    processes (ongoing) CM, MP, RA Execute scheduled promotions (ongoing) CM, MP, Mktg, Stores Note: Process simplifiedfor illustrative purposes. Source: Information provided by West Marine. For the exclusive use of A. Bregante, 2018. This document is authorized for use only by Anthony Bregante in SCM 800 Fall 2018 Aggon taught by NORMAN AGGON,
  • 111.
    The Pennsylvania StateUniversity from Aug 2018 to Jan 2019. West Marine: Driving Growth Through Shipshape Supply Chain Management GS-34 p. 32 Exhibit 10 Sample Vendor Performance Reports Weekly Instock E-mail Weekly Instock Analysis Source: Information provided by West Marine. The current instock results for LEWMAR, supplier #012123
  • 112.
    items at WestMarine this morning is as follows: Instock percent in West Marine Stores is 97.70%. West Marine's goal is 96% instock in every store every week. Late Orders, reflecting late shipments for EDI suppliers, and late receipts for non-EDI suppliers: $1,700. Understock at West Marine stores, items you and West Marine would ship to stores now, but which are not available: $2,520. Thanks for your ongoing commitment to growing your sales with West Marine. Great Job! For the exclusive use of A. Bregante, 2018. This document is authorized for use only by Anthony Bregante in SCM 800 Fall 2018 Aggon taught by NORMAN AGGON, The Pennsylvania State University from Aug 2018 to Jan 2019. West Marine: Driving Growth Through Shipshape Supply Chain Management GS-34
  • 113.
    p. 33 Exhibit 11 WestMarine CPFR® Vendor Success Stories Interlux Interlux supplied more than 500 products to West Marine, including key items like bottom paints and varnishes required to help boaters prepare for the peak boating season each spring. If West Marine did not have these products instock at the beginning of the season, these sales would potentially be lost until the beginning of the following season (painting was typically done annually, before the first time a customer put his/her boat into the water for the season). Initially, Interlux agreed to participate in West Marine’s CPFR® program, but did not invest itself in the process. The company did not use the forecasts provided by West Marine to plan advanced production or build up safety stocks prior to peak season. As a result, when preseason demand for products like bottom paint ramped up, the
  • 114.
    company’s standard productioncapacity could not keep pace with West Marine’s needs. When boaters needed Interlux products the most, West Marine was unable to keep them stocked in the stores. In a single season, West Marine estimated that it lost more than $1 million in sales of Interlux products due to late shipments and instock problems. At the urging of West Marine’s category management team for maintenance products, the Interlux team finally agreed to more actively begin using the forecasts and collaborating with West Marine to resolve these supply chain challenges. The head of Interlux’s U.S. operations began regularly participating in monthly collaborative calls with West Marine’s merchandise planner, along with representatives from the company’s vendor relations, logistics, and customer support teams. The company also dedicated an analyst to carefully study West Marine’s projections and determine the most effective way to incorporate them into the company’s advance planning processes.
  • 115.
    Working together, thetwo organizations collaboratively implemented significant improvements. By the next spring season, the company’s instock rates improved from 94 percent to 97 percent in all stores. Similarly, Interlux increased its on-time shipments to West Marine by more than 55 percent. Sales climbed by more than 17 percent over the previous season. Improved supply chain effectiveness also enabled West Marine to rely on Interlux to ship more than $1.1 million in products directly to its stores (up from $200,000 the previous year), thereby reducing the time required to move products to the stores, saving West Marine significant logistics costs, and reducing seasonal bottlenecks in West Marine’s DCs. Interlux is now one of West Marine’s greatest CPFR® advocates, and both companies are directly benefiting from increased cooperation and collaboration. RayMarine RayMarine provided West Marine with a wide variety of high- end marine electronics, including radar and GPS systems and related accessories. Formerly a
  • 116.
    division of Raytheon,the company became an independent organization just as West Marine was implementing its CPFR® program. However, rather than using West Marine’s forecasts to begin operating more efficiently (in its new, leaner environment), the company reduced its safety stocks, planned its For the exclusive use of A. Bregante, 2018. This document is authorized for use only by Anthony Bregante in SCM 800 Fall 2018 Aggon taught by NORMAN AGGON, The Pennsylvania State University from Aug 2018 to Jan 2019. West Marine: Driving Growth Through Shipshape Supply Chain Management GS-34 p. 34 product lifecycles, and scheduled production with little or no direct input from West Marine (or its other customers). As a result, RayMarine was frequently
  • 117.
    caught by surprisewhen West Marine’s purchase orders arrived (despite their inclusion in the forecasts), leading to late and incomplete shipments, as well as instock levels well below target. RayMarine also began discontinuing its products every 18 months without providing notice to West Marine. With these items discontinued faster than West Marine could sell them (high-end electronics products turned over at a rate of just 80 percent a year), the short product lifecycles caused RayMarine’s total SKU count with West Marine to mushroom. This also left West Marine with a sizable backlog of discontinued products, as well as cables and other accessories that only worked with items that were no longer produced. West Marine had been providing weekly forecasts and performance reports to RayMarine for quite some time. When the company finally began to review them in detail, they realized how inefficient their interactions with West Marine had become. At this point, RayMarine engaged with West Marine’s category management team for electronics and actively started to
  • 118.
    collaborate. Through aseries of frank discussions, RayMarine started to better understand West Marine’s forecasts and appreciate the impact of its short product lifecycles on the company. RayMarine extended its product lifecycles to three years and reduced its total SKU count by more than 30 percent, in part by designing cables and accessories that would be backward-and- forward compatible (to work with old and new products). RayMarine also dedicated an analyst to reviewing its sales with West Marine and helping the company reduce its discontinued inventory (suggesting where to move it, how to price it, etc.). This effort enabled West Marine to decrease its backlog of discontinued items by more than 50 percent. By using West Marine’s forecasts, RayMarine also increased its instock rate to levels well above West Marine’s target. Through better instore availability and more collaborative sales planning, the two companies also drove a 40 percent sales increase over the previous year. Even while still in the midst of a transition, West Marine and RayMarine, both acknowledged
  • 119.
    having benefited fromincreased collaboration, and had every intention of staying the course. For the exclusive use of A. Bregante, 2018. This document is authorized for use only by Anthony Bregante in SCM 800 Fall 2018 Aggon taught by NORMAN AGGON, The Pennsylvania State University from Aug 2018 to Jan 2019. SCM 800 West Marine Case Team Assignment Assignment Document: This document includes the following assignment information needed to complete this case assignment: I. Assignment Objectives II. Assignment Introduction III. Assignment Directions IV. Assignment Guidelines and Requirements V. Assignment Questions VI. Grading Criteria VII. Cover Page VIII. I. Assignment Objectives:
  • 120.
    The goal ofthis assignment is to utilize concepts mastered and apply them in a real world setting. West Marine explores various themes including but not limited to the following: 1. Evaluate CPFR and its impact of a firm 2. Explore issues surrounding collaboration and coordination in a supply chain environment 3. Analyze the impact of mergers and acquisitions on supply chain management 4. Illustrate implementation challenges and propose solutions utilizing CPFR 5. Specify and analyze various costing issues 6. Assess risk and mitigation strategies II. Assignment Introduction: This real world case assignment is designed to help students evaluate the use of a collaborative approach to integrating across the SCOR processes of Plan, Source and Deliver (Customer Fulfillment) within the context of a retail environment. Teams will assess the firm’s supply chain before and after the implementation of CPFR. They will analyze the existing supply chain’s problems, propose solutions, and will critically evaluate the CPFR process—including its strengths, weaknesses, implementation challenges, and operational issues.
  • 121.
    III. Assignment Directions: Youare to develop a 17 slide professional PowerPoint presentation. You must use proper grammar, punctuation, spelling, sentence construction, proper paragraph usage, etc. Assume you will be using this deck in a presentation for corporate leaders within the West Marine organization! Therefore, you need to prepare the slides in a professional manner. For example--in a professional slideshow you would not use complete sentences on a particular slide…you would normally use bullet points. Also, graphs, URL’s to short video clips, etc. would be helpful. Please note I will be evaluating the slides in the presentation mode. If the slides cannot be read in that manner, you will lose points. Since you cannot answer the questions totally on the slides themselves, teams should use the Notes portion (see Notes page under the View tab of the PowerPoint slide presentation) of the PowerPoint slides for areas that require in depth explanation. When you utilize the Notes section, you are limited to the PowerPoint slide on the top of the Notes page and the information below it. All extra information about a particular slide must fit on that
  • 122.
    8.5 by 11portrait version of the Notes page for a particular slide. I would suggest on this portion of the slide to reference the question you are answering by stating on the first line Q1, Q2, etc. By seeing this marker--Q1, Q2, etc.--I will know what question you are answering. No need to repeat the questions--I know them. One of the early slides should include an agenda slideand/or objective slide--this slide is not counted toward the total. Also, you will be required to have a summary slide that includes a “next set of steps” recommendation--this slide is not counted toward the total. Please note: The team should place citations on the slides as needed that illustrate the problems/questions/goals/objectives, etc. you are trying to obtain. See the Course Schedule for due dates for these deliverables. IV. Assignment Guidelines and Requirements: 1. Your team’s responses should be organized into a PowerPoint presentation of approximately 17 slides. Is the presentation concise and succinct? 2. All extra information about a particular slide must fit on that 8.5 by 11 portrait version of the Notes page for a particular slide. 3. Utilize graphics or even a short video to help emphasize a particular concept or elaborate on an answer to a question. 4. Are the slides logically organized?
  • 123.
    5. Are propergrammar rules, punctuation, spelling, and sentence construction used? 6. Do the slides support, amplify, and clarify your answers? 7. Do the slides represent correct information? 8. Is the presentation visually attractive? 9. Do the slides have a common font, theme, etc.? 10. Does the PowerPoint deck contain an agenda slide, overview, or objectives slide? 11. Does the PowerPoint deck have a summary slide? 12. Please include a cover page that includes the team name, assignment name, date, and individual names of team members. 13. Please use proper citations on the appropriate slides when necessary. Do not plagiarize. 14. Points will be deducted for not following formatting directions and not answering all assignment questions. V. Assignment Questions: Note: The instructor reserves the right to change the points for this assignment and these questions at his discretion. Points shown below are only approximate and may change. Please answer the following questions in your presentation: Note: Question 1 through Question 5 pertains to WM after the
  • 124.
    E&B Marine acquisition. Question1: Please draw a schematic diagram of the West Marine supply chain. This diagram would fit somewhere between a process flow diagram and a value stream map. (20 total points) · Based upon the information in the case only, add all the information to the diagram that you would think a responsible supply chain manager would require using this diagram to help him/her analyze this supply chain. (For example number of sku's, inventory safety stock, etc.) · Utilizing the notes section of the slide, list the three most important bits of information (not mentioned in Part 1 above) you think would be beneficial to assist a supply chain manager in evaluating this supply chain. So, what information is missing from the case that you would like to know so that you could analyze the case more fully? This situation happens all the time in industry! · Briefly (and the key word is briefly) explain why you would need this information from Part 2 of the question. · How might you actually obtain the information in Part 3? Question 2: List and explain the primary dangers of executing an acquisition when the company does not have a solid supply chain foundation? Utilize the point in time just after the E&B
  • 125.
    acquisition. (20 totalpoints) · Sometimes when you are inside a company it is difficult to see the forest for the trees--always fighting today’s battles! Therefore, for this question place yourself in the position of a consultant with 100% complete access to West Marine via the case. · The intent of this question is for you to probe the case for the strategic dangers that lurk in the absence of a solid supply chain infrastructure · An average response will identify at least two dangers. A top- level response will identify four. Do not exceed four! I am not looking for extensive lists---I am looking for depth and breadth. Question 3: What supply chain improvements were necessary for WM to turnaround its supply chain performance? (20 total points) · The intent of this question is for you to probe the case for the most important underlying causes of the problems that WM must address. You must define the problem before you can solve the problem! · An average response will identify at least two improvements. A top-level response will identify four. Do not exceed four! I am not looking for extensive lists---I am looking for depth and breadth. · Also, be sure to explain or make an argument justifying why
  • 126.
    your solution solvesan existing problem. Question 4: Why is CPFR important? How did CPFR help WM address its supply chain challenges? (20 total points) · This question consists of two parts: Why and How! · Be specific and freely use examples from the case when responding to this question! The lack of examples from the case is a typical area where students lose points. Question 5: For WM what are the two most important ingredients needed to achieve “break through supply chain performance” utilizing CPFR? (20 total points) · Be specific and use examples from the case when responding to this question! The lack of examples from the case is a typical area where students lose points. Question 6: Is WM ready for the Boat U.S. acquisition….yes or no? What are its primary supply chain risks--especially as it relates to CPFR? What should the top priorities be in integrating the two organizations? Explain your reasoning and how it might tie back into previous modules. (20 total points) · For this set of questions, be certain that you focus on the Boat U.S. acquisition! · An average response will identify at least two items. A top-
  • 127.
    level response willidentify four. Do not exceed four! I am not looking for extensive lists---I am looking for depth and breadth. VI. Grading Criteria: West Marine PowerPoint Presentation Assignment: (The instructor reserves the right to change the grading criteria for this assignment without notice.) PowerPoint presentations are another communication device that stresses organizing thoughts in the appropriate hierarchy and sequence, selecting words for their power and expressiveness, using technical terms in appropriate contexts, and representing complex data and symbols precisely in prose. Analysis: 1. Does the PowerPoint deck answer each of the questions? 2. Does each answer to a question contain analysis of the major issues? 3. Does the analysis for each question incorporate concepts/techniques from all readings (including previous modules)?
  • 128.
    4. Does theanalysis show relationships among important factors? 5. Are assumptions explicitly stated? 6. Does the analysis isolate fundamental causes of the problems? 7. Does the analysis contain enough detail to support your answers? 8. When the analysis is undertaken, does it use the information at its disposal correctly, thereby leading to correct answers? 9. Does the presentation utilize the information and apply it to today’s business environment? Quality of Professional PowerPoint Slides: 1. Are the slides logically organized? 2. Are proper rules of grammar, punctuation, spelling, sentence construction, etc. are used? 3. Is the presentation concise and succinct—length 17 to 20 slides? 4. Do the PowerPoint slides support, amplify and clarify your answers? 5. Do the PowerPoint slides represent correct information? 6. Is the presentation visually attractive? 7. Was the Notes section in the PowerPoint utilized to add depth
  • 129.
    to the presentation? 8.Do the PowerPoint slides have a common font, theme, etc.? 9. Does the PowerPoint deck contain an agenda slide, overview, or objectives slide? 10. Does the PowerPoint deck contain a schematic of the supply chain that is under analysis? 11. Does the PowerPoint deck have a summary slide? Does it point out “next steps?” 12. Do the PowerPoint slides have graphics, a short video, etc. that help to emphasize particular points? You must explain in the Notes section how this clip adds to your answer. Overall Criteria: 1. Is the Power Point presentation logically consistent and effectively structured so it sells its ideas? Miscellaneous Comments
  • 130.
    Cover Sheet West MarineCase GRADE: __________ /200 Date Submitted: ____________________ Team Number: ____________________ Individual Team Member Names: Team Member’s Name ___________________________ Email_______________ Team Member’s Name ___________________________ Email_______________ Team Member’s Name ___________________________ Email_______________ Team Member’s Name ___________________________
  • 131.
    Email_______________ Team Member’s Name___________________________ Email_______________ 1 Discussion on International Trade Policy of Saudi Arabia with other Countries
  • 132.
    Instructions and stepsfor the assignment: 1. This is a group discussion assignment. You can form a team of up to 4 members. 2. Study the trade policy of Saudi Arabia and compare these policies with one any of its trading partners. 3. Read Chapter 6 and prepare a discussion report on the comparative study. The write up must clearly introduce the trading policies of the two countries and highlight the main discussion points of the team. 4. The discussion report must be prepared in a neat professional report format with the following sections a. Format (10 Marks): Title Page, Table of Contents, Appendices etc. b. Introduction: countries, background, discussion topic and reference to points to be highlighted c. Discussion (10 Marks): Detailed discussion of the trade policies of both countries (minimum 4 paragraphs) d. Analysis/ Evaluation(10 Marks): comparative study, reasons, impact, advantages, disadvantages etc. Do use original comparative tables, figures and graphs e. Conclusion(5 Marks): Your learning, how it was useful to understand the context and trade policies and its importance, how this knowledge would be used in your professional lives
  • 133.
    f. References (5Marks): minimum 5 sources reference from the recommended sites, research papers and journal articles 5. The team will then demonstrate their learning, evaluation of the cases and their own conclusions during the group discussion. (20 Marks): 6. Submit both soft copy and printed copy of the Assignment (instructions and the report as one file). 7. Research from relevant academic sources like research papers, journal articles and company websites is expected. BUS 412 International Business Semester 391 - Assignment 2 Discussion on International Trade Policy of Saudi Arabia with other Countries Student Name Format Discussion Analysis and Evaluation Conclusion References Group Discussion Total
  • 134.
  • 135.
    3 4 Recommended Sources forReference: 1. https://www.wto.org/english/thewto_e/countries_e/saudi_arabia _e.htm 2. https://www.wto.org/english/tratop_e/tpr_e/tp433_e.htm
  • 136.