Download to read offline
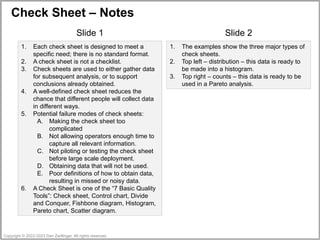
![Check Sheet – Several Examples
Copyright © 2022-2023 Dan Zwillinger. All rights reserved.
Obtaining the distribution of an item
https://commons.wikimedia.org/wiki/File:GAZ-24_Volga.svg
Counting defective items
Defect location
Date 6/1/2023
Inspector Charles
Vehicle stock #8347
Icon Defect type Count
dent II
scratched paint I
Monday Tuesday Wednesday Thursday Friday
Alan III II
Betty II II
Carol III
Dan I I
Eric I II III
Frank II
George I I
Harry II II
Defects observed
6/1/2023
widget #2
B34
2
A
B
Shift Machine Operator
Date
Product
Batch
A
1
B
Specified
weight
(grams)
Measured
difference
< -5 x x x x x x
(-3, -5] x x x x x x x x x
[-0.1, -3] x x x x x x x x x x x
0 x x x x x x x x x x x x
[0.1, 3] x x x x x x
(3, 5] x x x x
> 5 x x x
6/1/2023
widget #1
Bob
A23
139
Date
Product
Inspector
Batch
Observations](https://image.slidesharecdn.com/6in6checksheet-250110162635-5c557680/85/6in6-_-CheckSheet-pptx-2-320.jpg)

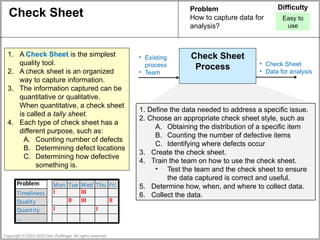
The document outlines the process of creating and utilizing check sheets for data capture and analysis in quality management. It emphasizes defining data needs, selecting appropriate check sheet styles, training teams, and ensuring data accuracy. Key points include the diverse purposes of different check sheets and common pitfalls to avoid during implementation.


