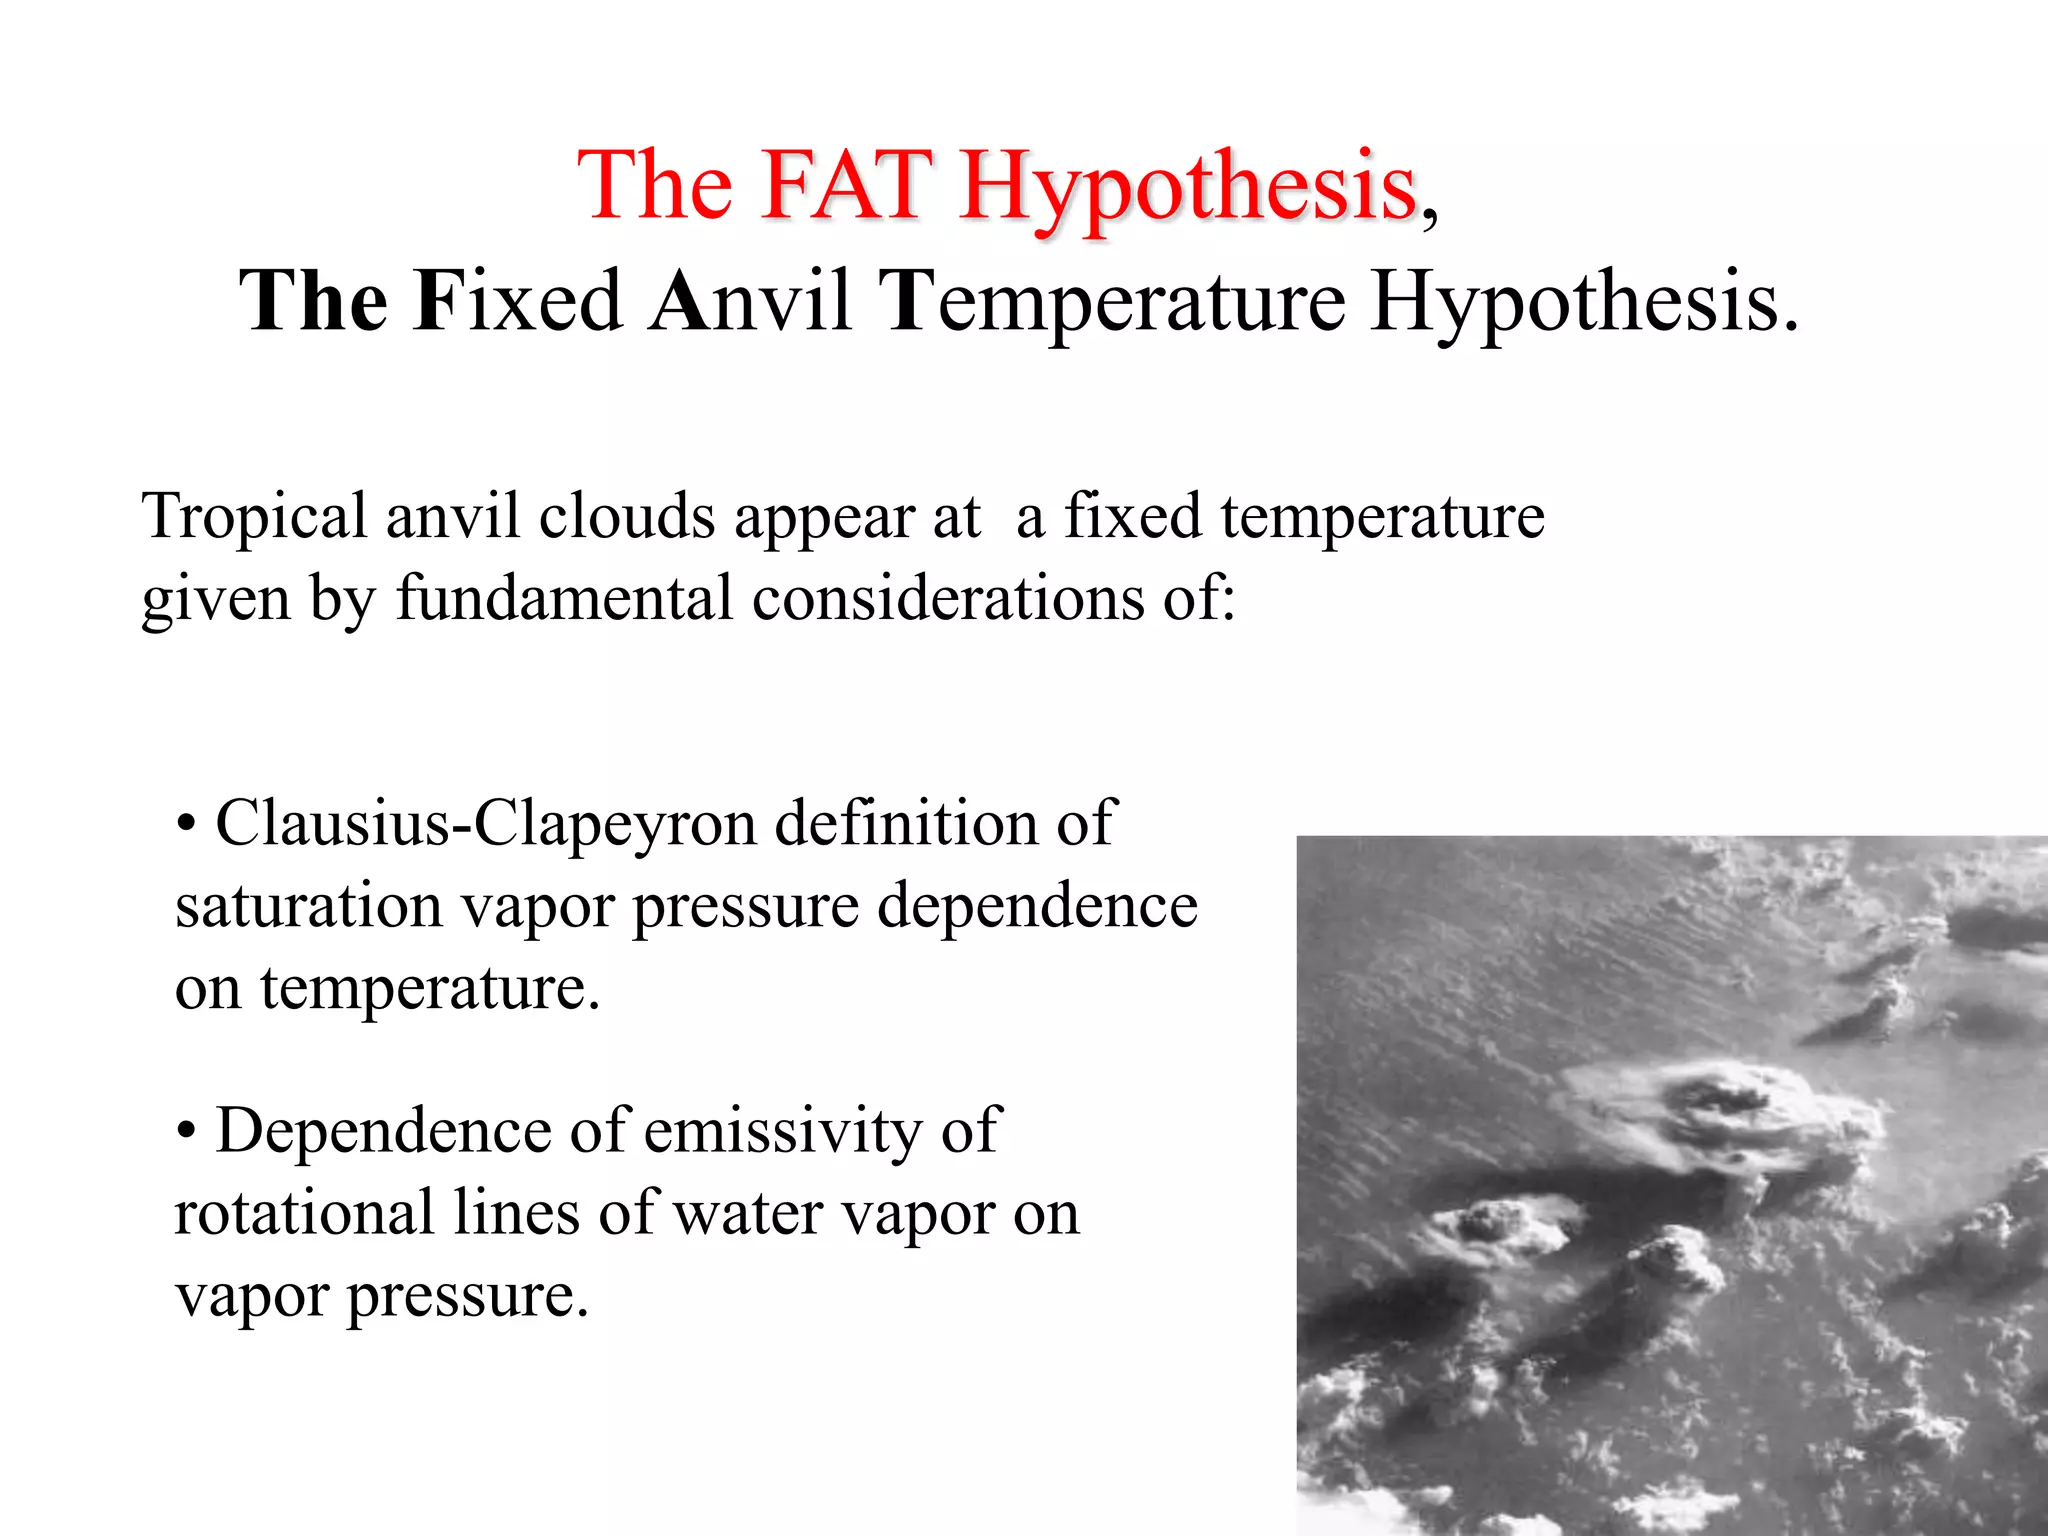
The document discusses the fixed anvil temperature (FAT) hypothesis, which proposes that tropical anvil clouds appear at a fixed temperature determined by fundamental radiative and thermodynamic considerations. It summarizes research using cloud-resolving models and climate models to test this hypothesis. The FAT hypothesis appears to explain the robust positive longwave cloud feedback seen in climate model simulations, as tropical high clouds may remain at approximately the same temperature as the climate warms.
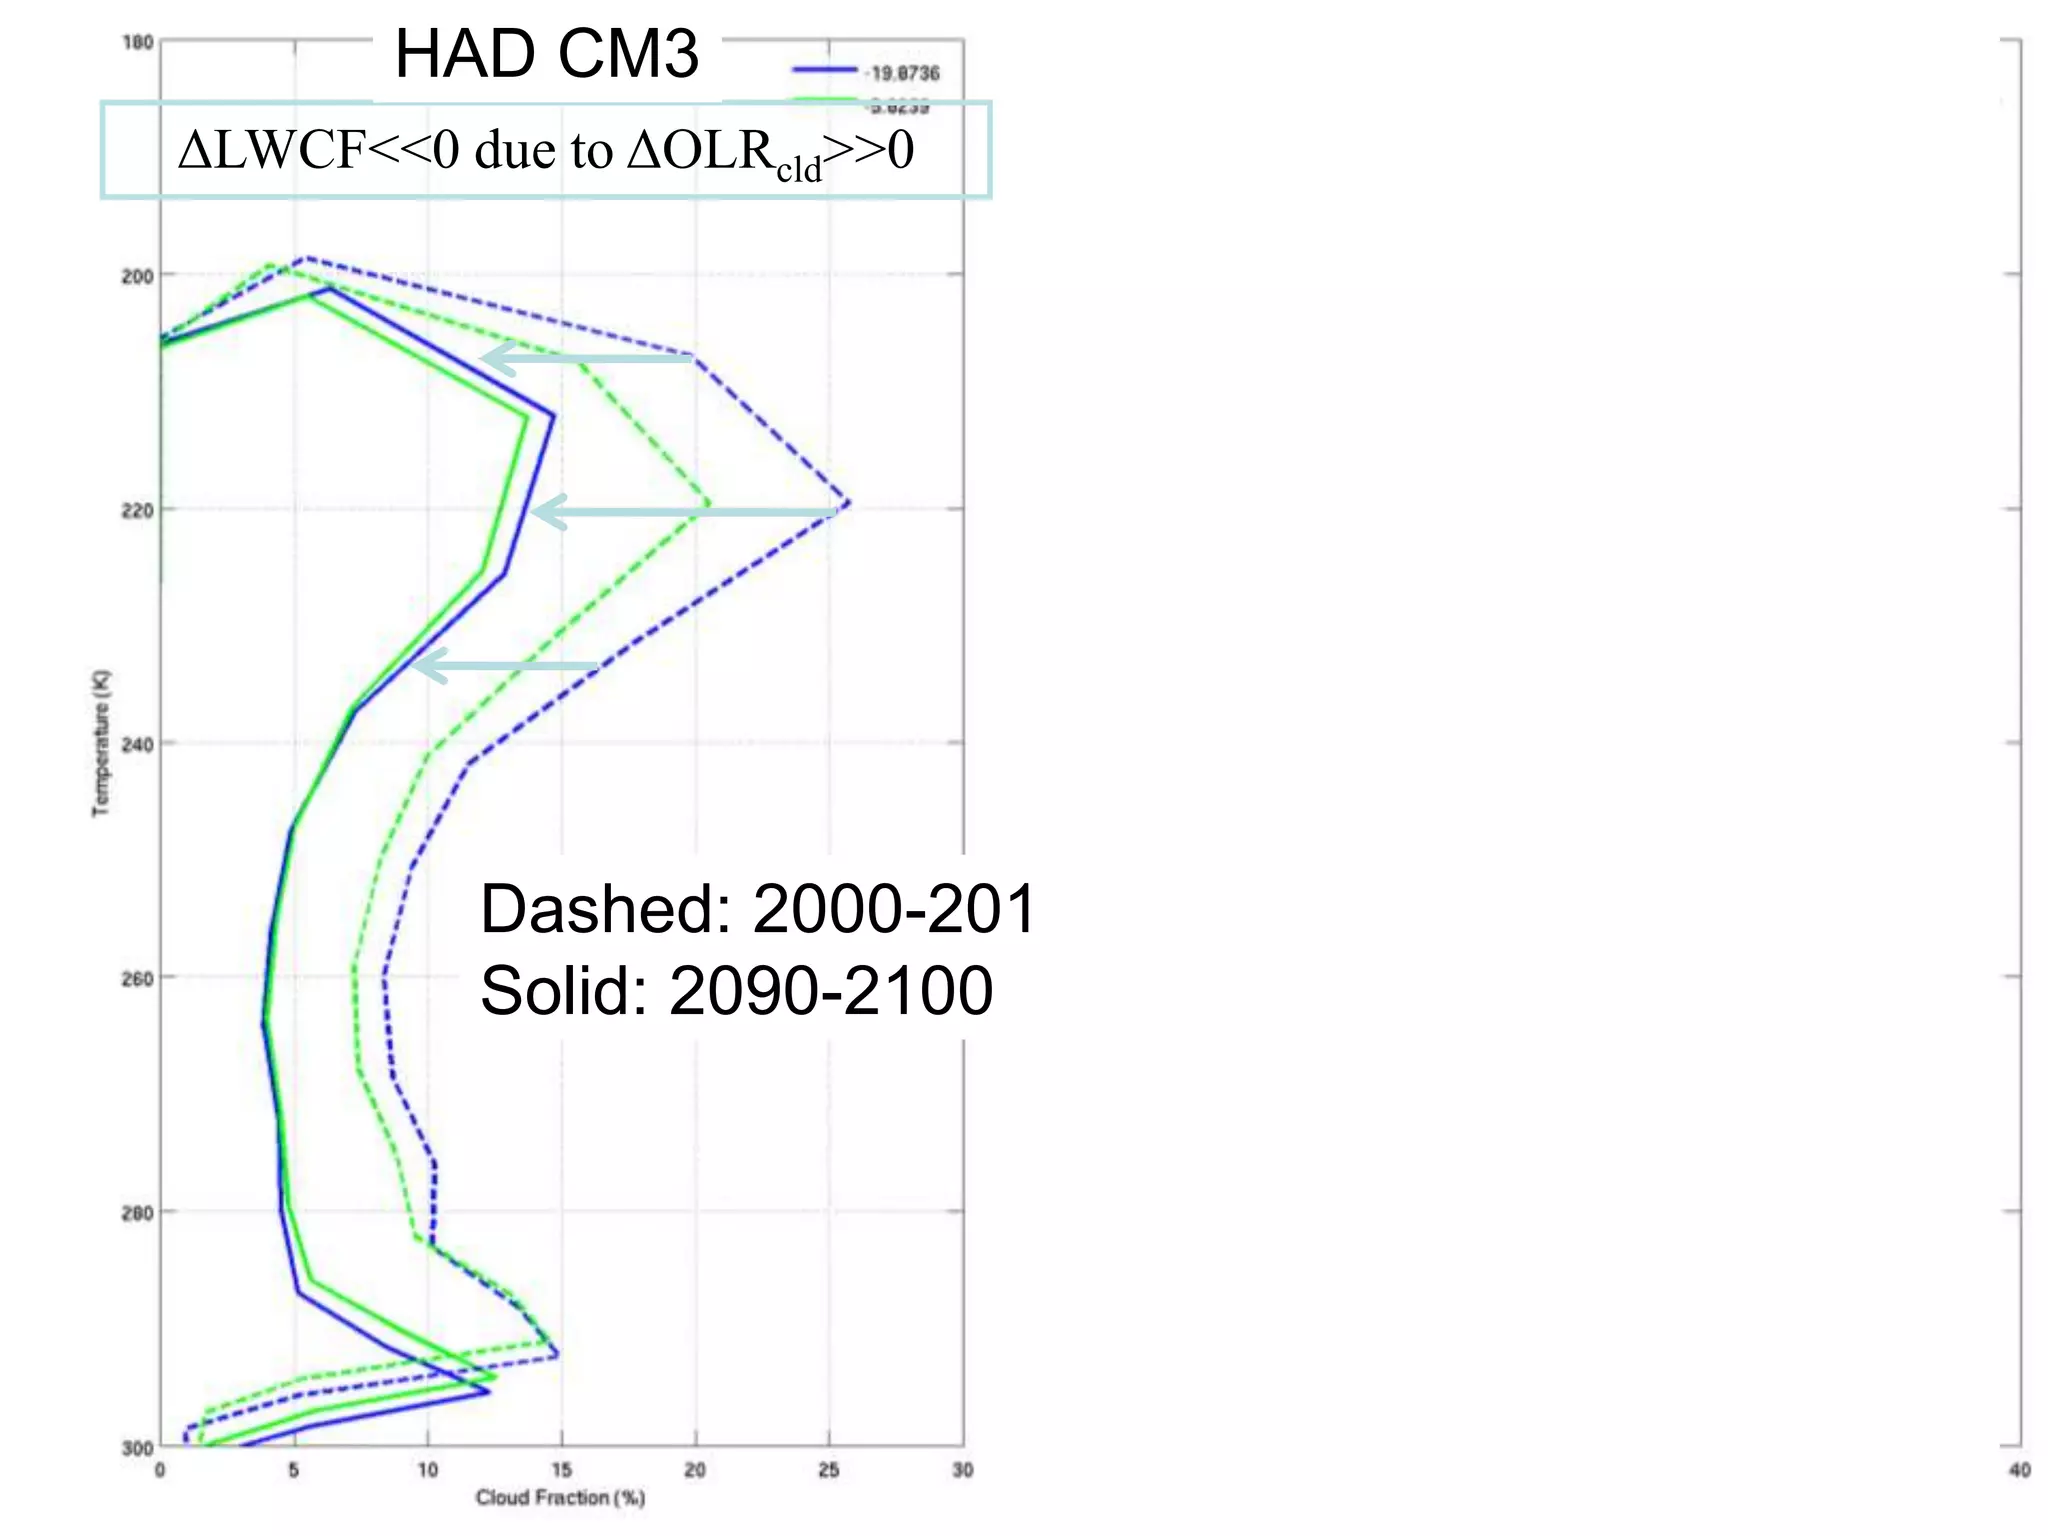
This document discusses key concepts related to heat transfer and climate control in the built environment. It defines temperature, heat, conductivity, resistance, and describes how heat flows through conduction, convection, and radiation. It explains how a building's design can control microclimate through passive structural elements or active mechanical systems. Specifically, it examines heat transfer processes between buildings and the outdoor environment, and characterizes periodic heat flow using time-lag and decrement factor.
The document proposes several extreme engineering solutions to address climate change, including a global electricity grid, harvesting wind energy from southeast Greenland, and direct air carbon capture with the captured CO2 used to produce synthetic green fuels. It summarizes a project called Katabata that installed three weather stations in southeast Greenland to measure wind speeds, finding that a regional model accurately simulated observed winds. It outlines a proposal for remote renewable energy hubs that use solar and direct air capture to produce green methane for shipping to consumption centers.
Here are the key steps to solve this problem:
1. Given: TH = 817°C = 817 + 273 = 1090 K
TL = 25°C = 25 + 273 = 298 K
QR = 25 kW
2. Use the Carnot efficiency equation:
η = (TH - TL)/TH = (1090 - 298)/1090 = 0.726
3. Set up an equation for the heat input using the efficiency and heat rejected:
QA = QR/(1-η) = 25000/(1-0.726) = 87500 kW
Therefore, the heat input (QA) required is 87500 kW.
Thermal qualities like temperature, heat, and heat transfer mechanisms are important for building design. Temperature is measured in degrees Celsius and heat is measured in joules. Heat transfers between objects through conduction, convection, and radiation based on temperature differences. A building's heat transfer is analyzed using factors like U-value, solar gain, ventilation rate, and time-lag. Maintaining a building's thermal balance requires considering all heat exchange between the interior and exterior environments.
Fundamentals of Heat and Mass Transfer, Theodore L. Bergman,.docxhanneloremccaffery
Fundamentals of Heat and Mass Transfer,
Theodore L. Bergman, Adrienne S. Lavine, Frank P. Incropera, David
P. DeWitt,
John Wiley & Sons, Inc.
•Chapter 1: Introduction
Conduction Heat Transfer
•Chapter 2: Introduction to Conduction
•Chapter 3: 1D, Steady-State Conduction
•Chapter 4: 2D, Steady-State Conduction
•Chapter 5: Transient Conduction
Convection Heat Transfer
•Chapter 6: Introduction to Convection
•Chapter 7: External Flow
•Chapter 8: Internal Flow
•Chapter 9: Free Convection
•Chapter 10: Boiling and Condensation
•Chapter 11: Heat Exchangers
Radiation Heat Transfer
•Chapter 12: Radiation Processes and Properties
•Chapter 13: Radiation Exchange Between Surfaces
1 Mass Transfer
•Chapter 14: Diffusion Mass Transfer
Chapter-6
(Introduction to Convection)
2
Chapter-6: Introduction to Convection (1/2)
6.1 The Convection Boundary Layers 378
6.1.1 The Velocity Boundary Layer
6.1.2 The Thermal Boundary Layer
6.1.3 The Concentration Boundary Layer
6.1.4 Significance of the Boundary Layers
6.2 Local and Average Convection Coefficients
6.2.1 Heat Transfer
6.2.2 Mass Transfer
6.2.3 The Problem of Convection
6.3 Laminar and Turbulent Flow
6.3.1 Laminar and Turbulent Velocity Boundary Layers
6.3.2 Laminar and Turbulent Thermal and Species
Concentration Boundary Layers
3
Chapter-6: Introduction to Convection (2/2)
6.4 The Boundary Layer Equations
6.4.1 Boundary Layer Equations for Laminar Flow
6.4.2 Compressible Flow
6.5 Boundary Layer Similarity: The Normalized Boundary Layer Equations
6.5.1 Boundary Layer Similarity Parameters
6.5.2 Functional Form of the
Solution
s
6.6 Physical Interpretation of the Dimensionless Parameters
6.7 Boundary Layer Analogies
6.7.1 The Heat and Mass Transfer Analogy
6.7.2 Evaporative Cooling
6.7.3 The Reynolds Analogy
6.8 Summary
4
Boundary Layers: Physical
Features
• Velocity Boundary Layer
– A consequence of viscous effects
associated with relative motion
between a fluid and a surface.
– A region of the flow characterized by
shear stresses and velocity gradients.
– A region between the surface
and the free stream whose
thickness ( ) increases in
the flow direction.
– Why does increase in the flow direction?
– Manifested by a surface shear
stress that provides a drag
force (FD).
– How does vary in the flow
direction? Why?
Thermal Boundary Layer
– A consequence of heat transfer
between the surface and fluid.
– A region of the flow characterized
by temperature gradients and heat
fluxes.
– A region between the surface and
the free stream whose thickness
increases in the flow direction.
– Why does increase in the
flow direction?
– Manifested by a surface heat
flux qsʹʹ and a convection
heat transfer coefficient h.
– If is constant, how doand h
vary in the flow d ...
This document summarizes a study that used a high-resolution climate model to examine how tropical cyclone activity responds to increased greenhouse gas forcing and solar forcing. The model was run with various prescribed sea surface temperature profiles and CO2 concentrations. The results showed that increased CO2 led to a strong direct decrease but also a strong indirect increase in tropical cyclone frequency due to higher temperatures. Solar forcing did not have the same effects as CO2 forcing. Environmental variables like potential intensity and vertical wind speed decreased in all simulations, suggesting they are important predictors of tropical cyclone changes. Geoengineering was deemed unlikely to effectively counteract increased CO2 forcing impacts on tropical cyclones.
Diffusion is the mass transport of atoms in solids by atomic motion. There are two main mechanisms: vacancy diffusion, where atoms exchange with vacancies in the lattice, and interstitial diffusion, where smaller atoms diffuse between lattice sites. The rate of diffusion depends on factors like temperature, activation energy, and the concentration gradient. Fick's laws can be used to calculate the flux of diffusing atoms and model diffusion processes. Controlling diffusion is important for applications like alloy processing and semiconductor doping.
The document discusses estimating air and snow surface temperature evolution in East Antarctica using passive microwave remote sensing. Key points:
- Passive microwave sensors have been monitoring Antarctica since the 1980s, providing multiple images per day, but the continent remains undersampled.
- Correlation analysis between brightness temperature (Tb) measurements from sensors and in situ snow/air temperature data show Tb is closely related to snow temperature at different depths.
- Linear regressions were used to retrieve snow temperatures at depths from 0-10 meters using Tb, achieving good correlation (R2 > 0.9) and standard errors around 2°C.
- Air temperature was also retrieved but with lower accuracy (RMSE 4-
Calibrating a CFD canopy model with the EC1 vertical profiles of mean wind sp...Stephane Meteodyn
For some projects, applying the basic rules of EC1 is not sufficient, and it is required to get a more accurate estimation of the wind speed on the construction site. This can be done by using computational fluid dynamics codes which have the advantage, both to take into account of the terrain inhomogeneity and to calculate 3D orographic effects. In this way, the orography and roughness effects are coupled as they are in the real world. However, applying CFD computations must be in coherence with EC1 code. Then it is necessary to calibrate the ground friction for low roughness terrains as well as the drag force and turbulence production in case of high roughness lengths due to the presence of a canopy (forests or built areas). That is the condition for such methods to be commonly used and agreed by Building Control Officers. In this mind, TopoWind has been developed especially for wind design applications and can be a very useful, practical and objective tool for wind design engineers. The canopy model implemented in TopoWind has been calibrated in order to get the mean wind and turbulence profiles as defined in the EC1 for standard terrains. In this way, TopoWind computations satisfy the continuity between the EC1 values for homogeneous terrains and the more complex cases involving inhomogeneous roughness or orographic effects
In this presentation, we discuss several major engineering projects that should be put in place for fighting climate change at a cheap cost. Among others: a global electrical grid, carbon capture technologies, power-to-gas devices.
Thermodynamics An Engineering Approach 5th Ed. (Solution).pdfMahamad Jawhar
This document provides an introduction to concepts in thermodynamics including classical vs statistical thermodynamics, conservation of energy, units of mass and force, states of systems, intensive vs extensive properties, equilibrium processes, and temperature scales. Key points covered include:
- Classical thermodynamics is based on experimental observations while statistical thermodynamics is based on particle behavior.
- Systems can be open, closed, or isolated depending on whether mass crosses system boundaries.
- Intensive properties do not depend on system size while extensive properties do.
- Equilibrium requires uniform temperature and balanced pressures throughout a system.
- Temperature scales include Celsius, Kelvin, Fahrenheit, and Rankine.
This document provides an introduction to concepts in thermodynamics including classical vs statistical thermodynamics, conservation of energy, units of mass and force, states of systems, intensive/extensive properties, equilibrium, processes, and temperature scales. Key points covered include: the second law of thermodynamics cannot be violated; pound-mass and kilogram-mass are units of mass while pound-force and kilogram-force are units of force; intensive properties do not depend on system size while extensive properties do; temperature and pressure must be uniform for equilibrium but pressure gradients are allowed; examples of thermodynamic processes like isothermal, isobaric, and isochoric; and conversions between Celsius, Fahrenheit, Kelvin,
This document discusses the effect of vibrational energy in supersonic flows. It summarizes research on modeling vibrational nonequilibrium using computational fluid dynamics. Key points include:
1) Vibrational energy becomes significant at high temperatures and collision rates in supersonic flows. Computational models must account for vibrational-translational nonequilibrium.
2) Several models for vibrational relaxation rates are evaluated, including Macheret, Millikan-White, and Sebacher correlations. Computed relaxation rates agree best with Macheret's model.
3) Simulations of flow over a blunt body show vibrational models are needed to predict correct thermal states, as exclusion of vibrational energy gives
This tutorial covers heat transfer via convection and radiation. It discusses:
- Natural and forced convection, and how to calculate heat transfer rates using surface heat transfer coefficients.
- Combining conduction and convection to solve problems involving multi-layer surfaces.
- The basic theory of radiated heat transfer, and how emissivity and surface shape affect heat transfer rates.
- Calculating effective surface heat transfer coefficients to model radiation using similar equations as convection.
- Worked examples are provided to demonstrate calculating heat transfer rates via combined conduction, convection and radiation in practical scenarios.
Convection involves determining the flow field, temperature field, and heat transfer coefficient (h) of a fluid. h can be determined from Newton's law of cooling, which relates heat flux to the temperature difference between a surface and fluid. A boundary layer exists near the surface where viscous effects dominate. Internal flows are confined by boundaries while external flows develop freely. Forced convection correlations relate the Nusselt, Reynolds, and Prandtl numbers to determine h. Average h over a surface can be determined by integrating local h values. The Reynolds analogy shows a relationship between frictional drag and convective heat transfer.
This document provides an introduction to concepts in thermodynamics, including:
- Classical thermodynamics is based on observations of particle behavior, while statistical thermodynamics is based on average particle behavior.
- A bicyclist gaining speed downhill involves converting potential to kinetic energy without energy creation.
- Mass, force, and units used in the English and SI systems are defined.
- Properties of open and closed systems, intensive/extensive properties, equilibrium, and different types of processes like isothermal and isobaric are introduced.
- Temperature scales, heat transfer, pressure, manometers, and barometers are also defined.
This document provides an introduction to concepts in thermodynamics and fluid mechanics. It defines key terms like intensive and extensive properties, equilibrium, quasi-equilibrium processes, and state. It discusses units like pound-mass, kilogram-mass, and gravitational acceleration. Examples solve for properties like density, mass, weight, and acceleration in various systems and processes. Temperature scales are also introduced along with conversions between Celsius and Kelvin.
Renewable energy sources like wind turbines, solar panels, and heat pumps provide alternatives to fossil fuels but have some limitations. Wind turbines have low capacity factors of 0.25-0.4 and require high upfront costs of £30,000 for a 6kW system. Solar panels cost £2,000-£4,000 installed for a house and save around £60-£92 per year in electricity bills. Photovoltaic solar cells have high costs of 60-70p/kWh currently and may not be cost competitive with retail electricity until after 2025. Ground source heat pumps can provide efficient heating but require extensive piping installed underground that may have long term temperature effects on the soil.
Impact of Electrification on Asset Life Degradation and Mitigation with DERPower System Operation
Distribution networks are currently faced with a plethora of changes in resources, equipment technology, structure, and loading. First, Distributed Energy Resources (DERs) have been increasingly penetrating distribution grids worldwide. DERs have been recognized as a Non-Wires Alternative (NWA) in certain use cases including peak shaving, renewable integration etc). The second imminent change in distribution networks is the electrification of loads, especially in the transportation and space heating sectors, driven at least in part by clean-air and sustainability goals. Electrification is expected to result in higher peak load levels as well as flatter daily and annual load shapes, due to the fact that it is primarily composed of off-peak and by storage-like loads like those of EVs, storage, and electric heating. Their valley-filling behavior results in distribution network apparatus being consistently loaded to high utilization levels.
As a result of these changes in load curve shape, distribution equipment may be subjected to increased operational stress compared to what it endured in the past, even if not loaded to higher net peak loads. For example, in the United States, the majority of distribution substation transformers typically warm up during the morning and afternoon as they approach demand peaks and then cool down afterwards as loading falls. Cumulative loss of life from this repetitive daily cycle is slow, so that expected service life of a typical unit is on the order of fifty years or more, even allowing for periods of intense overload during very rare contingencies. This has been the norm for the US electric utility industry in the last seventy years, but may no longer be the case in environments where electrification is more prevalent.
This document discusses condensation and film surface condensation on vertical surfaces. It defines condensation as the phase change from gas to liquid, and describes different types including surface, homogeneous, and direct contact condensation. For film surface condensation, it notes there are three regions - laminar, wavy, and turbulent - depending on the Reynolds number of the liquid film. It reviews the derivation of the laminar film condensation equation first solved by Nusselt, and improvements made by Sparrow and Gregg and Chen to account for inertia effects and vapor drag. Finally, it presents Chen's developed relation for calculating the heat transfer coefficient in the wavy and turbulent film regions.
The document discusses the relationship between greenhouse gas emissions, climate change, and global warming based on scientific data and models. It summarizes that carbon emissions can reliably predict increases in atmospheric CO2 levels, which can then be used to model radiative forcing and projected temperature increases. Feedback loops may accelerate warming beyond current predictions. The Arctic and Greenland are already experiencing significant impacts like sea ice loss and melting.
The document describes a method for retrieving column water vapor at night using mid-wave infrared bands from sensors like MODIS. It adapts an existing algorithm used to retrieve sea surface temperature that relies on the "same temperature criterion" - if the atmosphere is correctly characterized, surface temperatures derived from multiple bands should be the same. The algorithm uses a lookup table approach and can retrieve column water vapor, atmospheric temperature offset, and surface temperature using multiple pixels to reduce ambiguity. It is shown to work well when applied to MODIS data.
Night Water Vapor Borel Spie 8 12 08 Whiteguest0030172
The document describes a method for retrieving column water vapor at night using mid-wave infrared bands from sensors like MODIS. It adapts an existing algorithm used to retrieve sea surface temperature that relies on the "same temperature criterion" - if the atmosphere is correctly characterized, surface temperatures derived from multiple bands should be the same. The algorithm uses a lookup table approach and can retrieve column water vapor, atmospheric temperature offset, and surface temperature using multiple pixels to avoid ambiguities. It is shown to work well when applied to MODIS data.
The document discusses the physics of galaxy cluster plasmas, including convection processes like the Magnetothermal Instability (MTI) and Heat Flux-Driven Buoyancy Instability (HBI) that are driven by anisotropic thermal conduction. While clusters appear to be in global thermal equilibrium, local thermal instability can occur where the cooling time divided by the free-fall time is less than 10, allowing multiphase gas structures to form through thermal instability. Cosmological simulations show that heating from processes like AGN can self-regulate clusters to maintain a minimum cooling-to-free-fall time ratio of around 10 and minimum central entropy of 10-30 keV cm2, consistent with observations.
The equivalent wind chill temperatures in °F are plotted as a function of wind velocity in the range of 4-100 mph for ambient temperatures of 20, 40, and 60°F using EES. The plots show that equivalent temperature decreases with increasing wind velocity and decreases with decreasing ambient temperature. Wind chill has a greater effect at lower ambient temperatures.
1. A hydraulic lift uses a piston with a diameter of 210 cm to lift a weight of 2500 kg by applying a force of 25 kg to a smaller piston.
2. The pressure and diameter calculations show that the larger piston needs a diameter of 100 cm to lift the 2500 kg weight.
3. Pascal's principle and pressure calculations allow large weights to be lifted with little effort using hydraulic lifts.
The document discusses different techniques for generating and rendering virtual clouds in computer graphics. It begins with an introduction to real clouds and their properties. Two main approaches for virtual clouds are then covered: physically-based models using noise functions or fluid simulations to generate clouds, and volume rendering techniques like ray casting or splatting to render them. A key example of the splatting technique described is Dobashi's cloud rendering algorithm from 2000. The document outlines the various sections to come on further extending Dobashi's work, artistic cloud generation, and performance considerations for real-time rendering.
This document outlines an introductory course on assessing PCI compliance in cloud environments. It discusses the Cloud Security Alliance, PCI DSS requirements, cloud computing basics, security issues associated with cloud computing, and how PCI controls can be implemented in cloud environments. The goal is for participants to understand how to evaluate PCI compliance for merchants and service providers using cloud services and gain tools for planning and conducting such assessments.
The document discusses effective and secure use of cloud computing. It provides an overview of cloud computing definitions, models, characteristics and publications from NIST. It outlines some advantages of cloud computing including scalability, redundancy and automated security management. However, it also discusses challenges around data privacy, isolation, logging and dependence on secure hypervisors. The document proposes migration paths to cloud including public, private or hybrid cloud models and calls for standards to enable interoperability across cloud platforms.
Cloud computing allows users to access computing resources like servers, storage, databases, networking, software and more over the internet. It has several key advantages including scalability, reliability, accessibility and pay-per-use pricing. There are different definitions of cloud computing but most reference its ability to provide on-demand access to shared configurable computing resources that can be rapidly provisioned with minimal management effort. Cloud services follow three common models - Infrastructure as a Service (IaaS), Platform as a Service (PaaS), and Software as a Service (SaaS).
This document summarizes guidelines from the National Institute of Standards and Technology (NIST) on security and privacy for public cloud computing. It discusses key aspects of cloud computing including deployment models (public, private, hybrid, community clouds), service models (SaaS, PaaS, IaaS), and the security challenges of outsourcing IT services to public clouds. The document stresses that while public clouds can reduce costs, organizations are still accountable for security and privacy and must provide oversight of cloud providers through governance, risk management, auditing, and ensuring compliance.
This document discusses how cloud computing can enable business model innovation in the tourism industry. It provides an overview of key trends in the global tourism market and ecosystem. The tourism industry faces challenges around personalization, mobility, and sustainability. Cloud computing offers opportunities to reinvent IT and business models by improving efficiency, speeding time to market, and enabling new revenue streams. The document outlines IBM's enterprise cloud approach and how different types of organizations have adopted cloud services at various levels to both optimize costs and transform their businesses.
The document summarizes the research and work of the Cloud Security Alliance (CSA), a global non-profit organization focused on best practices for cloud security. It outlines that CSA has developed comprehensive best practices and tools for cloud security including the Cloud Controls Matrix, Consensus Assessments Initiative, Cloud Audit, and Cloud Trust Protocol. CSA also maintains the CSA STAR registry of cloud provider security assessments and conducts ongoing research to address emerging issues in cloud security, identity management, and other areas.
The document discusses several fundamental cloud architectures, including workload distribution architecture, resource pooling architecture, and dynamic scalability architecture. Workload distribution architecture uses load balancing to distribute workloads across identical IT resources. Resource pooling architecture groups identical IT resources into pools that are automatically synchronized. Dynamic scalability architecture dynamically allocates IT resources from pools based on predefined scaling conditions in response to usage demand fluctuations.
Software Engineering, Software Consulting, Tech Lead, Spring Boot, Spring Cloud, Spring Core, Spring JDBC, Spring Transaction, Spring MVC, OpenShift Cloud Platform, Kafka, REST, SOAP, LLD & HLD.
E-commerce Development Services- Hornet DynamicsHornet Dynamics
For any business hoping to succeed in the digital age, having a strong online presence is crucial. We offer Ecommerce Development Services that are customized according to your business requirements and client preferences, enabling you to create a dynamic, safe, and user-friendly online store.
Graspan: A Big Data System for Big Code AnalysisAftab Hussain
We built a disk-based parallel graph system, Graspan, that uses a novel edge-pair centric computation model to compute dynamic transitive closures on very large program graphs.
We implement context-sensitive pointer/alias and dataflow analyses on Graspan. An evaluation of these analyses on large codebases such as Linux shows that their Graspan implementations scale to millions of lines of code and are much simpler than their original implementations.
These analyses were used to augment the existing checkers; these augmented checkers found 132 new NULL pointer bugs and 1308 unnecessary NULL tests in Linux 4.4.0-rc5, PostgreSQL 8.3.9, and Apache httpd 2.2.18.
- Accepted in ASPLOS ‘17, Xi’an, China.
- Featured in the tutorial, Systemized Program Analyses: A Big Data Perspective on Static Analysis Scalability, ASPLOS ‘17.
- Invited for presentation at SoCal PLS ‘16.
- Invited for poster presentation at PLDI SRC ‘16.
Flutter is a popular open source, cross-platform framework developed by Google. In this webinar we'll explore Flutter and its architecture, delve into the Flutter Embedder and Flutter’s Dart language, discover how to leverage Flutter for embedded device development, learn about Automotive Grade Linux (AGL) and its consortium and understand the rationale behind AGL's choice of Flutter for next-gen IVI systems. Don’t miss this opportunity to discover whether Flutter is right for your project.
UI5con 2024 - Keynote: Latest News about UI5 and it’s EcosystemPeter Muessig
Learn about the latest innovations in and around OpenUI5/SAPUI5: UI5 Tooling, UI5 linter, UI5 Web Components, Web Components Integration, UI5 2.x, UI5 GenAI.
Recording:
https://www.youtube.com/live/MSdGLG2zLy8?si=INxBHTqkwHhxV5Ta&t=0
Neo4j - Product Vision and Knowledge Graphs - GraphSummit ParisNeo4j
Dr. Jesús Barrasa, Head of Solutions Architecture for EMEA, Neo4j
Découvrez les dernières innovations de Neo4j, et notamment les dernières intégrations cloud et les améliorations produits qui font de Neo4j un choix essentiel pour les développeurs qui créent des applications avec des données interconnectées et de l’IA générative.
SOCRadar's Aviation Industry Q1 Incident Report is out now!
The aviation industry has always been a prime target for cybercriminals due to its critical infrastructure and high stakes. In the first quarter of 2024, the sector faced an alarming surge in cybersecurity threats, revealing its vulnerabilities and the relentless sophistication of cyber attackers.
SOCRadar’s Aviation Industry, Quarterly Incident Report, provides an in-depth analysis of these threats, detected and examined through our extensive monitoring of hacker forums, Telegram channels, and dark web platforms.
Microservice Teams - How the cloud changes the way we workSven Peters
A lot of technical challenges and complexity come with building a cloud-native and distributed architecture. The way we develop backend software has fundamentally changed in the last ten years. Managing a microservices architecture demands a lot of us to ensure observability and operational resiliency. But did you also change the way you run your development teams?
Sven will talk about Atlassian’s journey from a monolith to a multi-tenanted architecture and how it affected the way the engineering teams work. You will learn how we shifted to service ownership, moved to more autonomous teams (and its challenges), and established platform and enablement teams.
What is Augmented Reality Image Trackingpavan998932
Augmented Reality (AR) Image Tracking is a technology that enables AR applications to recognize and track images in the real world, overlaying digital content onto them. This enhances the user's interaction with their environment by providing additional information and interactive elements directly tied to physical images.
DDS Security Version 1.2 was adopted in 2024. This revision strengthens support for long runnings systems adding new cryptographic algorithms, certificate revocation, and hardness against DoS attacks.
Zoom is a comprehensive platform designed to connect individuals and teams efficiently. With its user-friendly interface and powerful features, Zoom has become a go-to solution for virtual communication and collaboration. It offers a range of tools, including virtual meetings, team chat, VoIP phone systems, online whiteboards, and AI companions, to streamline workflows and enhance productivity.
A Study of Variable-Role-based Feature Enrichment in Neural Models of CodeAftab Hussain
Understanding variable roles in code has been found to be helpful by students
in learning programming -- could variable roles help deep neural models in
performing coding tasks? We do an exploratory study.
- These are slides of the talk given at InteNSE'23: The 1st International Workshop on Interpretability and Robustness in Neural Software Engineering, co-located with the 45th International Conference on Software Engineering, ICSE 2023, Melbourne Australia
OpenMetadata Community Meeting - 5th June 2024OpenMetadata
The OpenMetadata Community Meeting was held on June 5th, 2024. In this meeting, we discussed about the data quality capabilities that are integrated with the Incident Manager, providing a complete solution to handle your data observability needs. Watch the end-to-end demo of the data quality features.
* How to run your own data quality framework
* What is the performance impact of running data quality frameworks
* How to run the test cases in your own ETL pipelines
* How the Incident Manager is integrated
* Get notified with alerts when test cases fail
Watch the meeting recording here - https://www.youtube.com/watch?v=UbNOje0kf6E
Neo4j - Product Vision and Knowledge Graphs - GraphSummit ParisNeo4j
Dr. Jesús Barrasa, Head of Solutions Architecture for EMEA, Neo4j
Découvrez les dernières innovations de Neo4j, et notamment les dernières intégrations cloud et les améliorations produits qui font de Neo4j un choix essentiel pour les développeurs qui créent des applications avec des données interconnectées et de l’IA générative.
1. ”Tropical Clouds and Cloud Feedback”
The importance of radiative constraints
Dennis L. Hartmann
Department of Atmospheric Sciences
University of Washington
Seattle, Washington USA
Workshop on Large-Scale Circulations in Moist
Convecting Atmospheres
October 15-16, 2009
Papers online: Google Dennis L. Hartmann
2. Outline
• Motivation from AR4 simulations
• Radiation-Convection-Dynamics
Interaction
• Fixed Anvil Temperature
Hypothesis (FAT)
• Application of FAT to AR4 GCM
Simulation Interpretation
3. Courtesy of B. Soden
Net cloud feedback
from 1%/ yr CMIP3/AR4
simulations
SW and LW cloud
feedback
LW feedbacks positive and comparable magnitude.
SW feedbacks positive/negative, and dominate total feedback.
4. Clouds, Convection and Radiation
Atmospheric Energy Balance
• Atmospheric Energy Balance is Radiative –Convective
• Radiative Cooling = Latent Heating + Advection of Energy
• Clear-Sky Radiative Cooling is a key parameter.
5. Clear-sky Radiative Cooling and Relaxation:
In the tropical atmosphere, and the in the global atmosphere,
radiative cooling approximately balances
heating by latent heat release in convection.
The global mean precipitation rate is about 1 meter per year,
which equals an energy input of about 80 Watts/sq. meter,
Requiring a compensating atmospheric radiative cooling
of about 0.7 ˚K/day, averaged over atmosphere.
for tropical climatological conditions
-2.0 -1.0
Adiabatic
Heating
6. Atmospheric Radiative Cooling
Altitude vs Frequency
10 m
20 m 5 m
50 m
Harries, QJRMS, 1996
Upper
Troposphere
Cooling
from Water
Rotation Lines
Lower
Troposphere
Cooling
from Water
Continuum
6.7 m
7.
8. The FAT Hypothesis,
The Fixed Anvil Temperature Hypothesis.
Tropical anvil clouds appear at a fixed temperature
given by fundamental considerations of:
• Clausius-Clapeyron definition of
saturation vapor pressure dependence
on temperature.
• Dependence of emissivity of
rotational lines of water vapor on
vapor pressure.
9. ‘Cloud-Resolving’ Model 1km horizontal resolution
Doubly periodic domain
64km x 64km box with uniform SST (28, 30, 32C)
Bulk microphysics
RRTM radiation model
Basically a radiative-convective model in which the
Clouds are explicitly resolved at 1km resolution.
Run to equilibrium and average last 50 days.
Testing the FAT Hypothesis with a CRM.
Zhiming Kuang’s work: Updated by Bryce Harrop
11. Radiation
• Change the level of clear-sky convergence
• Two possibilities
– Remove water vapor to lower convergence level
– Add more water vapor to raise convergence level
• SAM model: Two different water vapor variables
– Bulk microphysics
– Radiation
12. Temperature
Base Case
Removal Case
Base Case
Altering Water Vapor in the Radiation Code Part I
qv,
stratospheric
Water Vapor (radiation only)
Water vapor change only applied to radiation calculation!!
Reduces emissivity =
Less cooling = ?
14. Base Case
Removal Case
Addition Case
Base Case
Removal Case
Water Vapor (radiation only)
Temperature
Altering Water Vapor in the Radiation Code Part II
qv,
stratospheric
Water vapor change only applied to radiation calculation!!
16. Radiative Control
• If you change SST, cloud temperature remains
about the same - FAT
• If you change the emissivity of the upper
troposphere in the Tropics, you can change the
cloud temperature and associated circulation.
In radiative-convective equilibrium in a CRM
17. Courtesy of B. Soden
Net cloud feedback
from 1%/ yr CMIP3/AR4
simulations
SW and LW cloud
feedback
LW feedbacks positive and comparable magnitude.
SW feedbacks positive/negative, and dominate total feedback.
18. Motivation: Why is the Longwave Cloud
Feedback Robustly Positive in the AR4
GCMs?
• We hypothesize that it is largely due to the fact
that tropical high clouds remain at approximately
the same temperature as the climate warms
• The clouds become higher as the surface
warms, but do so in such a way as to remain at
approximately the same temperature
• If high cloud emission temperature stays
constant (or warms less than the surface), then
this would lead to a positive cloud feedback,
assuming no change in cloud fraction.
19. Predicting level of abundant high
cloudiness from clear-sky balance
• Input to Fu-Liou code: tropical-mean profiles of
temperature and humidity averaged over decades
calculate net (LW+SW) radiative cooling
profiles
• Assume that this radiative cooling is balanced by
diabatic subsidence take vertical derivative to
get clear-sky UT convergence assume from
mass continuity that this is balanced by convective
detrainment should see clouds there
Mark Zelinka’s Work
24. Attempting to Quantify Contribution
of FAT to Longwave Cloud Feedback
First calculate ΔLWCF, then use radiative kernel
technique to estimate LW Cloud Feedback
Very difficult because cloud properties
are not saved and so cannot calculate radiative
effect of clouds
25. Compare ΔLWCF for ‘FAT’ and ‘FAP’
• FAT ΔLWCFtropics = Δfhi(OLRclr– OLRhicld) –
fhiΔOLRhicld – floΔOLRlocld + fΔOLRclr
• FAP ΔLWCFtropics = Δfhi(OLRclr–OLRhicld) –
fhiΔOLRhicld – floΔOLRlocld + fΔOLRclr
assuming that OLRhi = σCTT4 in which the CTT increases as much as
the temperature at a fixed pressure level (the initial cloud-weighted
pressure)
• Finally, apply the cloud mask as explained in
Soden et al. 2008 to convert ΔLWCF to LW cloud
feedback
28. Conclusion.
• One result of this is that the detrainment layer in the
Tropics tends to have a nearly fixed temperature as the
climate changes, or a nearly fixed anvil cloud temperature.
• Radiative Convective Equilibrium, constrained by
Clausius Clapeyron and basic radiation physics, seems to
be a strong constraint on the depth of the convective
layer in the Tropics.
• Another result of this is that climate models tend to give a
relatively strong positive cloud longwave feedback.
• Also, the Hadley Cell will deepen in pressure thickness
with global warming.
33. Attempting to Quantify Contribution
of FAT to Longwave Cloud Feedback
First calculate ΔLWCF, then use radiative kernel
technique to estimate LW Cloud Feedback
Very difficult because cloud properties
are not saved and so cannot calculate radiative
effect of clouds
34. Decomposing the change in LWCF for
cloud fraction (f)
and cloud properties
• If OLR = f OLRcld + (1-f)OLRclr then
LWCF = OLRclr – OLR = f (OLRclr – OLRcld)
• ΔLWCF = Δf (OLRclr–OLRcld) + f ΔOLRclr
– fΔOLRcld
36. Decomposing the change in
LWCF
• LWCF = OLRclr – OLR = f(OLRclr – OLRcld)
• ΔLWCF = Δf(OLRclr–OLRcld) + fΔOLRclr– fΔOLRcld
• This term dominates, but not because of warming
or cooling high clouds, but apparently because of
different abundances of high vs. low clouds (see
next slide)
38. Another ΔLWCF decomposition
• Let’s assume we can break OLRcld and f into
contributions from high and low clouds.
• We do this separation only in the Tropics
• Rather than trying to pretend like we know the
effective high and low cloud fractions, lets
assume that the high cloud-weighted
temperature is a reasonable estimate of the
high cloud emission temperature and that the
low cloud emission is the same as clear-sky
emission.
• Then we can determine what fhi and flo must
be such that fOLRcld = fhiOLRhicld + floOLRlocld
39. • [1] LWCF = OLRclr - OLR = f(OLRclr – OLRcld)
• [2] ΔLWCF = Δf(OLRclr – OLRcld) + fΔOLRclr – fΔOLRcld
• If we assume that f and OLRcld can be broken into a component
from high and from low clouds:
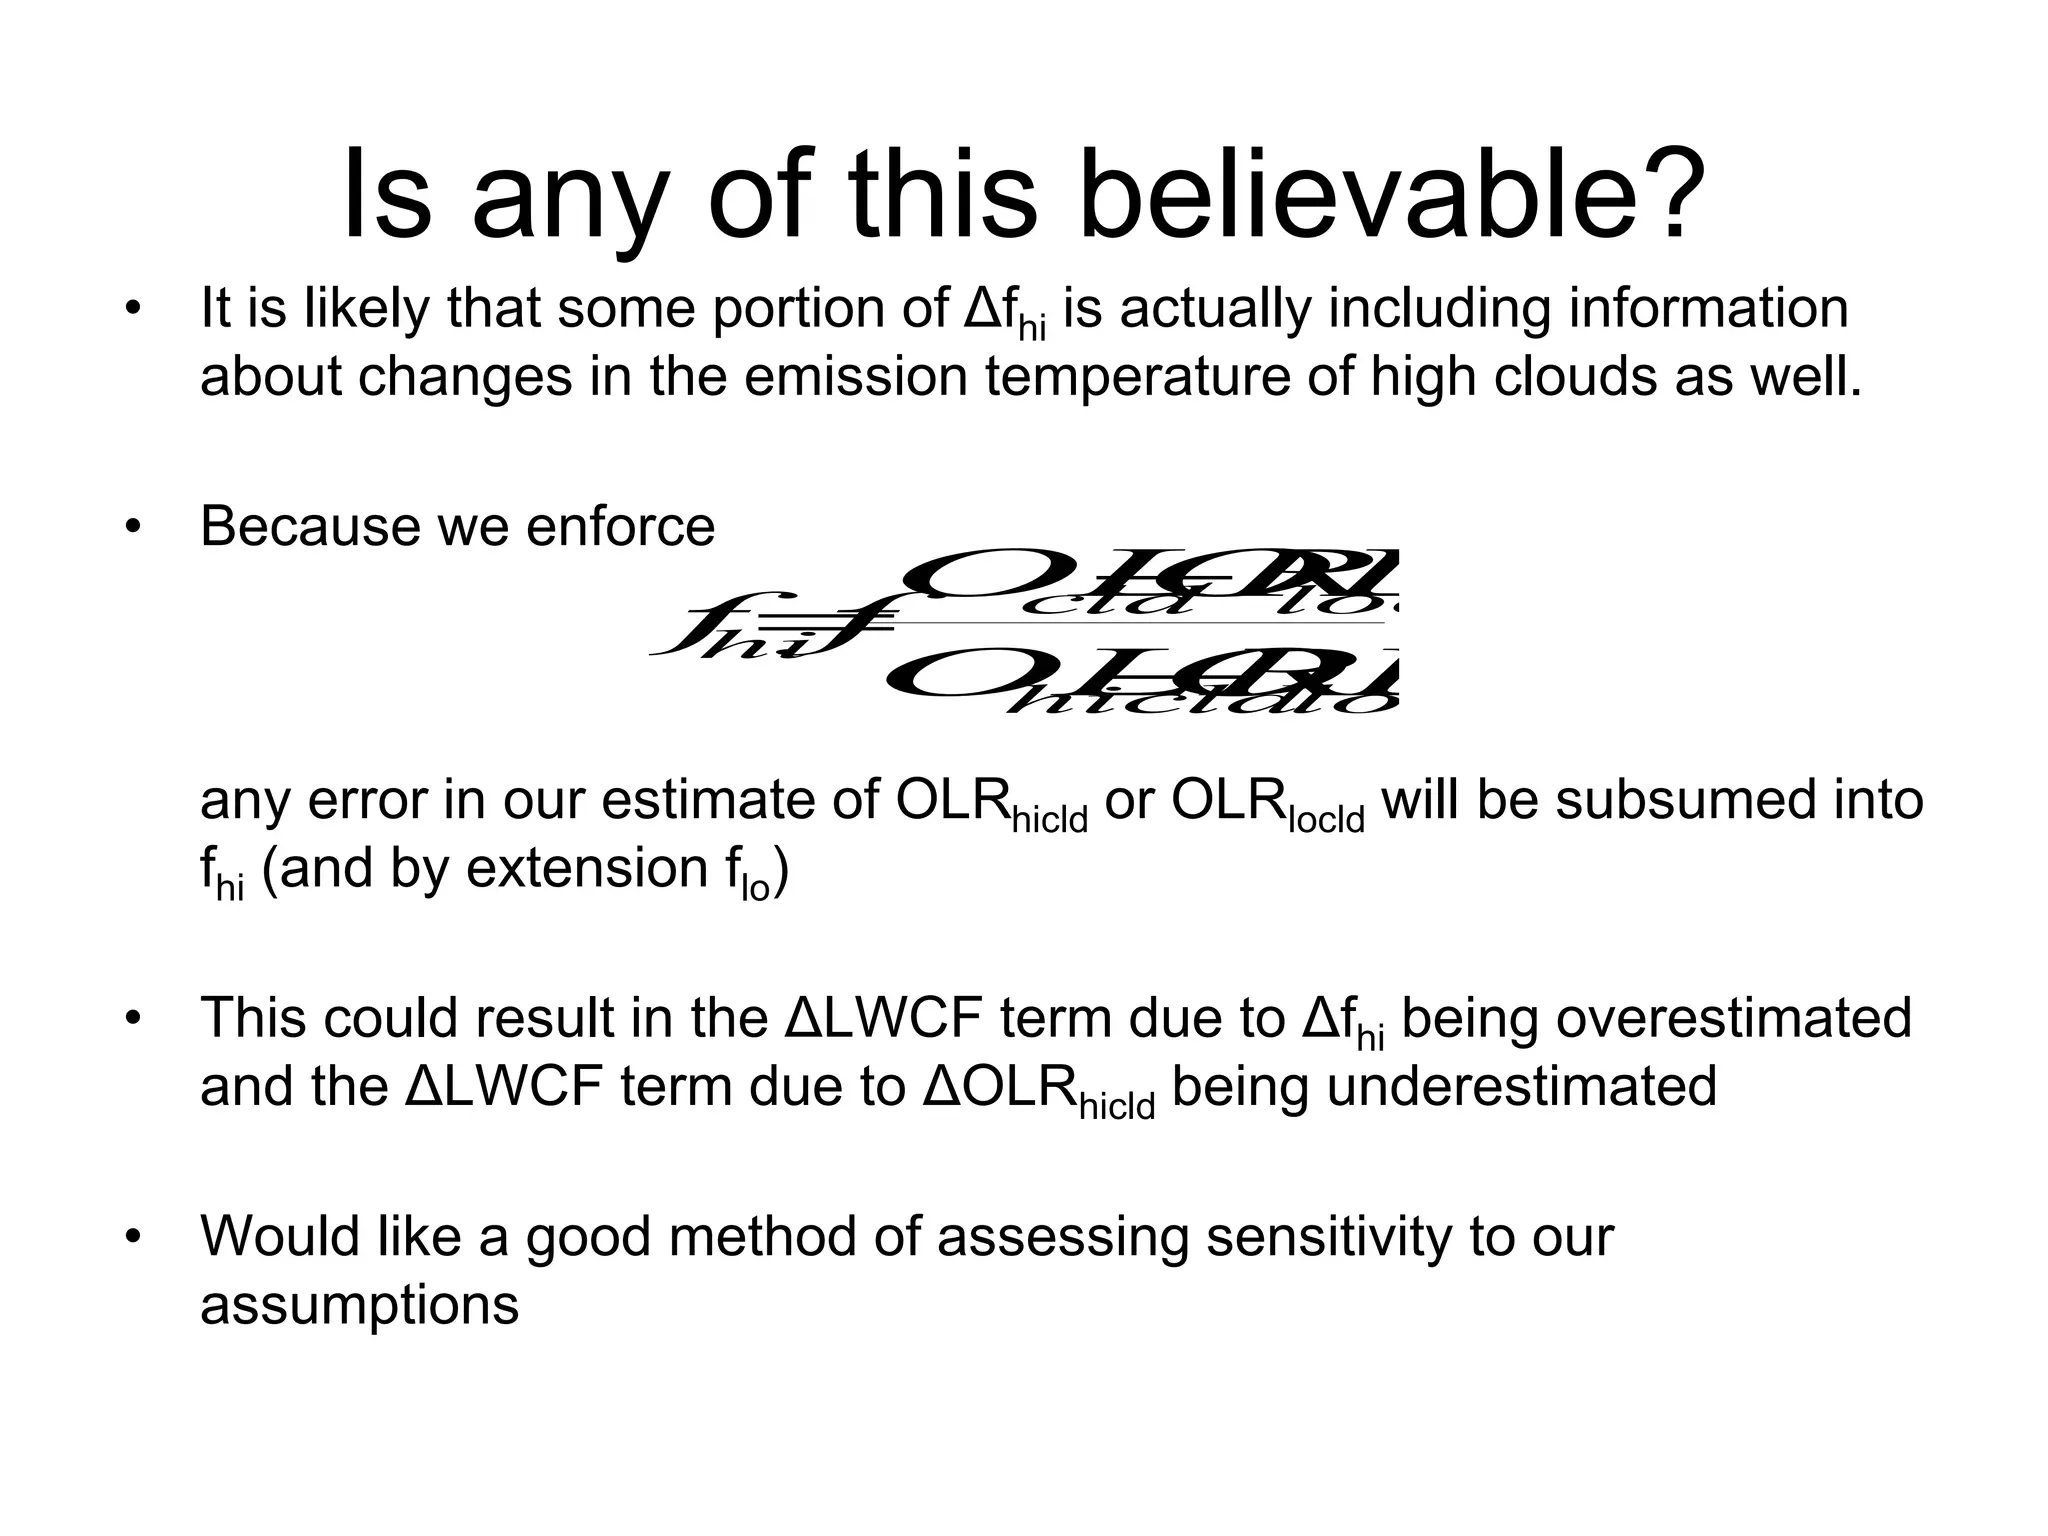
• [3] fOLRcld = fhiOLRhicld + floOLRlocld, where flo is the fraction of area
covered by low clouds that are not covered by high clouds
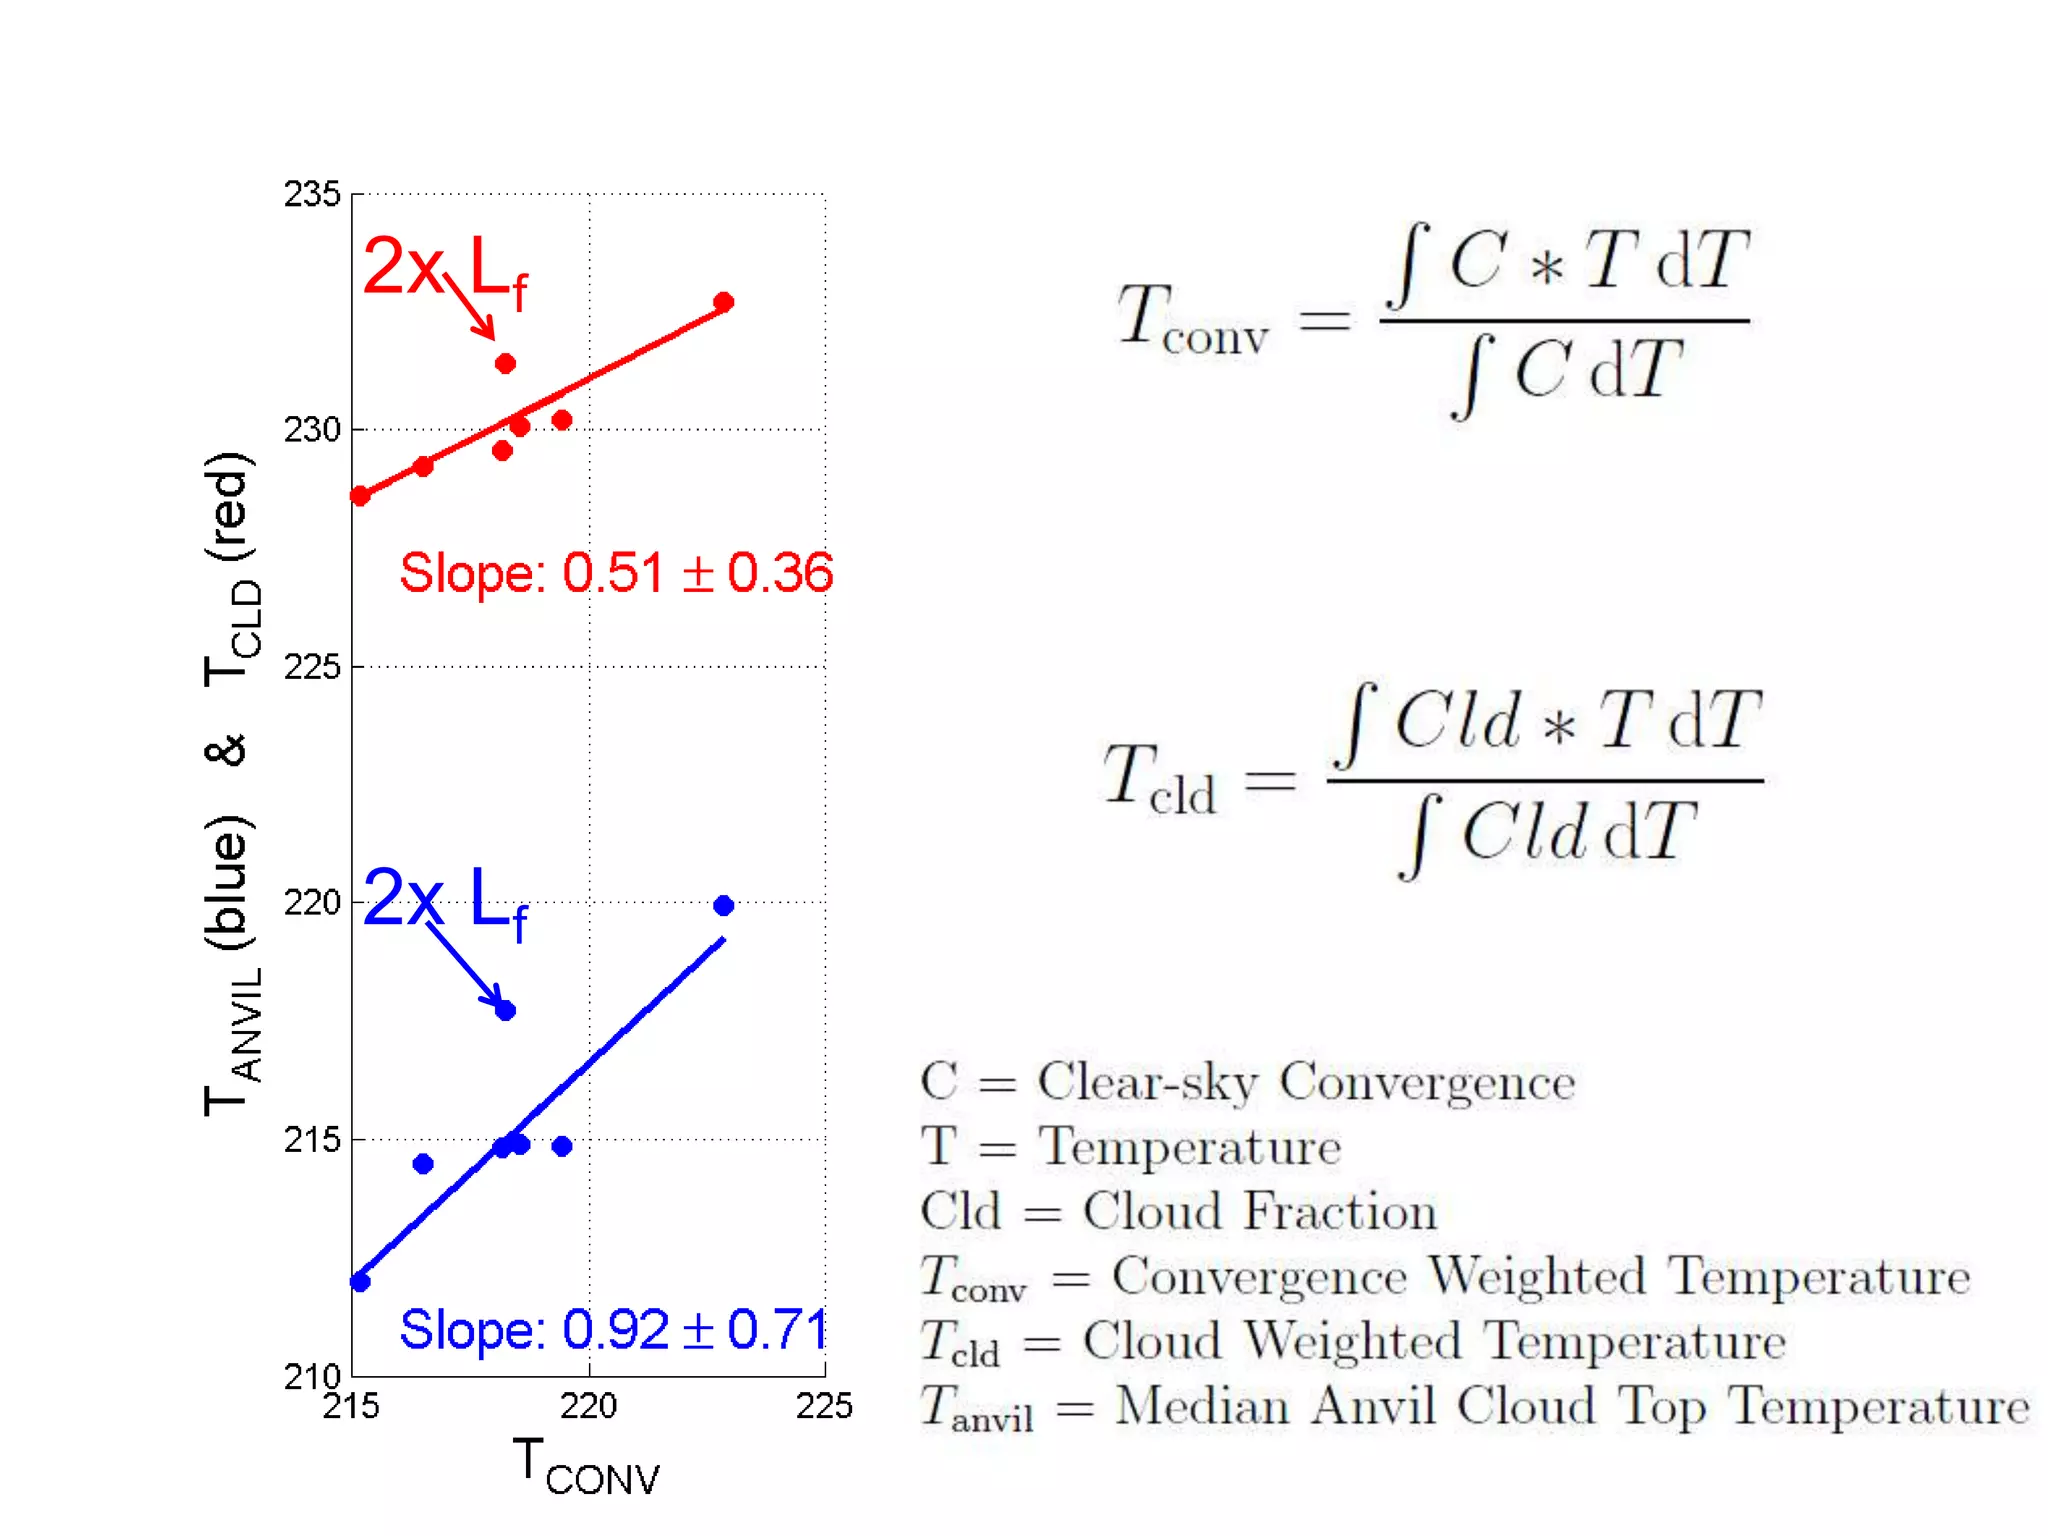
• Using a cloud-weighted temperature for clouds that are between
the freezing level and the tropopause as CTT, we write
[4] OLRhicld = σCTT4
• Using f = fhi + flo, we can solve [3] for fhi:
• [5]
where OLRcld is given by [1], OLRhicld is given by [4], and we
assume OLRlocld = OLRclr
• [6] ΔLWCF = Δfhi(OLRclr– OLRhicld) – fhiΔOLRhicld – floΔOLRlocld
+ f ΔOLRclr
locld
hicld
locld
cld
hi
OLR
OLR
OLR
OLR
f
f
40. So the formulas are….
• ΔLWCFtropics = Δfhi(OLRclr– OLRhicld) –
fhiΔOLRhicld – floΔOLRlocld + f ΔOLRclr
• ΔLWCFextra-tropics = Δf(OLRclr–OLRcld) –
fΔOLRcld + fΔOLRclr
41. Predictions from Clear-Sky
Radiative Cooling
• In the Tropics we should see two or three
levels of cloud.
– Boundary layer cloud - from strong radiative
cooling of moist, warm low level air - H2O
continuum
– High cloud from strong cooling under
tropopause by rotation bands of H2O
– Middle cloud from 6.7 micron V/R band
42. High
Middle
Low
Optical Depth
MODIS Temperature-Optical Depth Histogram
Eastern Equatorial Pacific Ocean
High-Anvil and
Cirrus Clouds
Middle-
Congestus
Low -
Cumulus+
Stratocumulus
Three Levels of Cloud
Tropopause
Kubar et al. 2007
43. Fundamental energy balance in atmosphere is:
Convective heating = Radiative Cooling
Question is, Which places a more fundamental
Constraint on the climate system in the tropics?
Answer: In the deep tropics radiative cooling,
particularly in clear skies, may provide a more
fundamental prediction of the depth of the
convective layer.
44. First Law of Thermodynamics
Using continuity in pressure coordinates
In Tropics ~
45. Fact: 200 hPa
Convective outflow and
associated large-scale
divergence near 200 hPa
are both associated with
radiatively-driven divergence
in clear skies.
Fact: The radiatively-driven
divergence in the clear regions
is related to the decrease of
water vapor with temperature
following the Clausius-Clapeyron
relation and the consequent
low emissivity of water vapor
at those low temperatures.
Hypothesis:
The temperature at which the
radiatively-driven divergence
occurs will always remain the same,
and so will the temperature of
the cloud anvil tops.
47. Use Cloudsat to detect cloud tops
and AMSR to estimate precipitation rate
Heavy rain is 90th Percentile, 10% of frequency,
but ~50% of total rainfall.
Kubar & Hartmann 2008
West Pacific East Pacific
48. Use Cloudsat to detect cloud tops
and AMSR to estimate precipitation rate
Heavy rain is 90th Percentile, 10% of frequency,
but ~50% of total rainfall.
Kubar & Hartmann 2008
49. Why should convection
stop/detrain at a fixed temperature?
Vapor pressure depends only on temperature,
and decreases exponentially as T decreases with altitude.
Emissivity (radiative relaxation time)
depends most importantly on vapor pressure.
Temperature where water vapor emissivity becomes small
is only weakly dependent on relative humidity and pressure.
Heating of air by condensation also becomes small
at this temperature
50. Larson and Hartmann (2002a,b) Model Study:
MM5 in doubly periodic domain
a) 16x16 box with uniform SST (297, 299, 301, 303K)
b) 16x160 box with sinusoidal SST
Clouds and circulation are predicted
Clouds interact with radiation
Basically a radiative-convective model with
parameterized convection, in which the large-scale
circulation is allowed to play a role by dividing
the domain into cloudy (rising) and clear (sinking) regions.
Testing the FAT Hypothesis in a model.
c) 16x16 box with uniform SST and rotation.
52. The temperature at which
the radiative cooling reaches
-0.5 K/day remains constant
at about 212K.
The temperature at which the
visible optical depth of upper
cloud reaches 0.1 remains
constant at about 200K.
The temperature of the
200 hPa surface increases
about 13K, while the
surface temperature rises
6K.
53. Kuang &Hartmann, J. Climate 2007
CRM in Rad/Conv. Equilibrium
28˚C, 30˚C and 32˚C SST
Cloud Fraction versus Air Temperature
6˚C
57. Test Impact of Radiation
Same SAM framework as Kuang & Hartmann
• Alter the water vapor that the radiation
code sees to change the emissivity of the
upper tropical troposphere.
• Expect that increasing upper tropospheric
radiative cooling vapor will cool the
average cloud tops, and vice versa.
Bryce Harrop’s work
61. Convergence computed
from clear-sky radiative
cooling, and
Cloud fraction from MODIS
plotted versus
air temperature (solid)
for
West Pacific (WP)
and East Pacific (EP)
221K
217K
Good agreement between
clear-sky divergence and
cloud fraction.
Kubar et al. 2007
62. Kubar et al (2007)
MODIS Anvil Top vs Convergence Temperature
Kubar et al. 2007
66. Radiation and Lf Adjustments: Comparing Tconv and Tcld
2x Lf
2x Lf
67. Conclusions
• When the radiation is changed, the cloud
profile adjusts so that the cloud amount
peaks near the level of clear-sky
convergence.
• A relationship exists between convergence
weighted and cloud weighted
temperatures.
68. AR4 Climate Simulations
Robust Longwave Cloud Feedback
• All AR4 models produce a similar positive
longwave cloud feedback, compared to
the large variability in shortwave cloud
forcing.
• Can basic constraints like saturation vapor
pressure and radiative cooling explain this
consistency in the models?
Mark Zelinka’s work
69. Is any of this believable?
• It is likely that some portion of Δfhi is actually including information
about changes in the emission temperature of high clouds as well.
• Because we enforce
any error in our estimate of OLRhicld or OLRlocld will be subsumed into
fhi (and by extension flo)
• This could result in the ΔLWCF term due to Δfhi being overestimated
and the ΔLWCF term due to ΔOLRhicld being underestimated
• Would like a good method of assessing sensitivity to our
assumptions
locld
hicld
locld
cld
hi
OLR
OLR
OLR
OLR
f
f
70. Δfhi(OLRclr – OLRhicld)
– fhiΔOLRhicld
f ΔOLRclr
– floΔOLRlocld
Δfextra-tropical(OLRclr – OLRcld)
– fextra-tropicalΔOLRcld
ENSEMBLE MEAN
ΔLWCF
71. Tropical-Mean Results
• Varying degrees of agreement between UT convergence and level
of high cloud abundance in models
• In all models, both convergence- and cloud-weighted pressure
(temperature) decrease (VERY slightly increase) in a nearly 1:1
fashion, but with a nonzero y-intercept (see previous point)
• Tropical mean UT convergence and high cloud amount decrease
slightly over the course of the 21st century (enhanced static stability
out-pacing enhanced radiative cooling – see previous slide)
– Can this explain Trenberth and Fasullo’s results about decreases in
cloudiness allowing for more absorbed shortwave (next slide)?
– Also, if high cloud coverage strongly impacts absorbed shortwave, and
static stability vs. radiative cooling determines high cloud coverage, then
this implies some dependency of SW cloud feedback on lapse rate
feedback (at least in the tropics)
• Those models with larger (negative) lapse rate feedback should tend to have
larger positive (or less negative) SW cloud feedback due to this effect
because strong increases in static stability will cause strong decreases in
high cloud cover (I guess it depends on the importance of high clouds
changes for SW cloud feedback)
72.
73. Issues (1 of 2)
• Clouds plotted in previous figures are total cloud fraction in each pressure bin
reported by the model: There is no information about cloud optical properties,
nor does it provide information about cloud tops, which are emitting to space.
• Can look at ISCCP simulator output from models that have participated in
CFMIP, but
– there are no CO2 scenarios, just 2XCO2 runs with slab oceans
– The ISCCP pressure bin resolution is inadequately poor (7 vertical bins)
• Have done simulations with the GFDL model in aquaplanet mode at .5x, 1x,
2x, and 4x CO2 using the ISCCP simulator – results look similar to here, but
with more dramatic warming of high clouds / UT convergence and more
dramatic decrease in high cloud coverage more dramatic because of factor
of 8 variation in CO2?
• To what degree should model clouds be collocated with the UT diabatic
convergence? Probably depends on details of each model’s convective
parameterization (detrainment based on neutral buoyancy?). Very thin stuff
near tropopause probably unrelated to detrainment – but we don’t know how
much of that type of cloud is represented in these profiles
• Still need to show that the prevailing thought that detrainment occurs once the
parcels reach neutral buoyancy is either incorrect or is consistent with this – if
74. Issues (2 of 2)
• Probably should be running the Fu-Liou code for each lat, lon, & season
rather than just for tropical-mean annual-mean profiles currently working
with Marc to run Fu Liou code more efficiently than I have been (currently
have a Matlab script that calls the fortran code)
• Very difficult to be quantitative: can only say that – in all the models – the
entire cloud profile rises vertically but as a function of temperature the cloud
profile stays nearly constant (warms slightly). (How realistic is the cloud-
weighted temperature as a proxy for CTT?)
• Two issues with using tropical-mean temperature and humidity profiles as
input to the Fu-Liou code
– 1. mean profiles calculated from clear-only regions will likely be different
(certainly drier) than those calculated from both clear and cloudy this will
affect the shape and magnitude of UT convergence (need to assess sensitivity)
– 2. The presence of clouds alters the radiative cooling rates substantially. This is
much more difficult to take into account in the radiation code, since one needs to
know more about the cloud properties than is provided in the AR4 diagnostics. It
is not clear to me to what extent real-world UT detrainment is affected by clouds
in the surrounding regions altering the radiative cooling rate.
75. Rainrates from two different algorithms.
TOP: Satellite-derived method, based on cloud top temperature;
BOTTOM: Derived from Microwave Sounding Unit, (Figure from Berg et al. 2002)
76. Modeling Tropical Convection
in a Box or on a Line.
The first set of experiments will be from a 3D doubly-
periodic model run with fixed forcing in a dx=1km
256km x 256km domain with 64 levels, also use 2D version.
The dynamics are anelastic, the radiation is that of the
NCAR CCM.
For this study we will use the SAM model from CSU.
Khairoutdinov and Randall (2003)
The cloud physics scheme has conservation equations for
total water and precipitating water,
apportionment among types is based on temperature.
Note that 3D model has 5m/s shear imposed.
77. 3-D Model
External forcing from Reanalysis for EP and WP,
but use same SST of 302.49K
converting cloud in to precip.
Top Heavy
Bottom-Heavy
79. Use 2-D to Test Sensitivity
• Use same SAM model in 2-D version
• Apply SST sinusoid to force circulation.
• No external forcing other than SST and Radiation
80. Thin Anvil Thick
Middle
Low
Optical Depth
MODIS Temperature-Optical Depth Histogram
Eastern Equatorial Pacific Ocean
High-Anvil and
Cirrus Clouds
Middle-
Congestus
Low -
Clumulus+
Stratocumulus
Three Levels of Cloud
Tropopause
Kubar et al. 2007
81. We will see that,
with same microphysics
2-D model has similar strengths and
weaknesses as 3-D Model
• Decent thick and thin cloud distributions, but
• Anvil clouds (intermediate optical depths)
are too few and do not have correct
dependence on precipitation rate.
82. Validation Methodology
• Average over comparable subdomains - about
100km square sub-domains to define local precip
and cloud properties.
• Use precipitation rate as an independent variable.
• Tests relationship of cloud stuff to precipitation
rate
• Works equally well for column model, regional
model, global model and data.
• Don’t have to adjust anything about methodology
in going from 3D to 2D
83. Test 3-D & 2-D run against Satellite Data
a la Kubar et al. 2007
Thick
Cloud
- about
right
2-D Base
Lopez et al. 2007
AMSR
MODIS
84. Test 3-D run against Satellite Data a la
Kubar et al. 2007
Anvil
Cloud
Error
2-D case
Lopez et al. 2007
85. Test 3-D run against Satellite Data
Albedo & OLR PDFs - Domain Mean
Anvil Cloud is Missing
Lopez et al. 2007
Anvil Cloud
Signature
86. Use 2-D to Test Sensitivity
Summary:
• We can increase ice cloud by reducing ice
sedimentation, but this also increases thick
cloud unrealistically.
• Increasing the Autoconversion/Accretion
rate reduces the thick cloud preferentially.
• AA rate preferentially controls water cloud,
which is responsible for thick cloud fraction.
• Accretion is more important than
autoconversion.
87. Adjustments suggested by 2-D
Sensitivity Tests
• We need to increase ice and decrease water
to get the right albedo distribution of cold
cloud.
• This means decreasing ice sedimentation,
while increasing accretion of cloud water.
88. Use 2-D to Test Sensitivity
Multiple Changes
• NOSED - set ice sedimation velocity to zero,
but lower threshold for autoconversion of ice
by a factor of 100.
• AALIQN - increase liquid water accretion
rate by factor of N.
• NOSEDAALIQ5 - NOSED, plus increase
liquid water accretion by factor of 5.
89. Multiple Changes to Cloud Physics
2D Results
2-D Base
Thick
Cloud
Lopez et al. 2007
90. Multiple Changes to Cloud Physics - 2D
2-D Base
Anvil
Cloud
Lopez et al. 2007
91. Use 2-D to Test Sensitivity
Multiple Changes
• We found a set of cloud physics parameters
that produces better anvil cloud amounts and
maintains the observed amount of thick
cloud as a function of rain rate -
NOSEDAALIQ5.
• Let’s put these back in the 3-D West Pacific
run and see what happens.
92. Improvement!
• Cloud Forcing looks more reasonable.
Cloud fraction climbs out of sight!
But most is thin cloud, and high coverage of
thin cloud may not be unreasonable
for the conditions of the simulation.
Lopez et al. 2007
93. Conclusions
• Satellite data can be used to effectively test
CRM cloud simulations, and GCM’s too.
• It is very effective to do the test as a
function of rain rate.
• Something approaching the observed
behavior of convective cores, anvil clouds
and thin clouds can be achieved with
judicious tuning of a simple bulk scheme.
• Work continues. . .
94.
95. Multiple Changes to Cloud Physics - 2D
2-D Base
Thin
Cloud
Lopez et al. 2007
96. Test 2-D run against Satellite Data a la
Kubar et al. 2007
Thin
Cloud -
Not bad
2-D case
Lopez et al. 2007
3D WP
3D EP
100. General Approach
• Focus on Pacific ITCZ regions
• Observe and model same regions. EP &WP
• Average over comparable subdomains -
about 100km square subdomains to define
local precip and cloud properties.
• Use precipitation rate as an independent
variable.
101. Testing the Relative Roles of Radiation
and Latent Heating in Determining the
Temperature of Tropical Cloud Tops
Bryce Harrop
102. Clouds and Radiation in the
Tropics
• Greatest uncertainty in clouds
• Changing cloud forcing can drive changes in
worldwide circulations
103. LWCF = Fclear - Ftotal
Weak
LWCF
Strong
LWCF
COLD
WAR
M
112. Xu et al (2007)
L
A
R
G
E
M
E
D
I
U
M
S
M
A
L
>300km
150-300km
100-150km
113. Future Work
• How do the moist thermodynamics influence
the cloud level?
• Is there a relationship between Tconv and Tcld
when we change the moist thermodynamics?
• Can we modify the moist thermodynamics in
such a way that the cloud will reach a different
level than the clear-sky convergence?
124. Atmospheric Radiative Cooling
Altitude vs Frequency
10 m
20 m 5 m
50 m
Harries, QJRMS, 1996
Upper
Troposphere
Cooling
from Water
Rotation Lines
Lower
Troposphere
Cooling
from Water
Continuum
6.7 micron
125. High
Middle
Low
Optical Depth
MODIS Temperature-Optical Depth Histogram
Eastern Equatorial Pacific Ocean
High-Anvil and
Cirrus Clouds
Middle-
Congestus
Low -
Cumulus+
Stratocumulus
Three Levels of Cloud
Tropopause
Kubar et al. 2007
126. Rotational Lines
of Water Vapor
and Upper-
Tropospheric
Cooling
Total Beyond 18.5m -->
Cooling efficiency
of atmosphere
declines in upper
troposphere because
of lack of water
vapor to emit and
absorb radiation.
128. Dr. Kuan-Man Xu
NASA Langley Research Center
Kuan-Man Xu, Personal Communication
129. Analysis of New Data
March 2003-November 2004: Aqua.
• MODIS optical depth and cloud top temperature
- 5km data
• AMSR rain rates and column vapor.
• Collocated three-day, 1-degree, averages
• MLS upper tropospheric humidity: Aura
• GPS upper tropospheric temperature profiles
130. Regions of Interest
▪Latitude band of 5ºN-15ºN allows focus to be almost exclusively
on convective areas, even in the East Pacific
Fig 1. Ensemble SSTs for March 2003-November 2004
West Pacific Central Pacific East Pacific
131. Cloud as a function of rainrate
R
A
I
N
R
A
T
E
WEST CENTRAL EAST
Temp-Opt Depth histograms as a function of rainrate (MODIS/AMSR).
132.
133.
134. Rain Rate/Anvil Cloud Area
More high cloud per unit of rain in the warmer West Pacific.
137. Modifying the
Fixed Anvil Temperature Hypothesis
• Cloud Top Temp. 218-216K ( -3C)
as SST 27C-30C ( +3C)
• Cloud Fraction from 20-40%
• Relative humidity ~ high cloud fraction
es~ -20% for T~ -3C (es =Saturation Vapor Press.)
RH ~ 20%, so
e ~ (RH•es) ~ 0 at median anvil level.
• Can conclude anvil cloud occurs at fixed e, or fixed T if
RH constant.
138. Relative Humidity
Profiles
From MLS and AIRS
and reanalysis for
the Western Pacific (WP)
Central Pacific (CP)
and Eastern Pacific (EP)
MLS humidity above
316mb, Temps. from
GPS.
141. Fixed Anvil Temperature Hypothesis
• Cloud Top Temp. 218-216K ( -3C)
as SST 27C-30C ( +3C)
• Cloud Fraction from 20-40%
• Relative humidity ~ high cloud fraction
es~ -20% for T~ -3C (es =Saturation Vapor Press.)
RH ~ 20%, so
e ~ (RH•es) ~ 0 at median anvil level.
• Can conclude anvil cloud occurs at fixed e, or fixed T if
RH constant.
142. Conclusions:
The favored temperature for tropical anvil cloud tops should
remain approximately constant during climate changes of
reasonable magnitude. FAT Hypothesis.
The emission temperature of the rotational lines of water
vapor should also remain approximately constant during
climate change.
These assertions imply relatively strong water vapor and IR
cloud feedback, all else being equal.
Hartmann and Larson, GRL, 2002.
143. Some Remaining Questions:
Will the area occupied by tropical convection change with
climate? If so, how?
How do tropical convective clouds interact with other
cloud types like marine boundary layer clouds?
How do tropical cloud albedos respond to climate change?
What will happen at the tropical tropopause? Will it get
warmer or colder and what will this mean for climate?
Fin
Global models should be able to get FAT right, but do they?