Comparable Company Analysis:
WhatIt Is, Why It Matters, and
How to Do It Efficiently
Would You Like a Stock Screener with Your
Non-Recurring Charges?
2.
This Lesson: Backto the Basics
We’ve referenced valuation multiples,
comparable companies, “Public
Comps,” etc. in many tutorials, but have
not defined exactly what they mean.
So, we’ll explain what they are, why they
matter, and how to complete the analysis
quickly and cheaply here.
3.
Plan for ThisTutorial
1) Meaning: What does “Comparable Company Analysis” mean,
and why do we use it when valuing companies?
2) Process: What are the set of steps required to use this analysis?
3) Quick/Cheap: How can you complete a Comparable Company
Analysis without much time/effort or expensive services?
4) Real Life: Why does this process take so long in real life, and
what makes it more complex than the examples shown here?
4.
Defining Comparable CompanyAnalysis
• Idea: You calculate a company’s “Implied Value” – what it should
be worth – based on what other, similar companies are worth
• Example: Company A has an Enterprise Value of $1,000, with an
EBITDA of $100 and, therefore, an EV / EBITDA of 10x
• But: Other, similar companies in the market have EV / EBITDA multiples
between 11x and 13x
• So: Company A should also trade at an EV / EBITDA of 11x to 13x, and
its Enterprise Value should be between $1,100 and $1,300
5.
Defining Comparable CompanyAnalysis
• Unlike in a DCF, which is mostly based on your views of Company A
and its long-term prospects, Comparable Company Analysis (“CCA”)
is based on the market’s views of this industry/sector
• So: It’s a “relative valuation methodology” – useful if the market is
right about the other companies, and not so useful when it’s wrong
• Result: We tend to think of CCA as a supplemental methodology
rather than “real valuation” – yes, the DCF has issues as well, but
if you set it up properly and make plausible assumptions, it works
6.
CCA – TheSet of Steps to Follow
• To value a company with CCA, follow these steps:
1) Select an appropriate set of comparable public companies.
2) Determine the metrics and multiples you want to use.
3) Calculate the metrics and multiples for all the companies.
4) Apply the median or 25th/75th percentile multiples from the set
to your company to estimate its Implied Equity Value and
Enterprise Value.
7.
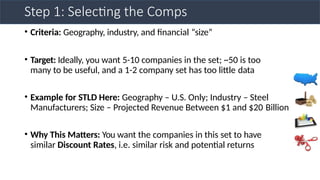
Step 1: Selectingthe Comps
• Criteria: Geography, industry, and financial “size”
• Target: Ideally, you want 5-10 companies in the set; ~50 is too
many to be useful, and a 1-2 company set has too little data
• Example for STLD Here: Geography – U.S. Only; Industry – Steel
Manufacturers; Size – Projected Revenue Between $1 and $20 Billion
• Why This Matters: You want the companies in this set to have
similar Discount Rates, i.e. similar risk and potential returns
8.
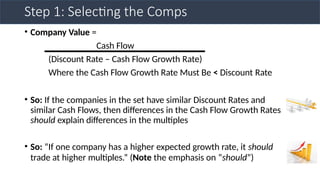
Step 1: Selectingthe Comps
• Company Value =
Cash Flow
(Discount Rate – Cash Flow Growth Rate)
Where the Cash Flow Growth Rate Must Be < Discount Rate
• So: If the companies in the set have similar Discount Rates and
similar Cash Flows, then differences in the Cash Flow Growth Rates
should explain differences in the multiples
• So: “If one company has a higher expected growth rate, it should
trade at higher multiples.” (Note the emphasis on “should”)
9.
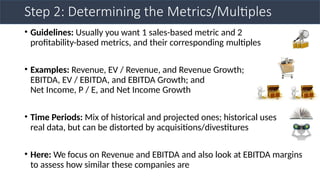
Step 2: Determiningthe Metrics/Multiples
• Guidelines: Usually you want 1 sales-based metric and 2
profitability-based metrics, and their corresponding multiples
• Examples: Revenue, EV / Revenue, and Revenue Growth;
EBITDA, EV / EBITDA, and EBITDA Growth; and
Net Income, P / E, and Net Income Growth
• Time Periods: Mix of historical and projected ones; historical uses
real data, but can be distorted by acquisitions/divestitures
• Here: We focus on Revenue and EBITDA and also look at EBITDA margins
to assess how similar these companies are
10.
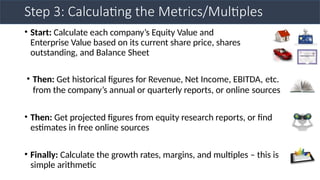
Step 3: Calculatingthe Metrics/Multiples
• Start: Calculate each company’s Equity Value and
Enterprise Value based on its current share price, shares
outstanding, and Balance Sheet
• Then: Get historical figures for Revenue, Net Income, EBITDA, etc.
from the company’s annual or quarterly reports, or online sources
• Then: Get projected figures from equity research reports, or find
estimates in free online sources
• Finally: Calculate the growth rates, margins, and multiples – this is
simple arithmetic
11.
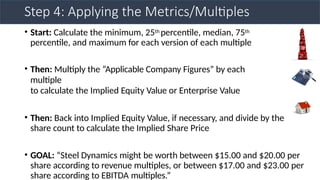
Step 4: Applyingthe Metrics/Multiples
• Start: Calculate the minimum, 25th percentile, median, 75th
percentile, and maximum for each version of each multiple
• Then: Multiply the “Applicable Company Figures” by each
multiple
to calculate the Implied Equity Value or Enterprise Value
• Then: Back into Implied Equity Value, if necessary, and divide by the
share count to calculate the Implied Share Price
• GOAL: “Steel Dynamics might be worth between $15.00 and $20.00 per
share according to revenue multiples, or between $17.00 and $23.00 per
share according to EBITDA multiples.”
12.
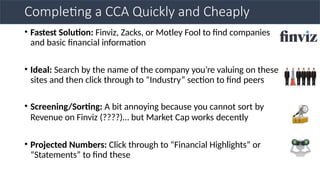
Completing a CCAQuickly and Cheaply
• Fastest Solution: Finviz, Zacks, or Motley Fool to find companies
and basic financial information
• Ideal: Search by the name of the company you’re valuing on these
sites and then click through to “Industry” section to find peers
• Screening/Sorting: A bit annoying because you cannot sort by
Revenue on Finviz (????)… but Market Cap works decently
• Projected Numbers: Click through to “Financial Highlights” or
“Statements” to find these
13.
Completing a CCAQuickly and Cheaply
• PROBLEM: These projections rarely have EBITDA, EBIT, etc. –
typically just Revenue and EPS
• Solution: Approximate and assume that EBITDA grows about as
quickly as EPS in the future periods
• PROBLEM: No easy way to download all the data in one spot or
pull all the numbers into Excel quickly and simply
• Solution: Don’t put ~25 companies in your set – this is partially
why you limit it to 5-10 (maybe also look at browser plugins?)
14.
Added Complexities
• ManualSearch: You often have to search through each company’s
filings manually and look for the financials, fine print, etc.
• Non-Recurring Charges: It can be tricky to determine whether
something like “Restructuring” should be added back when
calculating EBITDA – is it really non-recurring?
• Calendarizing the Figures: What if one company’s fiscal year
ends
on June 30th and another’s ends on September 30th?
• Solution: Take the Jul 1st to Jun 30th numbers, add the Jul 1st to
Sep 30th
15.
Recap and Summary
•Comparable Company Analysis: Companies A – G are like us, and
they have EV / EBITDA multiples of 10x – 13x, so we should as well
• Selection: You want these companies to have similar Cash Flows
and Discount Rates, so you screen by industry, geography, and size
• Process: Select companies, determine metrics/multiples, calculate
them, and apply them to your company to get its Implied Value
• Quick/Cheap: Use Finviz or Zacks to find comps by searching for the
company; pull basic information from there and make estimates
• Real Life: Manual search, non-recurring charges, and