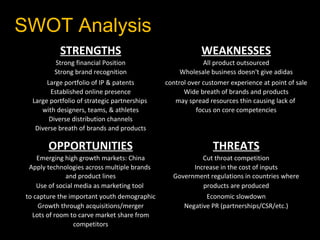
adidas Group

     Brad Andal
     Jeff Leong
    Kyle Mattson
     Joel Myers
    Sudhir Pathak

 November 28th, 2012
     Mgmt 4090
Key Strategic Issues
• Specific Focus on North American Sporting Apparel
  Market
• Direct Competition again Nike
• How does adidas gain a larger market share in
  North America?

North American Shoe Market
• Nike has 43.1%
• Adidas has 13%
•Company overview
•Culture
•External Environment
•Internal Environment
•Financials
•Recommendations
•Conclusion
adidas Group Overview
•  Founded in 1949 by Adolf Dassler
• “Adi” = Adolf “Das” = Dassler
•  Focused on athletic shoes and Apparel
•  Three main units: Adidas
   Reebok, Taylor-Made
• Over 170 subsidiaries
• Over 42,000 employees
Corporate Culture
•   Leadership: Adolf Dassler/Hebert Hainer
•   Talent/Succession Management
•   Rewarding Employees
•   Work Life Balance
    Ethics
• Accusations
• Cancelling Contracts
External Analysis
High Rivalry among Competitors
• Intense rivalry between adidas & Nike for
  market share
• Powerful competitive strategies
  used by market leaders
External Analysis
Low Threat of New Entrants
• Strong brand preferences and customer
  loyalty
• Market leaders benefit from
  significant economies of
  scale
• Difficult for new entrants to
  establish distributor/retailer
  networks
External Analysis
High Threat of Substitute Products
• Substitutes are readily available and
  attractively priced
• Low Switching Costs
• Low Supplier Power
• Manufacturing is outsourced
  to low cost producers
External Analysis
High Buyer Power
• Buyers benefit from intense rivalry for
  market share
• Low switching costs for buyers
• Buyers have discretion in
  purchasing products
• Buyers are well informed on
  purchased products due
  to intense marketing
PEST Analysis
Political
• Employment laws
• Environmental Regulations
Economic
• Recession
• Economic Growth
• Oil Prices/Cost of inputs
PEST Analysis
Social
• Consumer trends, age distribution
• CSR demands, safety
Technological
• Intellectual property
• Market Consolidation
  know –how
• Constant innovation
KSF’s
 Well-known and well-respected brand
  name
 Clever target advertising campaigns
 Strong distribution and retail channels
 Direct sales capabilities
 Expertise in sporting apparel
  technology and R&D
 Constant Innovation
  (live or die)
SWOT Analysis
 
                    STRENGTHS                               
                                                                        WEAKNESSES                                 

                  Strong financial Position                               All product outsourced                 

                  Strong brand recognition                        Wholesale business doesn't give adidas         


               Large portfolio of IP & patents               control over customer experience at point of sale    

                Established online presence                        Wide breath of brands and products            

          Large portfolio of strategic partnerships             may spread resources thin causing lack of        

             with designers, teams, & athletes                         focus on core competencies                

                Diverse distribution channels                                                                      

           Diverse breath of brands and products                                                                   


               OPPORTUNITIES                                
                                                                            THREATS                                

           Emerging high growth markets: China                          Cut throat competition                     

         Apply technologies across multiple brands                   Increase in the cost of inputs                

                     and product lines                         Government regulations in countries where           


           Use of social media as marketing tool                        products are produced                      


        to capture the important youth demographic                       Economic slowdown                         


            Growth through acquisitions/merger                    Negative PR (partnerships/CSR/etc.)              

          Lots of room to carve market share from                                                                  

                         competitors                                                                               
Financial Analysis
Key Metrics
Net Sales (€ in millions)


                                       2010        2011
Sales                                           
(year-over-year change)                9.0%        13.0%
                                                
Gross margin                          47.8%        47.5%
Other operating expenses (% of 
sales)                                42.1%        41.4%
                                                
Operating margin                       7.5%         7.6%
                                                
Financial Analysis
Liquidity & Debt
Metric                        2011
                           
Quick Ratio                    0.92
                           
Debt Ratio                     0.53
                           
Debt-to-Equity                 1.13
                           
Interest Coverage               7.2
Financial Analysis
Other Measures

Metric                                   2011
                                         
Marketing budget (percentage of sales)   10.2%
O
                                         
R & D budget (percentage of sales)       0.01%
                                         
Recommendations
Make Corporate Social Responsibility
a Focus

  •    Sensitive market
  •    Learn from Nike mistakes
       • Labour Laws and Regulations
  •    Sustainable Materials
  •   Supernova Glide 3 running shoe
  •   DJSI
  •   #38 Corporate Knights list
  •   Promote/Advertise CSR accomplishments
Recommendations
Increase Marketing and R & D
http://www.youtube.com/watch?v=3Hp-u7LVXPQ
    • Two biggest G & A expenditures that drive market
       growth
    • R&D
      • Invest in product customization
   • Marketing
      • Athletes endorsement
      • Social Media
Recommendations
Increase Own Retail Presence

  •   Customer Experience
  •   Control space
  •   Franchising
  •   Risks
Recommendations
Market Share Through Acquisitions

•   Under Amour
    • $5.67 Billion Market Cap
    • Trading at $54 per share


• Lululemon
   • $10.40 Billion Market Cap
   • Trading at $72 per share
Summation
It will not be a quick and easy process to
gain market share from Nike in North
America
Questions?

Adidas in North America

  • 1.
    adidas Group Brad Andal Jeff Leong Kyle Mattson Joel Myers Sudhir Pathak November 28th, 2012 Mgmt 4090
  • 2.
    Key Strategic Issues •Specific Focus on North American Sporting Apparel Market • Direct Competition again Nike • How does adidas gain a larger market share in North America? North American Shoe Market • Nike has 43.1% • Adidas has 13%
  • 3.
    •Company overview •Culture •External Environment •InternalEnvironment •Financials •Recommendations •Conclusion
  • 4.
    adidas Group Overview • Founded in 1949 by Adolf Dassler • “Adi” = Adolf “Das” = Dassler • Focused on athletic shoes and Apparel • Three main units: Adidas Reebok, Taylor-Made • Over 170 subsidiaries • Over 42,000 employees
  • 5.
    Corporate Culture • Leadership: Adolf Dassler/Hebert Hainer • Talent/Succession Management • Rewarding Employees • Work Life Balance Ethics • Accusations • Cancelling Contracts
  • 6.
    External Analysis High Rivalryamong Competitors • Intense rivalry between adidas & Nike for market share • Powerful competitive strategies used by market leaders
  • 7.
    External Analysis Low Threatof New Entrants • Strong brand preferences and customer loyalty • Market leaders benefit from significant economies of scale • Difficult for new entrants to establish distributor/retailer networks
  • 8.
    External Analysis High Threatof Substitute Products • Substitutes are readily available and attractively priced • Low Switching Costs • Low Supplier Power • Manufacturing is outsourced to low cost producers
  • 9.
    External Analysis High BuyerPower • Buyers benefit from intense rivalry for market share • Low switching costs for buyers • Buyers have discretion in purchasing products • Buyers are well informed on purchased products due to intense marketing
  • 10.
    PEST Analysis Political • Employmentlaws • Environmental Regulations Economic • Recession • Economic Growth • Oil Prices/Cost of inputs
  • 11.
    PEST Analysis Social • Consumertrends, age distribution • CSR demands, safety Technological • Intellectual property • Market Consolidation know –how • Constant innovation
  • 12.
    KSF’s  Well-known andwell-respected brand name  Clever target advertising campaigns  Strong distribution and retail channels  Direct sales capabilities  Expertise in sporting apparel technology and R&D  Constant Innovation (live or die)
  • 13.
    SWOT Analysis   STRENGTHS       WEAKNESSES      Strong financial Position       All product outsourced      Strong brand recognition       Wholesale business doesn't give adidas      Large portfolio of IP & patents       control over customer experience at point of sale       Established online presence       Wide breath of brands and products      Large portfolio of strategic partnerships        may spread resources thin causing lack of       with designers, teams, & athletes       focus on core competencies      Diverse distribution channels              Diverse breath of brands and products                             OPPORTUNITIES       THREATS      Emerging high growth markets: China       Cut throat competition      Apply technologies across multiple brands        Increase in the cost of inputs      and product lines       Government regulations in countries where      Use of social media as marketing tool        products are produced      to capture the important youth demographic       Economic slowdown      Growth through acquisitions/merger       Negative PR (partnerships/CSR/etc.)      Lots of room to carve market share from              competitors           
  • 14.
    Financial Analysis Key Metrics NetSales (€ in millions)         2010  2011 Sales             (year-over-year change)   9.0%  13.0%               Gross margin     47.8%  47.5% Other operating expenses (% of  sales) 42.1%  41.4%               Operating margin     7.5%  7.6%              
  • 15.
    Financial Analysis Liquidity &Debt Metric       2011           Quick Ratio     0.92           Debt Ratio     0.53           Debt-to-Equity     1.13           Interest Coverage     7.2
  • 16.
    Financial Analysis Other Measures Metric        2011           Marketing budget (percentage of sales)   10.2% O            R & D budget (percentage of sales)   0.01%           
  • 17.
    Recommendations Make Corporate SocialResponsibility a Focus • Sensitive market • Learn from Nike mistakes • Labour Laws and Regulations • Sustainable Materials • Supernova Glide 3 running shoe • DJSI • #38 Corporate Knights list • Promote/Advertise CSR accomplishments
  • 18.
    Recommendations Increase Marketing andR & D http://www.youtube.com/watch?v=3Hp-u7LVXPQ • Two biggest G & A expenditures that drive market growth • R&D • Invest in product customization • Marketing • Athletes endorsement • Social Media
  • 19.
    Recommendations Increase Own RetailPresence • Customer Experience • Control space • Franchising • Risks
  • 20.
    Recommendations Market Share ThroughAcquisitions • Under Amour • $5.67 Billion Market Cap • Trading at $54 per share • Lululemon • $10.40 Billion Market Cap • Trading at $72 per share
  • 21.
    Summation It will notbe a quick and easy process to gain market share from Nike in North America
  • 22.