Download to read offline
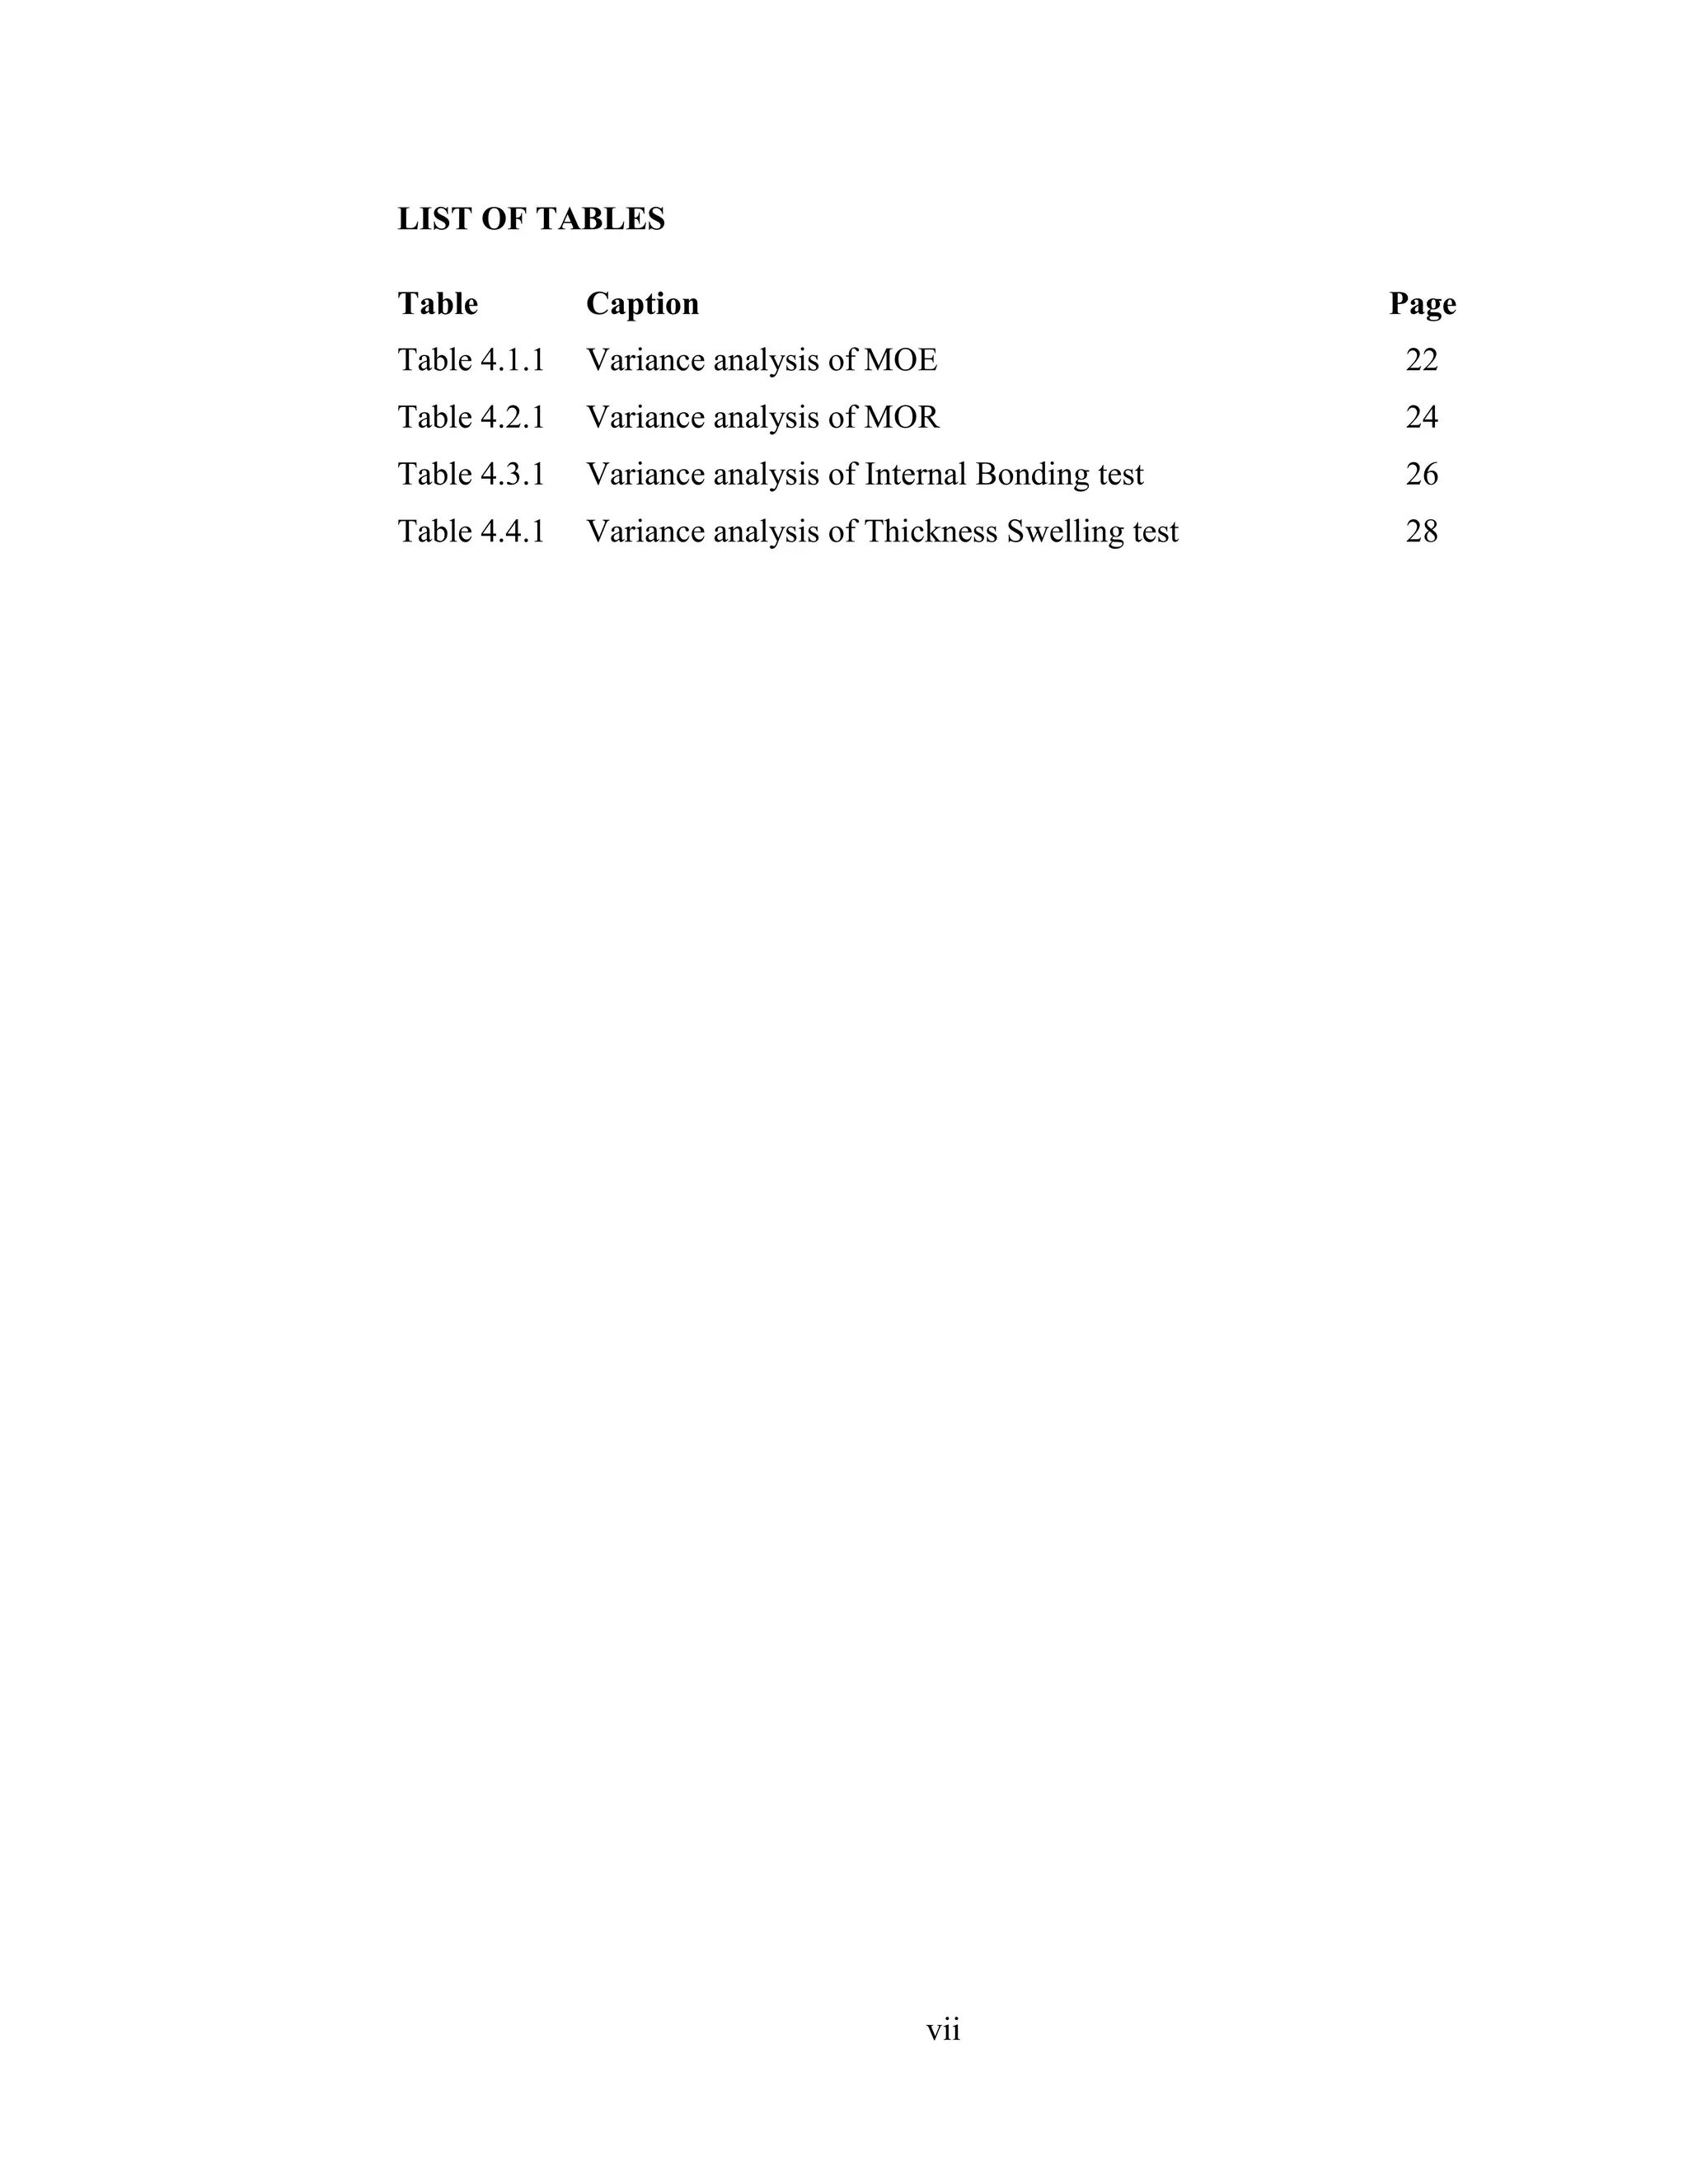

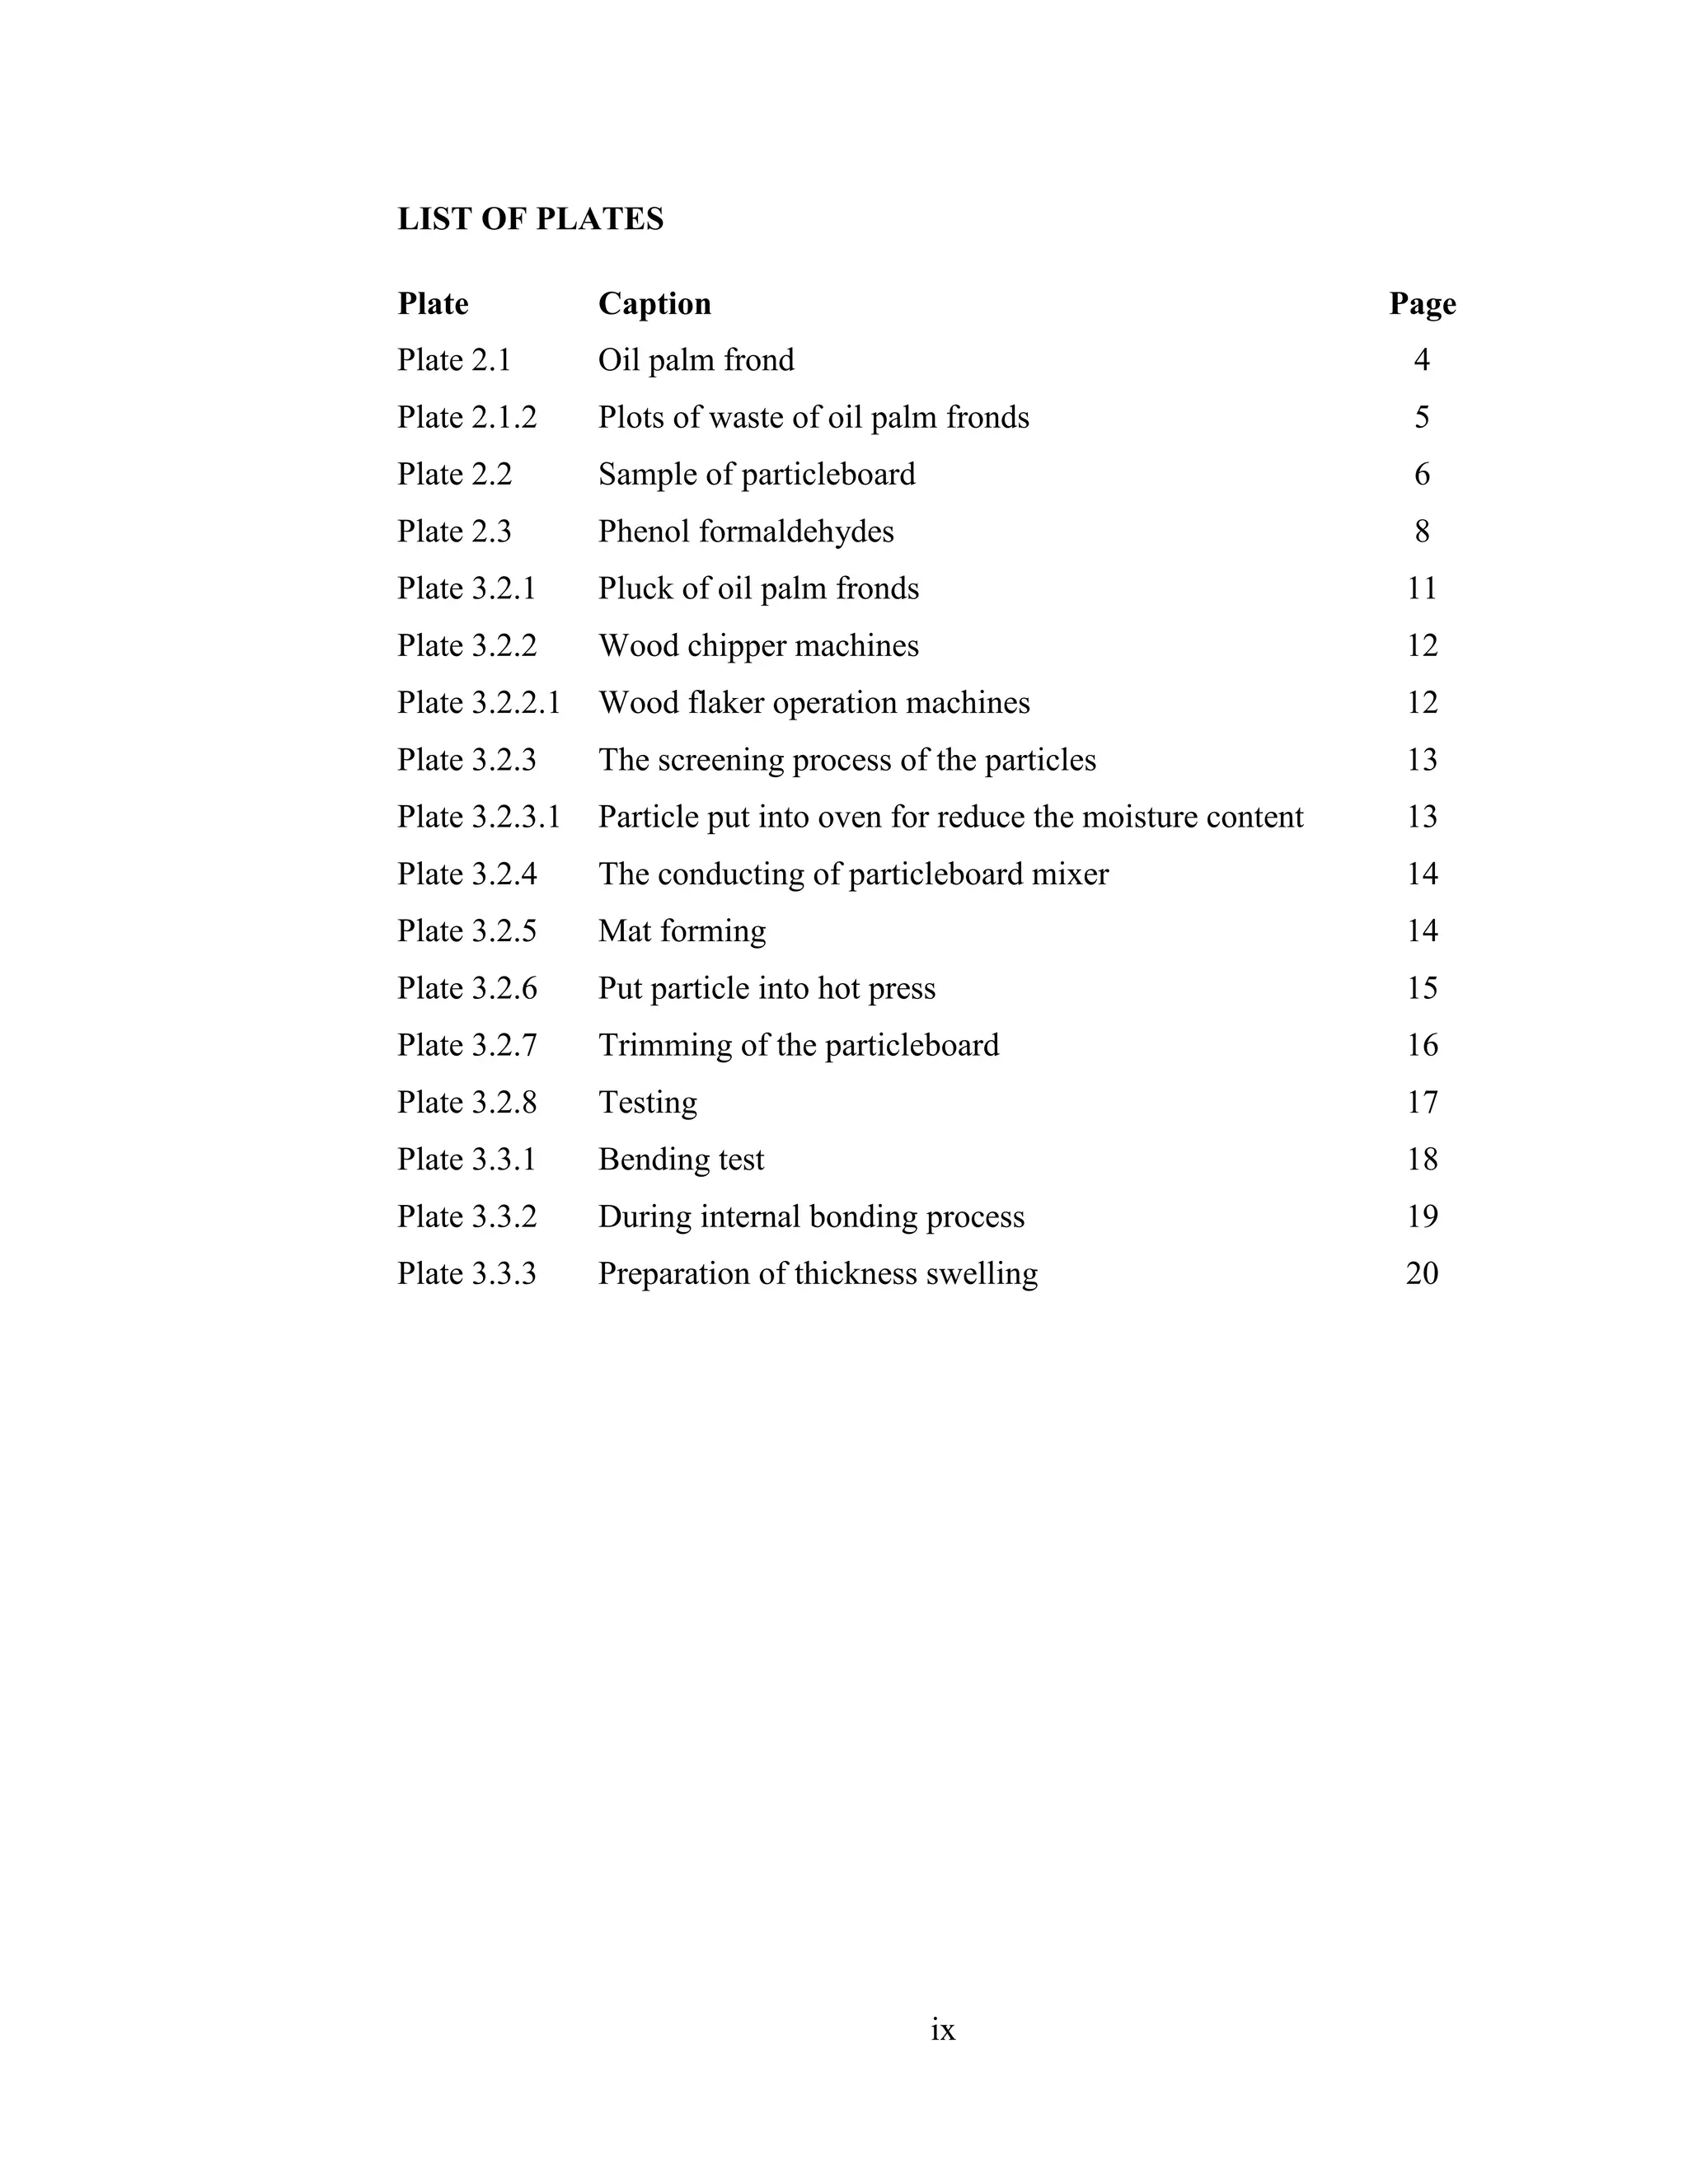


This document contains lists of tables, figures, plates, and graphs as well as abbreviations related to research on manufacturing particleboard from oil palm fronds. There are 4 tables that analyze the variance in mechanical and physical properties of the particleboard including modulus of elasticity, modulus of rupture, internal bonding, and thickness swelling tests. Additionally, there are 7 figures that provide ANOVA analyses of these properties for different particle sizes and resin contents. The document also includes 10 plates that illustrate the manufacturing process and testing of the particleboard and 5 graphs that show the results of the MOE, MOR, internal bonding, thickness swelling, and water absorption tests. Finally, the list of abbreviations defines technical terms used in the research such as


