Download to read offline


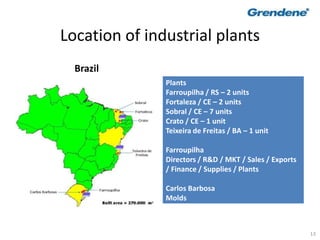
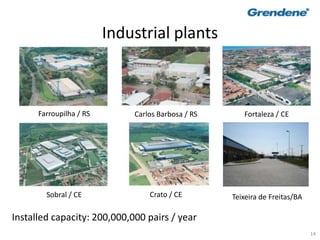


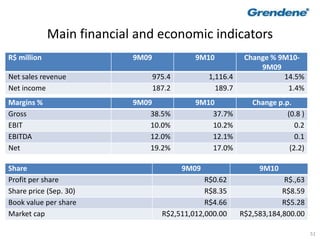
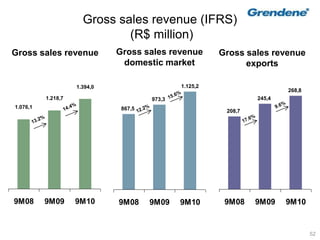
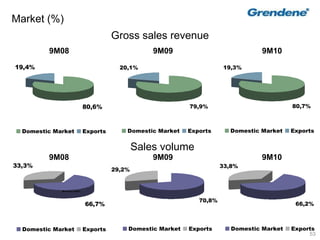
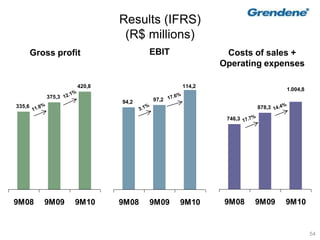
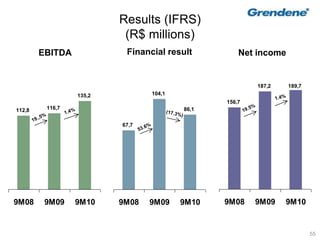
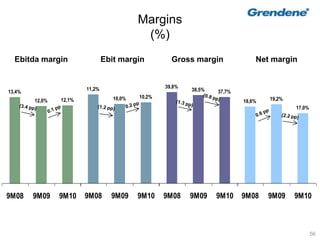
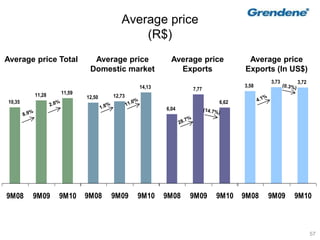
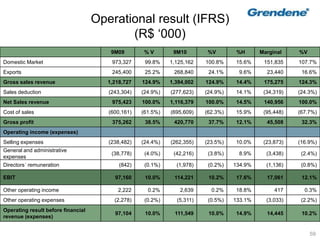


Grendene is a Brazilian footwear company that is one of the largest producers of footwear in the world. It has 30,000 employees and produces 200 million pairs of shoes per year across 13 industrial plants located in Brazil. Grendene has a diverse portfolio of brands including Melissa, Ipanema, and Rider. The document discusses Grendene's history, operations, financial results, and strategy of focusing on branding, marketing, and innovation to drive growth above the industry average. For the first nine months of 2010, Grendene's net revenue grew 14.5% to R$1.1 billion while net income grew 1.4% to R$189.7 million.


