Grendene - APIMEC meeting - March 2010
•
0 likes•192 views

The document summarizes the key points from the APIMEC meeting in March 2010. It provides an overview of Grendene's history since the 1970s, highlights of the company including its production capacity and worldwide presence. It also discusses Grendene's corporate structure, industrial plants, production process, sustainability efforts, the footwear sector, marketing strategy, product lines, and financial results. The meeting agenda covered Grendene's timeline, corporate structure, production details, sustainability, industry analysis, marketing strategy, and 2009 financial results.

Recommended
More Related Content
Viewers also liked
Viewers also liked (12)
Similar to Grendene - APIMEC meeting - March 2010
Similar to Grendene - APIMEC meeting - March 2010 (20)
More from Grendene
More from Grendene (15)
Recently uploaded
Recently uploaded (20)
Grendene - APIMEC meeting - March 2010
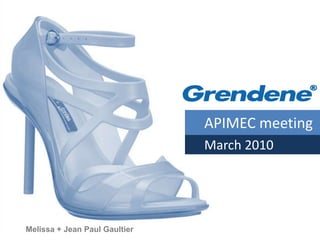
- 1. APIMEC meeting March 2010 Melissa + Jean Paul Gaultier
- 2. Disclaimer This presentation contains statements that can represent expectations about future events or results, These statements are based on certain suppositions and analyses made by the company in accordance with its experience, with the economic environment and market conditions, and expected future developments, many of which are beyond the company’s control, Important factors could lead to significant differences between real results and the statements on expectations about future events or results, including the company’s business strategy, Brazilian and international economic conditions, technology, financial strategy, developments in the footwear industry, conditions of the financial market, and uncertainty on the company’s future results from operations, plans, objectives, expectations and intentions – among other factors, In view of these aspects, the company’s results could differ significantly from those indicated or implicit in any statements of expectations about future events or results, 2 2
- 4. Timeline The 70’s The beginning... Grendene was founded in Farroupilha, Rio Grande do Sul. Its first product line was plastic packaging for wine flasks. Start of production of plastic parts for farm machinery and equipment, and subsequently shoes components such as soles and heels. Launch of plastic sandals under the brand name Melissa. Beginning of the Grendene´s exports. 4
- 5. Timeline The 80’s Melissa Aranha The mold-making operation was started in Carlos Barbosa, Rio Grande do Sul. The succesful collaboration between Melissa and greatest designers like: Jean-Paul Gaultier, Thierry Mugler, Jacqueline Jacobson and Elisabeth De Seneville. Launch of the Rider sandals line, target for the masculine public. 5
- 6. Timeline The 90´s In Ceará, the plant at Fortaleza, Sobral and Crato, was inaugurated. Launch of the Grendha product line, targeting the feminine public. Grendene creates a division dedicated only to the Melissa brand name. 6
- 7. Timeline The 2000’s Launch of the Ipanema line and Grendene started having partnership with top model common shares (“GRND3”) Gisele Bündchen. negotiated at the Novo Mercado of BM&F Bovespa. Openning of Galeria Melissa in In the State of Bahia, the plant at São Paulo. Teixeira de Freitas, was inaugurated. Dividend policy – Grendene will After thirty years making history distribute dividends quarterly as a fashion accessory, Melissa from 2009 on. makes a surprise move and releases the brand´s perfurme to celebrate the occasion. Launch of the Ilhabela, Zaxy, Relaunch of the Rider Brand. Ipanema RJ and Cartago brands. 7
- 8. Highlights Grendene is one of the world´s largest producers of synthetic footwear Production capacity: 200 million pairs/year Average production: 500,000 pairs/day Employees: 30,000 New products in 2009: 632 World presence: more than 90 countries Brands with strong personality Innovation in product, distribution and media Listed on São Paulo´s Novo Mercado; free float 25% Solid capital structure, strong cash flow 8
- 9. Shareholder structure 55,2% 44,8% Alexandre Alexandre Grendene Verona Pedro G. G. Bartelle G. Bartelle Negócios Negócios e Bartelle Free Float Part. S.A. (P. Física) S.A. Part. S.A. (P. Física) 30% 0,3% 20,1% 24% 0,5% 25,1% 100% 95% 99,99% 100% Saddle Corp. S.A Grendene Argentina S.A. MHL Calçados Ltda. Grendene USA Corporation 9
- 10. Board of Directors Pedro G. Bartelle Vice-Chairman Oswaldo de Renato Assis Filho Ochman Director Director Alexandre G. Bartelle Chairman Walter Maílson F. da Janssen Neto Nóbrega Independent Director Director 10
- 11. Executive board of directors Alexandre G. Bartelle Chief executive officer Pedro G. Bartelle Vice-chief executive officer Gelson Luis Rostirolla Rudimar Dall Onder Chief financial officer Francisco Schmitt Industrial and & administrative and Investor relations officer Commercial Officer controlling officer 11
- 12. Plants 12
- 13. Location of industrial plants Brazil Plants Farroupilha / RS – 2 units Fortaleza / CE – 2 units Sobral / CE – 7 units Crato / CE – 1 unit Teixeira de Freitas / BA – 1 unit Farroupilha Directors / R&D / MKT / Sales / Exports / Finance / Supplies / Plants Carlos Barbosa Molds 1313
- 14. Industrial plants Farroupilha / RS Carlos Barbosa / RS Fortaleza / CE Sobral / CE Crato / CE Teixeira de Freitas/BA Installed capacity: 200,000,000 pairs / year 1414
- 15. Productive process VERTICALIZATION = AGILITY PVC Formulation Design Moulds R&D 15
- 16. Sustainability 16
- 17. Our chalenge 17
- 18. The landscape 18
- 19. Low income FOTO: Luiz Carneiro 19
- 20. Poverty 20
- 21. Inefficient energy use No Sanitation 21
- 22. Desertification Erosion 22
- 23. Climate problems 23
- 24. Our response 24
- 25. With social responsability 25
- 26. Social responsability Providing employment and income 26
- 27. Social responsability Healthy food 27
- 28. Social responsability Training 28
- 29. Social responsability Over the years Grendene has helped to put on the shoes of people. 29
- 30. Social and Environmental Responsability PVC that is unused or damaged in the Unused paints are removed from the process, plus leftovers and scraps are water for reuse of the paint and the fully reused. water. 30
- 31. Social and Environmental Responsability The water is treated in a decantation lake The water used for watering the plants and reused for conserving the comes from reusing factory water. vegetation. 31
- 32. Footwear sector 32
- 33. Brazil’s Footwear Sector Profile 7,830 producers in 2007 300,000 direct employees Production: 804 million pairs in 2008* (808 million pairs in 2007) World´s 3rd largest producer Apparent consumption, Brazilian domestic market: 677 million pairs, and 3.9 pairs per capita, in 2008 (2007: 660 million pairs, 3.59 pairs per capita/year). Exports: In 2009: 126 million pairs, to more than 140 countries (23.7% less than in 2008). Sources: IEMI, Abicalçados, Secex, MDIC, Satra. (*) 2008: estimate by IEMI (Industrial Studies and Marketing Institute). The industry itself is not much more than 100 years old – companies are typically small and labor-intensive, with no entry barriers. 33
- 34. Footwear sector 2007 The 5 principal countries produce: 13,216 million 12.000 pairs = 82% of total 10.209 10.000 world production of 16,074 million pairs, Million of pairs 8.000 6.000 4.000 2.858 2.000 980 796 665 565 - China India Brazil Vietnam Indonesia Others Source: Satra 2008 34
- 35. The footwear sector in Brazil Million pairs 2005 2006 2007 2008 2009 Production 877 830 808 804* N, Av, Imports 17 19 29 39 30 Exports 190 180 177 166 126 Apparent consumption 704 669 660 677 N, Av, Per capita consumption 3,84 3,61 3,52 3,49 N, Av, N, Av, – Data not available / * Production estimated by IEMI – November Source: MDIC / DECEX / IBGE / IEMI / Abicalçados Consumption – 2007 Total Per capita USA 2,393 7,94 Source: Satra 2008 / United Kindgom 451 7,42 Abicalçados / U,S, Italy 387 6,65 Census Bureau France 417 6,55 Japan 707 5,55 35
- 36. Grendene vs, Brazilian footwear sector Brazilian production Grendene CAGR (2008/2001): 4.0% CAGR (2008/2001): 6.5% CAGR (2009/2001): 7.4% 1000 897 916 877 180 166 900 830 808 804 160 146 146 145 800 130 132 million pairs / year 140 million pairs / year 700 610 642 116 121 120 600 94 500 100 400 80 300 60 200 40 100 20 0 0 2008* 2001 2002 2003 2004 2005 2006 2007 2001 2002 2003 2004 2005 2006 2007 2008 2009 Source: IEMI / Abicalçados Grendene has grown faster than the Brazilian * Production estimated by IEMI - Nov/2008 footwear industry, 36
- 37. Exports: Grendene vs, Brazil Brazilian exports Grendene CAGR: (3.7%) CAGR: 15.7% 250 60 212 189 190 180 48 48 200 171 177 50 million pairs / year million pairs / year 164 166 40 40 150 127 32 30 27 29 28 100 20 15 16 50 10 0 0 2001 2002 2003 2004 2005 2006 2007 2008 2009 2001 2002 2003 2004 2005 2006 2007 2008 2009 Grendene´s exports were 38,1% of total Brazilian Source: DECEX / MDIC / ABICALÇADOS footwear exports in 2009, (28,9% in 2008) 37
- 38. Strategy: Break paradigms Less labor-intensive More capital-intensive Higher entry barriers Highly marketing- intensive 38
- 39. Our expertise of more than 30 years, producing innovative footwear and generating desired brands, shows the success of our vision of the market, our strategy and our business model – and our capacity to create value for stockholders. 39
- 40. Value proposition Brands Products Marketing Management Constant creation Aggresive marketing Scale gains, scope of products Licenses with gains Innovative design celebrities Profitability Segmentation Continuous Manufacturing Investment in media improvement technology / events Financial solidity Few products in Strong relationship Sustainable large scale with trade growth Value for stakeholders 4040
- 41. Produtos Products for all the Products meet income levels: A, B, C, essential, basic needs D and E – with very at low cost. good cost / benefit 41
- 42. Melissa Marine Melissa Royale Melissa Loop Melissa Ocean Melissa Cirque Melissa Troupe + Herchcovitch 42
- 44. 2009 The Rider brand is undergoing transformations and returns to the market with a more contemporary vision. 44
- 45. The brand invites active and relaxed young males to enjoy life to the full. Rider R3 Ad Rider RS2 Ad Rider RS3 Ad 45
- 46. Conceived by Oscar Metsavaht, Foto: Rogério Faissal and with a strong aesthetic appeal is a premium product. 46
- 47. 47
- 48. Ilhabela Tour Ad Ilhabela Trip Ad 48
- 49. Zaxy Cookie Ad 49
- 50. Ben 10 Ominitrix II Inf Barbie Fashion Inf Disney Sininho Gold Inf Guga K. Power Games Sand Inf 50
- 51. Barbie Vintage Baby Disney Princesas Pérola Baby Hot Wheels Urban Baby Homem Aranha Effect Baby 51
- 52. Main Licenses 52
- 53. Celebrities FLÁVIA ALESSANDRA CLAUDIA LEITE ANA HICKMANN 53
- 54. Celebrities IVETE SANGALO ALEXANDRE BORGES GISELE BÜNDCHEN 54
- 55. International sales channels Urban Outfitters - Londres Jean Pierre Buá - Barcelona 55
- 56. International sales channels Fred Segal - Los Angeles El Corte Inglês - Espanha 56
- 57. Galeria Melissa – Concept Store © All rights reserved Rua Oscar Freire, 827, São Paulo, SP 57
- 58. Results (in IFRS) 58
- 59. Main financial and economic indicators R$ million 2008 2009 Change , 08-09 Net sales revenue (1) 1,324,6 1,545,2 16,7% Net income 239,4 272,2 13,7% Note (1): The difference between Net revenue presented in this report and that presented in the Financial Statements refers to the reclassification of discounts for punctual payment granted to clients, In Brazilian GAAP these are recognized as a financial expense, while under IFRS they are recognized as a reduction of sales, in accordance with the International Financial Reporting Interpretations Committee, We have maintained the presentation according to BRGAAP for the purposes of comparability, Margins % 2008 2009 Change 08-09, bp Gross 44,8% 42,4% (240 bp) EBIT 12,2% 9,8% (240 bp) EBITDA 14,1% 11,5% (260 bp) Net 18,1% 17,6% (50 bp) Share 2008 2009 Profit per share R$ 0,80 0,91 years Share price (31/12) R$ 4,23 9,95 Book value per share R$ 4,39 4,88 Market cap (R$ 1,000) 1,270,000 2,985,000 59
- 60. Gross sales revenue (IFRS) (R$ million) Gross sales revenue Gross sales revenue Gross sales revenue Domestic Exports 1,819.4 1,464.3 355.6 355.0 1,576.0 1,220.5 2008 2009 2008 2009 2008 2009 60
- 61. Market (%) Gross sales revenue 2008 2009 22.6% 19.5% 77.4% 80.5% Domestic market Exports Domestic market Exports Sales volume 2008 2009 32.7% 29.1% 67.3% 70.9% Domestic market Exports Domestic market Exports 61
- 62. Results (IFRS) (R$ million) Gross profit EBIT Cost of sales + Operating expenses 655.5 1,303.6 161.4 593.4 150.8 1,083.9 2008 2009 2008 2009 2008 2009 62
- 63. Results (IFRS) (R$ million) EBITDA Financial result Net income (without clients discounts) 187.0 177.1 272.2 135.6 239.4 84.2 2008 2009 2008 2009 2008 2009 63
- 64. Margins (%) EBITDA margin EBIT margin Gross margin Net margin 14.1% 12.2% 44.8% 18.1% 17.6% 42.4% 11.5% 9.8% 2008 2009 2008 2009 2008 2009 2008 2009 64
- 65. Sales volume (Million pairs) Sales volume Sales volume Sales volume Domestic Exports 165.7 146.4 117.4 47.8 48.3 98.6 2008 2009 2008 2009 2008 2009 65
- 66. Shareholder´s equity and return on equity 1500 20.3% 20.7% 24% 1000 16% 1,318.1 1,464.6 500 8% 0 0% 2008 2009 Shareholder´s equity (R$ million) Return on equity (%) 66
- 67. Operational result (IFRS) (R$ ‘000) 2008 %V 2009 %V %H Marginal %V Domestic market 1,220,482 92.1% 1,464,338 94.8% 20.0% 243,856 110.5% Exports 355,553 26.8% 355,024 23.0% (0.1%) (529) (0.2%) Gross sales revenue 1,576,035 119.0% 1,819,362 117.7% 15.4% 243,327 110.3% Sales deduction (251,424) (19.0%) (274,140) (17.7%) 9.0% (22,716) (10.3%) Net sales revenue (1) 1,324,611 100.0% 1,545,222 100.0% 16.7% 220,611 100.0% Cost of sales (731,193) (55.2%) (889,711) (57.6%) 21.7% (158,518) (71.9%) Gross profit 593,418 44.8% 655,511 42.4% 10.5% 62,093 28.1% Operating income (expenses) Selling expenses (306,442) (23.1%) (356,275) (23.1%) 16.3% (49,833) (22.6%) General and administrative expenses (49,667) (3.7%) (57,854) (3.7%) 16.5% (8,187) (3.7%) Equity pick-up (66) 0.0% 0 0.0% 0.0% 66 0.0% Management fees (1,123) (0.1%) (1,123) (0.1%) 0.0% 0 0.0% Other operating income 11,328 0.9% 3,200 0.2% (71.8%) (8,128) (3.7%) Other operating expenses (6,823) (0.5%) (1,810) (0.1%) (73.5%) 5,013 2.3% Operating result before financial 240,625 18.2% 241,649 15.6% 0.4% 1,024 0.5% revenue (expenses) Clients discounts (74,748) (5.6%) (89,465) (5.8%) 19.7% (14,717) (6.7%) EBIT 161,372 12.2% 150,794 9.8% (6.6%) (10,578) (4.8%) Note (1): The difference between Net revenue presented in this report and that presented in the Financial Statements refers to the reclassification of discounts for punctual payment granted to clients, In Brazilian GAAP these are recognized as a financial expense, while under IFRS they are recognized as a reduction of sales, in accordance with the International Financial Reporting Interpretations Committee, We have maintained the presentation according to BRGAAP for the purposes of comparability, 67
- 68. Net cash, dividends & Capex 68
- 69. Net cash, debt and cash and cash equivalents Debt Net Cash Cash and cash equivalents 1,000.0 800.0 799,8 794,4 600.0 702,8 400.0 663.8 520.6 575.8 200.0 0.0 (130.6) (182.2) (224.0) (200.0) (400.0) 31/12/07 31/12/08 12/31/2009 Strong cash flow 69
- 70. Dividends R$ 1.00 45.9% 45.4% 50.0% 40.3% R$ 0.75 37.5% R$ 0,87 R$ 0,91 R$ 0,80 R$ 0.50 25.0% R$ 0.3991 R$ 0.3633 R$ 0.3667 R$ 0.25 12.5% 4.9% 6.7% 7.8% R$ 0.00 0.0% 2007 2008 2009 Dividend per share (R$) Profit per share (R$) Dividend yield (%) Payout (%) Dividend yield: Profit per share divided by average value of the share in the year. 70
- 71. Low need for CAPEX (R$ million) 40 35.4 35 30 24.2 25 19.9 20 15 10 5 0 2007 2008 2009 71
- 72. Outlook • Galeria Melissa (the brand´s concept store): In the next two years Grendene will open Galeria Melissa in New York, Paris and Tokyo; • Expansion of the production capacity of our plants. 72
- 73. Guidance Targets for 2009 - 2013 Gross revenue – CAGR: 8% - 12% over the next 5 years. Net profit – CAGR: 12% - 15% over the next 5 years. Advertising expenses: average: 8% - 10% of net revenue over this period. To reach these targets, we will seek to grow more intensely in the external market, expecting that the Real/US$ exchange rate will vary approximately in line with the difference of inflation between the two countries (Brazil and the US), taking as a reference point the average R$/US$ exchange rate in the first quarter of 2009. We emphasize that this expectation for the change in the exchange rate is for the long term (a period between five and 10 years), and not for the coming quarter. 73
- 74. Thank You! Grendene s IR Team Francisco Schmitt Investor Relations Officer schmitt@grendene.com.br (5554) 2109.9022 Analysts Alexandre Vizzotto Lenir Baretta (5554) 2109.9011 (5554) 2109.9026 Further information: Internet: http://ri.grendene.com.br Email: dri@grendene.com.br (Press Release, Annual Report, Fact-Sheet, Financial Statements) 7474