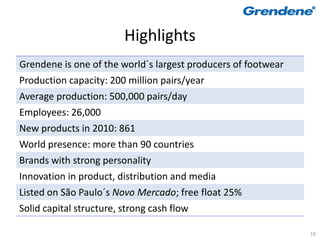
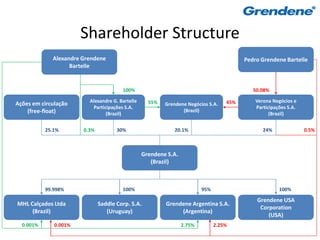
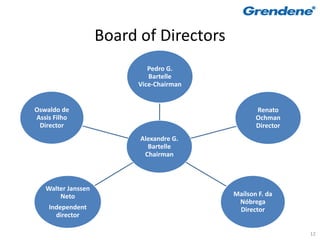
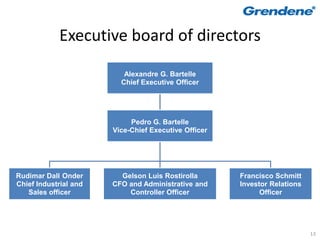
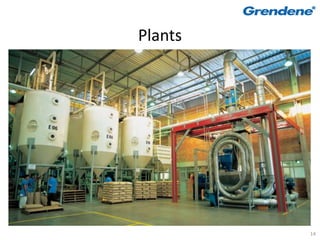
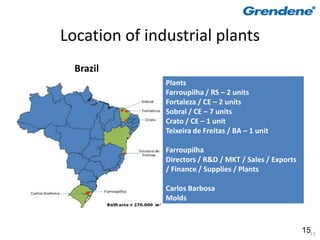
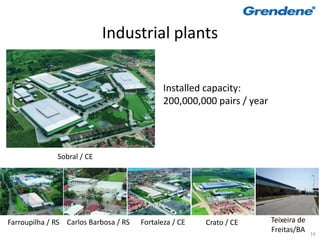
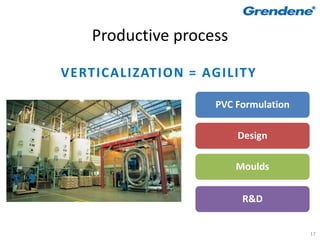
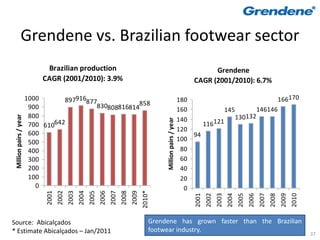
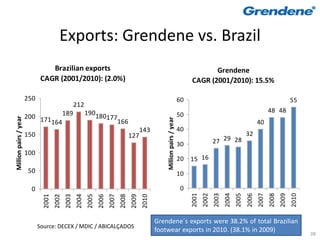
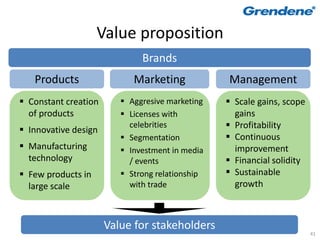
This document summarizes the key points from an APIMEC meeting that took place in March 2010. The meeting agenda included discussing Grendene's history, highlights, corporate structure, production plants, sustainability efforts, the footwear sector, strategy, products, and results. Grendene is a large Brazilian footwear producer with 26,000 employees and the capacity to produce 200 million pairs per year across multiple plants in Brazil. The company discussed its vertical integration, brands, marketing partnerships, exports, and financial results.
Running head STRATEGIC PLAN THE GAP INC. 1 .docxagnesdcarey33086
Running head: STRATEGIC PLAN: THE GAP INC. 1
Strategic Plan: The Gap Inc.
Student Name
American Military University
Date
STRATEGIC PLAN: THE GAP INC. 2
Executive Summary
This strategic plan describes the Gap Incorporated business and its subsidiary brands. This plan
will cover the history, products, operations, vision, mission, corporate values and culture, SWOT
(strengths, weaknesses, opportunities, and threats) analysis, competitors, management team,
financial outlook, and strategies of the company. This plan will go into detail about the company
as a whole and address potential ways forward for the company to maintain growth and success.
STRATEGIC PLAN: THE GAP INC. 3
Table of Contents
Company Overview ........................................................................................................................ 4
Company History ............................................................................................................................ 4
Products and Services ..................................................................................................................... 7
Operations ....................................................................................................................................... 8
Vision .............................................................................................................................................. 9
Mission Statement ......................................................................................................................... 10
Corporate Values and Culture ....................................................................................................... 10
SWOT Analysis ............................................................................................................................ 11
Competition................................................................................................................................... 12
Management Team / Leadership ................................................................................................... 13
Financial Outlook.......................................................................................................................... 15
Strategies ....................................................................................................................................... 16
Conclusion .................................................................................................................................... 18
References ..................................................................................................................................... 19
Table of Figures
Figure 1 NASDAQ Gap Inc. Competitor Industry (Nasdaq, 2015). ............................................ 22
STRATEGIC PLAN: THE GAP INC. 4
Company Overview
The Gap, Incorporate.
2. Disclaimer
This presentation contains statements that can represent expectations about
future events or results, These statements are based on certain suppositions
and analyses made by the company in accordance with its experience, with
the economic environment and market conditions, and expected future
developments, many of which are beyond the company’s control, Important
factors could lead to significant differences between real results and the
statements on expectations about future events or results, including the
company’s business strategy, Brazilian and international economic conditions,
technology, financial strategy, developments in the footwear industry,
conditions of the financial market, and uncertainty on the company’s future
results from operations, plans, objectives, expectations and intentions –
among other factors, In view of these aspects, the company’s results could
differ significantly from those indicated or implicit in any statements of
expectations about future events or results,
2 2
4. Mission
• To create a type of fashion that is democratic,
responding rapidly to the market´s needs,
while generating attractive returns for the
company´s and its partners.
Values
• Profit, Competitiveness, Innovation & Agility
and Ethics.
4
5. Timeline
The beginning
1971
Grendene was founded. With
two injection machines, 15
employees and novelty: to
produce plastic packaging for
wine.
5
6. Timeline
1975
With diversification, was the
pioneer to produce shoes with
nylon as raw material.
1978
The launch of the Nuar sandal, an old
dream came true.
The following year the collection of
sandals with the Melissa brand has
conquered the world.
6
7. Timeline
1983
The succesful collaboration
between Melissa and greatest
designers like: Jean-Paul
Gaultier, Thierry Mugler,
Jacqueline Jacobson and
Elisabeth De Seneville.
1986
Launch of the Rider sandals line,
target for the masculine public.
7
8. Timeline
1990/93/97
In Ceará, the plant at Fortaleza,
Sobral and Crato, was
inaugurated.
1994
Launch of the Grendha product line,
targeting the feminine public.
8
9. Timeline
The 2000’s
Launch of the Ipanema line and Grendene started having
partnership with top model common shares (“GRND3”)
Gisele Bündchen. negotiated at the Novo Mercado
of BM&F Bovespa.
Openning of Galeria Melissa in In the State of Bahia, the plant at
São Paulo. Teixeira de Freitas, was
inaugurated.
Dividend policy – Grendene will After thirty years making history
distribute dividends quarterly as a fashion accessory, Melissa
from 2009 on. makes a surprise move and
releases the brand´s perfurme to
celebrate the occasion.
Launch of the Ilhabela, Zaxy, Relaunch of the Rider Brand.
Ipanema RJ and Cartago brands.
9
10. Highlights
Grendene is one of the world´s largest producers of footwear
Production capacity: 200 million pairs/year
Average production: 500,000 pairs/day
Employees: 26,000
New products in 2010: 861
World presence: more than 90 countries
Brands with strong personality
Innovation in product, distribution and media
Listed on São Paulo´s Novo Mercado; free float 25%
Solid capital structure, strong cash flow
10
12. Board of Directors
Pedro G.
Bartelle
Vice-Chairman
Oswaldo de Renato
Assis Filho Ochman
Director Director
Alexandre G.
Bartelle
Chairman
Walter Janssen
Neto Maílson F. da
Nóbrega
Independent Director
director
12
13. Executive board of directors
Alexandre G. Bartelle
Chief Executive Officer
Pedro G. Bartelle
Vice-Chief Executive Officer
Rudimar Dall Onder Gelson Luis Rostirolla Francisco Schmitt
Chief Industrial and CFO and Administrative and Investor Relations
Sales officer Controller Officer Officer
13
15. Location of industrial plants
Brazil
Plants
Farroupilha / RS – 2 units
Fortaleza / CE – 2 units
Sobral / CE – 7 units
Crato / CE – 1 unit
Teixeira de Freitas / BA – 1 unit
Farroupilha
Directors / R&D / MKT / Sales / Exports
/ Finance / Supplies / Plants
Carlos Barbosa
Molds
1515
16. Industrial plants
Installed capacity:
200,000,000 pairs / year
Sobral / CE
Farroupilha / RS Carlos Barbosa / RS Fortaleza / CE Crato / CE Teixeira de
Freitas/BA 16
30. Social responsability
Over the
years
Grendene has
helped to put
on the shoes
of people.
30
31. Social and Environmental
Responsability
PVC that is unused or damaged in the Unused paints are removed from the
process, plus leftovers and scraps are water for reuse of the paint and the
fully reused. water.
31
32. Social and Environmental
Responsability
The water is treated in a decantation lake The water used for watering the plants
and reused for conserving the comes from reusing factory water.
vegetation.
32
34. Brazil´s footwear sector
Profile
8,094 producers in 2009
325,000 direct employees
Production: 858 million pairs in 2010* (814 million pairs in 2009)
World´s 3rd largest producer.
Apparent consumption, Brazilian domestic market: 744 million pairs, and 3.9
pairs per capita in 2010 (717 million pairs and 3.7 pairs in 2009)
Exports in 2010: 143 million pairs to more than 140 countries (+12.9% vs.
2009)
Source:
IEMI/RAIS/ABICALÇADOS/SECEX
(*) Estimate by Abicalçados – January/2011
The industry itself is not much more than 100 years old – companies are
typically small and labor-intensive, with no entry or exit barriers.
34
35. Footwear sector
2008
The 5 principal countries
12.000
produce: 13,873 million
9.806 pairs = 82% of total
10.000
world production of
Million pairs
8.000 16,887 million pairs.
6.000
4.000 3.014
2.012
2.000 816 676 563
-
China India Brazil Vietnam Indonesia Others
Source: IEMI / World Shoe Review 2009 / ABICALÇADOS 35
36. The footwear sector in Brazil
Million pairs 2006 2007 2008 2009 2010
Production 830 808 816 814 858*
Imports 19 29 39 30 29
Exports 180 177 166 127 143
Apparent consumption 669 660 689 717 744*
Per capita consumption 3.6 3.5 3.6 3.7 3.9*
* Estimate by Abicalçados – January/2011
Source: IEMI / SECEX / ABICALÇADOS
Consumption – 2007 Total Per capita
USA 2,393 7.94
United Kindgom 451 7.42
Italy 387 6.65
Source: Satra 2008 /
France 417 6.55 Abicalçados / U.S. Census
Japan 707 5.55 Bureau
36
38. Exports: Grendene vs. Brazil
Brazilian exports Grendene
CAGR (2001/2010): (2.0%) CAGR (2001/2010): 15.5%
250 60 55
212
189 190180 48 48
200 171 177 50
Million pairs / year
164 166 40
143 40
150 127 32
30 27 29 28
100
20 15 16
50 10
0 0
2001
2002
2003
2004
2005
2006
2007
2008
2009
2010
2001
2002
2003
2004
2005
2006
2007
2008
2009
2010
Grendene´s exports were 38.2% of total Brazilian
Source: DECEX / MDIC / ABICALÇADOS
footwear exports in 2010. (38.1% in 2009)
38
39. Strategy: Break paradigms
Less labor-intensive
More capital-intensive
Higher entry barriers
Highly marketing
Melissa + Gaetano Pesce intensive
39
40. Our expertise of more than 35 years,
producing innovative footwear and
generating desired brands, shows the
success of our vision of the market, our
strategy and our business model – and our
capacity to create value for stockholders.
40
41. Value proposition
Brands
Products Marketing Management
Constant creation Aggresive marketing Scale gains, scope
of products Licenses with gains
Innovative design
celebrities Profitability
Segmentation Continuous
Manufacturing Investment in media improvement
technology / events Financial solidity
Few products in Strong relationship Sustainable
large scale with trade growth
Value for stakeholders
41
42. Products
Products for all the
Products that meet
income levels: A, B, C,
essential and basic
D and E – with very
needs at low cost.
good cost x benefit.
42
71. Net cash, cash and cash equivalents
and debt
996 1.031
939 927 859
860 845
794
815 852
758 756 793
733 733
R$ million
664
(104) (52) (45)
(131)
(206) (238) (194) (178)
31/03/09 30/06/09 30/09/09 31/12/09 31/03/10 30/06/10 30/09/10 31/12/10
Cash and cash equivalents Debt Net cash
Strong cash flow
71
72. Dividends
R$ 0.3991 R$ 0.4048
R$ 0.3633 R$ 0.3667
46.0% 45.5%
R$
%
40.4% 38.9%
4.9% 6.7% 5.8% 4.7%
2007 2008 2009 2010
Dividendo por ação (R$) Dividend yield (%) Payout (%)
Dividend yield: Profit per share divided by average value of the share in the year.
72
73. Low need for CAPEX
40
35
35 33
30
24
25
R$ million
20
20
15
10
5
0
2007 2008 2009 2010
73
74. Outlook
• Galeria Melissa (the brand´s concept store): In
the next two years Grendene will open
Galeria Melissa in New York, Paris and Tokyo.
74
75. Perspectivas
Targets for:
2009 – 2013 / 2011-2015
Growth of gross revenue at a CAGR
between 8% and 12% in the five years.
Growth of net profit at a CAGR between
12 and 15% in the five years.
Advertising expenses: average: 8% - 10%
of net revenue in this period.
Our view is that, in this period, we may have years with greater
growth that these rates, as was the case in 2009, and others with
less growth, but on average we intend to meet this target.
75
76. Thank You!
Grendene s IR Team
Francisco Schmitt
Investor Relations Officer
schmitt@grendene.com.br 40 years old
(5554) 2109.9022
Secretary
Cátia Gastmann
(5554) 2109.9011
Analysts
Alexandre Vizzotto Lenir Baretta
(5554) 2109.9036 (5554) 2109.9026
Further information
Internet: http://ri.grendene.com.br / Email: dri@grendene.com.br
76