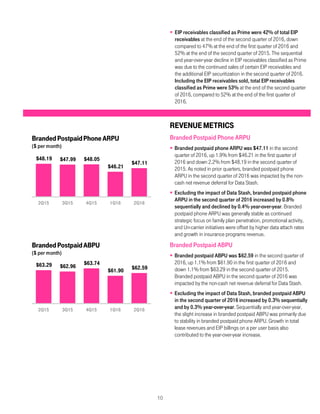
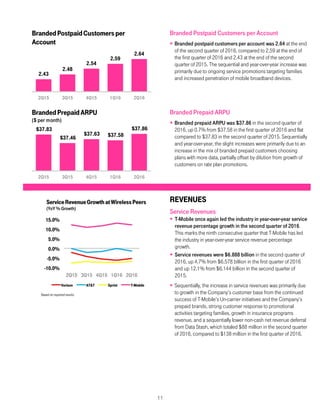
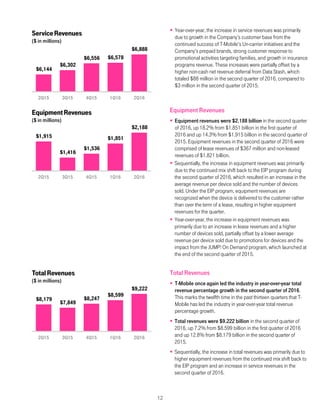
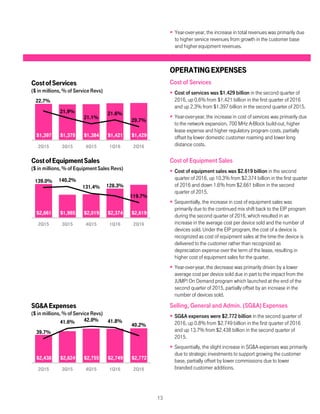
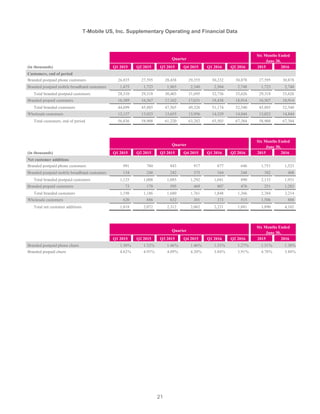
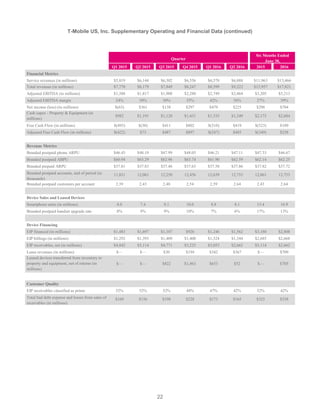
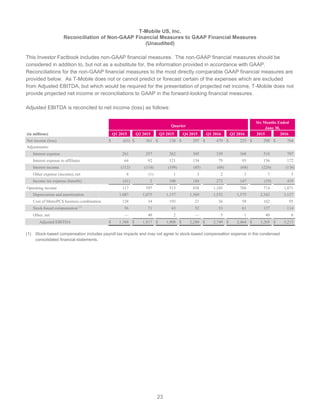
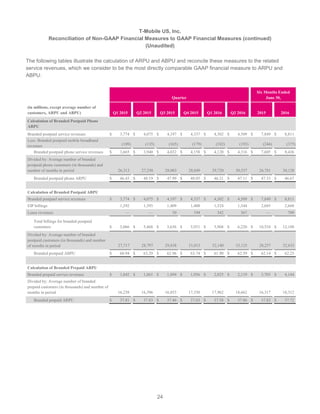
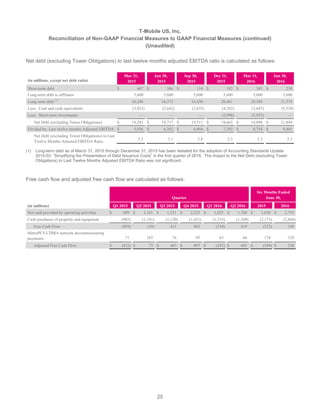
SlideShare a Scribd company logo
1
2
—John Legere
President and CEO of T-Mobile
T-MobileUS,Inc.
Investor Factbook
T-MobileUSReportsSecond Quarter2016Results
1.9 Million Customer Nets, Record-Low Churn of 1.27%, Net Income of $225
Million, 12% Service Revenue Growth and 36% Adjusted EBITDA Growth Year-
over-Year
SecondQuarter2016Highlights:
Customer momentum continues for the fastest growing wireless company in America:
 1.9 million total net adds - 13th consecutive quarter of over 1 million
 890,000 branded postpaid net adds
 646,000 branded postpaid phone net adds - led industry in branded postpaid phone net adds for the 10th
consecutive quarter
 476,000 branded prepaid net adds - up 167% YoY due to strong growth from MetroPCS
 Record-low branded postpaid phone churn of 1.27% - down 6 bps QoQ and 5 bps YoY
Customer growth translating into industry-leading financial growth:
 $6.9 billion service revenues, up 12.1% YoY
 T-Mobile led industry in YoY service revenue percentage growth for 9th consecutive quarter
 $9.2 billion total revenues, up 12.8% YoY
 T-Mobile led industry in YoY total revenue percentage growth for 12th time in past 13 quarters
 Net income of $225 million and earnings per share of $0.25
 $2.5 billion Adjusted EBITDA, up 35.6% YoY
 36% Adjusted EBITDA margin, up from 30% in the second quarter of 2015
 Branded postpaid phone ARPU of $47.11, up 1.9% QoQ and generally stable adjusting for Data Stash
Continued improvements in America’s fastest and fastest growing 4G LTE network:
 Fastest 4G LTE network in the US - leading in average download speeds for 10th consecutive quarter
 311 million POPs covered with 4G LTE
 “Extended Range LTE” covers more than 200 million POPs across 350 market areas
Raising customer outlook and narrowing Adjusted EBITDA target for 2016:
 Guidance range for branded postpaid net adds increased to 3.4 to 3.8 million from 3.2 to 3.6 million
 Narrowing Adjusted EBITDA target to $9.8 to $10.1 billion from $9.7 to $10.2 billion
 Guidance includes aggregate impact of leasing and Data Stash now expected to be $0.8 to $1.0 billion,
and the $0.6 billion spectrum gain in the first quarter of 2016
 Maintaining guidance of $4.5 to $4.8 billion of cash capital expenditures
“We outperformed the competition again on every key metric, while delivering the best postpaid phone churn
numbers in our history!” said John Legere, President and CEO of T-Mobile. “Quarter after quarter this team
continues to deliver results that are the best in the business despite the competition’s best efforts to compete.”
3
CUSTOMERMETRICS
Branded Postpaid Customers
 Branded postpaid net customer additions were 890,000 in
the second quarter of 2016 compared to 1,041,000 in the
first quarter of 2016 and 1,008,000 in the second quarter of
2015. The sequential and year-over-year decline in branded
postpaid net customer additions was primarily due to the
absence of iconic device launches in the period.
 Branded postpaid phone net customer additions were
646,000 in the second quarter of 2016, compared to 877,000
in the first quarter of 2016 and 760,000 in the second quarter
of 2015. T-Mobile led the industry in branded postpaid
phone net customer additions for the 10th
consecutive
quarter.
 Branded postpaid mobile broadband net customer
additions were 244,000 in the second quarter of 2016,
compared to 164,000 in the first quarter of 2016 and 248,000
in the second quarter of 2015.
 Branded postpaid phone churn was 1.27% in the second
quarter of 2016, down 6 basis points from 1.33% in the first
quarter of 2016 and down 5 basis points from 1.32% in the
second quarter of 2015. This quarter marked the best ever
branded postpaid phone churn performance in the
Company’s history. The sequential and year-over-year
decline in churn reflects a reduction in promotional activity
across the industry in the second quarter of 2016 as well as
ongoing improvements in the Company’s network, customer
service, and the overall value of its offerings in the
marketplace, resulting in increased customer satisfaction and
loyalty.
 In June 2016, T-Mobile entered into an agreement under
which the Company agreed to sell its marketing and
distribution rights to certain existing T-Mobile co-branded
customers to a current MVNO partner. The transaction,
expected to close late third quarter of 2016, is subject to
regulatory approval and other closing conditions. Assuming
closing, approximately 1.4 million branded postpaid phone
customers and approximately 0.3 million branded prepaid
customers would transition to being reported as wholesale
customers. The customer transition is expected to have a
significant impact on reported branded postpaid phone
churn following closing. For example, on a pro-forma basis as
if the transaction closed at the beginning of the second
quarter of 2016, reported branded postpaid phone churn
would have been 18 basis points lower at 1.09%.
760 843 917 877 646
248 242 375 164
244
2Q15 3Q15 4Q15 1Q16 2Q16
TotalBrandedPostpaidNetAdds
(in thousands)
Phone Mobile Broadband
1,008 1,085
1,292
1,041
890
1.32%
1.46% 1.46%
1.33%
1.27%
2Q15 3Q15 4Q15 1Q16 2Q16
BrandedPostpaidPhoneChurn
4
Branded Prepaid Customers
 Branded prepaid net customer additions were 476,000 in the
second quarter of 2016, compared to 807,000 in the first
quarter of 2016 and 178,000 in the second quarter of 2015.
The sequential decline was primarily due to seasonal factors.
The year-over-year increase was primarily driven by successful
MetroPCS promotional activities and continued growth in new
markets.
 Migrations to branded postpaid plans reduced branded
prepaid net customer additions in the second quarter of 2016
by approximately 210,000, up from 200,000 in the first quarter
of 2016 and 175,000 in the second quarter of 2015.
 Branded prepaid churn was 3.91% in the second quarter of
2016, compared to 3.84% in the first quarter of 2016 and
4.93% in the second quarter of 2015. The sequential increase
was primarily due to seasonal factors. The year-over-year
decline was primarily impacted by strong performance at the
MetroPCS brand and a methodology change that occurred in
the third quarter of 2015.
Total Branded Customers
 Total branded net customer additions were 1,366,000 in the
second quarter of 2016 compared to 1,848,000 in the first
quarter of 2016 and 1,186,000 in the second quarter of 2015.
This was the 10th
consecutive quarter in which branded net
customer additions surpassed the one million milestone.
Wholesale Customers
 Wholesale net customer additions were 515,000 in the
second quarter of 2016 compared to 373,000 in the first quarter
of 2016 and 886,000 in the second quarter of 2015.
178
595
469
807
476
2Q15 3Q15 4Q15 1Q16 2Q16
TotalBrandedPrepaidNetAdds
(in thousands)
4.93%
4.09% 4.20%
3.84% 3.91%
2Q15 3Q15 4Q15 1Q16 2Q16
BrandedPrepaidChurn
1,186
1,680 1,761 1,848
1,366
2Q15 3Q15 4Q15 1Q16 2Q16
TotalBrandedNetAdds
(in thousands)
886
632
301
373
515
2Q15 3Q15 4Q15 1Q16 2Q16
WholesaleNetAdds
(in thousands)
5
Total Customers
 Total net customer additions were 1,881,000 in the second
quarter of 2016 compared to 2,221,000 in the first quarter of
2016 and 2,072,000 in the second quarter of 2015. This was
the 13th
consecutive quarter in which total net customer
additions exceeded one million.
 T-Mobile ended the second quarter of 2016 with 67.4 million
total customers, up more than 24 million customers on a pro
forma combined basis from the end of the first quarter of 2013,
when T-Mobile launched the first Un-carrier initiative.
T-MobileCoverageMap
(as of June 30, 2016)
NETWORK
Network Modernization Update
 T-Mobile now provides 4G LTE coverage to 311 million
people. This is up from 308 million as of the first quarter 2016
earnings, and 290 million as of the second quarter 2015
earnings.
 Wideband LTE, which refers to markets that have bandwidth
of at least 15+15 MHz dedicated to 4G LTE, is now available
nationwide, covering 224 million people.
 Voice over LTE (“VoLTE”) comprised 57% of total voice call
minutes in the second quarter of 2016 compared to 16% in the
second quarter of 2015. Moving voice traffic to VoLTE frees up
capacity and allows for an accelerated re-farming of spectrum
currently used for 2G and 3G. T-Mobile is leading the US
wireless industry in terms of VoLTE migration.
Based on T-Mobile’s analysis of crowd-sourced 4G LTE download speeds.
Network Speed
 T-Mobile continues to have the fastest nationwide 4G LTE
network in the U.S. based on download speeds from millions of
user-generated tests. This is the tenth consecutive quarter that
T-Mobile has led the industry in average download speeds.
 In the second quarter of 2016, T-Mobile’s average 4G LTE
download speed was 22.4 Mbps compared to Verizon at 21.6
Mbps, AT&T at 20.7 Mbps, and Sprint at 16.1 Mbps.
2,072
2,312
2,062 2,221
1,881
2Q15 3Q15 4Q15 1Q16 2Q16
TotalNetAdds
(in thousands)
22.4 21.6 20.7
16.1
T-Mobile Verizon AT&T Sprint
Average4GLTESpeeds-2Q16
(in Mbps)
6
Spectrum
 At the end of the second quarter of 2016, T-Mobile owns or has
agreements to own an average of 86 MHz of spectrum across
the top 25 markets in the U.S. The spectrum is comprised of an
average of 12 MHz in the 700 MHz band, 30 MHz in the 1900
MHz PCS band, and 44 MHz in the AWS band.
 During the first and second quarters of 2016, T-Mobile entered
into agreements with multiple parties to acquire 700 MHz A-
Block spectrum licenses covering approximately 59 million
POPs for $1.1 billion. These transactions, the majority of which
are expected to close in the second half of 2016, will increase T-
Mobile’s low-band spectrum holdings from 210 million POPs to
269 million POPs upon closing and include the cities of
Chicago, Nashville, Salt Lake City and Columbus.
 The Company is a qualified bidder in the 600 MHz broadcast
incentive auction.
A-Block Update
 T-Mobile owns or has agreements to own 700 MHz A-Block
spectrum covering 269 million people or approximately 83%
of the U.S. population. The spectrum covers all of the top 10
market areas and 29 of the top 30 market areas in the U.S.
 T-Mobile has deployed its 700 MHz A-Block spectrum in 350
market areas covering more than 200 million people under
the brand name “Extended Range LTE.” Extended Range LTE
travels up to twice as far as mid-band spectrum and works up to
four times better in buildings. The Company expects to continue
to aggressively roll-out new 700 MHz sites in 2016 including the
cities of San Francisco, Phoenix, San Diego, and Las Vegas.
UN-CARRIERINITIATIVES
 At the end of the second quarter of 2016, 95% of the branded
postpaid customer base was on a Simple Choice plan, up
from 94% at the end of the first quarter of 2016 and 93% at the
end of the second quarter of 2015.
 At the end of the second quarter of 2016, 14.0 million
customers were enrolled in T-Mobile’s JUMP! programs, up
from 13.7 million at the end of the first quarter of 2016 and 11.3
million at the end of the second quarter of 2015.
Un-carrier Updates
 Un-carrier 11: GET THANKED: On June 6, 2016, T-Mobile
introduced its eleventh Un-carrier move, a set of initiatives
dedicated exclusively to thanking T-Mobile customers. It was the
biggest Un-carrier yet in terms of media coverage and social
media discussions.
700MHz,
12
PCS,30
AWS,44
T-Mobile AverageSpectrum
Ownership,Top25Markets
(Band, in MHz)
11.3 12.2
13.3 13.7 14.0
2Q15 3Q15 4Q15 1Q16 2Q16
TotalCustomersEnrolledin JUMP!
Programs
(in millions)
7
 Stock Up™ is a program that provides eligible T-Mobile
customers the opportunity to become T-Mobile owners by
offering every existing and new account holder a full share of T-
Mobile common stock. Customers can also grow their
ownership by up to 100 shares per year by earning one share for
every new active account they refer.
 As part of Un-carrier 11, the Company also launched T-Mobile
Tuesdays, a program that thanks all of our eligible customers
with free stuff and a chance to win epic prizes every Tuesday. All
customers need to do to get thanked is to download the T-Mobile
Tuesdays app and check in every Tuesday to claim their gifts.
Since T-Mobile Tuesdays launched, the app was ranked #1 on
the Apple App Store and has been downloaded nearly 5 million
times, and customers have hit the redemption button 8 million
times to receive their gifts.
 T-Mobile continues to add new and exciting gifts and prizes to
the T-Mobile Tuesdays line-up. Most recently, the Company
added free, unlimited data for Pokemon Go for a full year.
 Binge On Amped: T-Mobile has continued to expand its popular
video initiative to include even more services that can stream
without using up customers’ high-speed data allotment. More
than 100 video services now qualify including new services like
PBS, ABC and Disney Channel in addition to initial program
participants like Netflix, Hulu and HBO GO. T-Mobile customers
have streamed more than three quarters of a billion hours of
video without using their high-speed data allowance since the
launch of Binge On in November 2015.
DEVICES
 Total devices sold or leased were 8.9 million units in the
second quarter of 2016 compared to 9.4 million units in the first
quarter of 2016 and 8.3 million units in the second quarter of
2015.
 Total smartphones sold or leased were 8.1 million units in the
second quarter of 2016 compared to 8.8 million units in the first
quarter of 2016 and 7.4 million units in the second quarter of
2015.
 The upgrade rate for branded postpaid customers was
approximately 6% in the second quarter of 2016 compared to
approximately 7% in the first quarter of 2016 and approximately
9% in the second quarter of 2015.
24
56
87
102
4Q15 1Q16 2Q16 Current
Binge OnServicePartners
DevicesSoldorLeased
(in million units)
2Q15 1Q16 2Q16
Total Company
Smartphones 7.4 8.8 8.1
Non-Smartphones 0.5 0.2 0.3
Mobile Broadband Devices 0.4 0.4 0.5
Total Company 8.3 9.4 8.9
8
DEVICEFINANCING
Equipment Installment Plans (EIP)
 T-Mobile financed $1.562 billion of equipment sales on EIP in
the second quarter of 2016, up 25.4% from $1.246 billion in the
first quarter of 2016 and down 8.0% from $1.697 billion in the
second quarter of 2015. The sequential increase was primarily
due to the mix shift back to the EIP program which started in the
first quarter of 2016 and continued in the second quarter of
2016. The year-over-year decrease was primarily due to
promotions for devices, the impact of the JUMP! On Demand
program launched at the end of the second quarter of 2015, and
a lower upgrade rate for branded postpaid customers.
 Customers on Simple Choice plans had associated EIP
billings of $1.344 billion in the second quarter of 2016, up
1.5% compared to $1.324 billion in the first quarter of 2016 and
down 3.5% from $1.393 billion in the second quarter of 2015.
The sequential increase was primarily due to a higher level of
devices financed using EIP plans. The year-over-year decline
was primarily due to promotions for devices, the impact of the
JUMP! On Demand program launched at the end of the second
quarter of 2015, and a lower upgrade rate for branded postpaid
customers in the second quarter of 2016.
 Total EIP receivables, net of imputed discount and
allowances for credit losses, was $2.662 billion at the end of
the second quarter of 2016 compared to $3.053 billion at the
end of the first quarter of 2016 and $5.114 billion at the end of
the second quarter of 2015. The sequential and year-over-year
decline in the total EIP receivables, net was primarily due to
sales of certain EIP receivables and the impact of the JUMP! On
Demand program launched at the end of the second quarter of
2015.
 In the second quarter of 2016, T-Mobile amended the terms of
its arrangement to sell certain EIP accounts receivable to
increase its maximum funding commitment thereunder from
$800 million to $1.3 billion. As of June 30, 2016, the
arrangement provided funding of $1.2 billion, an increase of
$0.4 billion, compared to March 31, 2016. T-Mobile will
continue to service the customers and the related receivables,
including facilitating customer payment collection, in exchange
for a monthly fee.
Leasing Plans
 Leased devices transferred from inventory to property and
equipment, net was $52 million in the second quarter of 2016
compared to $653 million in the first quarter of 2016. The
sequential decline was primarily due to the continued mix shift
back to the EIP program in the second quarter of 2016.
$272
$(343) $(1,546) $(172) $(391)
$5,114 $4,771
$3,225 $3,053 $2,662
2Q15 3Q15 4Q15 1Q16 2Q16
TotalEIPReceivables,netandQoQ
Changein TotalEIPReceivables
($ in millions)
QoQChginTotalEIP TotalEIPRec.,net
9
 Depreciation expense associated with leased devices was
$397 million in the second quarter of 2016 compared to $403
million in the first quarter of 2016.
 Leased devices included in property and equipment, net were
$1.878 billion at the end of the second quarter of 2016
compared to $2.223 billion at the end of the first quarter of
2016.
 Lease revenues were $367 million in the second quarter of
2016 compared to $342 million in the first quarter of 2016.
 Original consideration received and lease revenues, net were
$327 million in the second quarter of 2016, down from $377
million in the first quarter of 2016. Original consideration
represents cash down payments received from customers at
operating lease inception, which is amortized over the term of
the lease. Lease revenues, net exclude amortization of the
original consideration.
 The difference between the original consideration received and
lease revenues, net, and the amount of leased devices
transferred from inventory to property and equipment, net of
returns approximates the working capital impact of leasing.
 Future minimum lease payments expected to be received over
the lease term were $1.178 billion at the end of the second
quarter of 2016, down from $1.425 billion at the end of the first
quarter of 2016. Future minimum lease payments exclude
optional residual buy-out amounts at the end of the lease term.
CUSTOMERQUALITY
 Total bad debt expense and losses from sales of receivables
was $165 million in the second quarter of 2016 compared to
$173 million in the first quarter of 2016 and $156 million in the
second quarter of 2015.
 As a percentage of total revenues, total bad debt expense
and losses from sales of receivables was 1.79% in the second
quarter of 2016 compared to 2.01% in the first quarter of 2016
and 1.91% in the second quarter of 2015.
 Total bad debt expense and losses from sales of receivables
was sequentially lower in the second quarter of 2016. Typically,
bad debt expense tends to increase seasonally in the second
half of the year compared to the first half.
$87
$293 $377 $327
$822
$1,463
$653
$52
3Q15 4Q15 1Q16 2Q16
LeasedDevicesTransferredto P&E,
netandOriginal Consideration
Received&LeaseRevenues,Net
($ in millions)
Cons. Rec'd&LeaseRevs,Net LeasedDevicesTrans.toP&E
$156 $198 $228 $173 $165
1.91%
2.52% 2.76%
2.01% 1.79%
2Q15 3Q15 4Q15 1Q16 2Q16
TotalBadDebtExpenseandLosses
fromSalesofReceivables
($ in millions, % of Total Revs)
10
 EIP receivables classified as Prime were 42% of total EIP
receivables at the end of the second quarter of 2016, down
compared to 47% at the end of the first quarter of 2016 and
52% at the end of the second quarter of 2015. The sequential
and year-over-year decline in EIP receivables classified as Prime
was due to the continued sales of certain EIP receivables and
the additional EIP securitization in the second quarter of 2016.
Including the EIP receivables sold, total EIP receivables
classified as Prime were 53% at the end of the second quarter
of 2016, compared to 52% at the end of the first quarter of
2016.
REVENUEMETRICS
Branded Postpaid Phone ARPU
 Branded postpaid phone ARPU was $47.11 in the second
quarter of 2016, up 1.9% from $46.21 in the first quarter of
2016 and down 2.2% from $48.19 in the second quarter of
2015. As noted in prior quarters, branded postpaid phone
ARPU in the second quarter of 2016 was impacted by the non-
cash net revenue deferral for Data Stash.
 Excluding the impact of Data Stash, branded postpaid phone
ARPU in the second quarter of 2016 increased by 0.8%
sequentially and declined by 0.4% year-over-year. Branded
postpaid phone ARPU was generally stable as continued
strategic focus on family plan penetration, promotional activity,
and Un-carrier initiatives were offset by higher data attach rates
and growth in insurance programs revenue.
Branded Postpaid ABPU
 Branded postpaid ABPU was $62.59 in the second quarter of
2016, up 1.1% from $61.90 in the first quarter of 2016 and
down 1.1% from $63.29 in the second quarter of 2015.
Branded postpaid ABPU in the second quarter of 2016 was
impacted by the non-cash net revenue deferral for Data Stash.
 Excluding the impact of Data Stash, branded postpaid ABPU
in the second quarter of 2016 increased by 0.3% sequentially
and by 0.3% year-over-year. Sequentially and year-over-year,
the slight increase in branded postpaid ABPU was primarily due
to stability in branded postpaid phone ARPU. Growth in total
lease revenues and EIP billings on a per user basis also
contributed to the year-over-year increase.
$48.19 $47.99 $48.05
$46.21
$47.11
2Q15 3Q15 4Q15 1Q16 2Q16
BrandedPostpaidPhoneARPU
($ per month)
$63.29 $62.96
$63.74
$61.90 $62.59
2Q15 3Q15 4Q15 1Q16 2Q16
BrandedPostpaidABPU
($ per month)
11
Branded Postpaid Customers per Account
 Branded postpaid customers per account was 2.64 at the end
of the second quarter of 2016, compared to 2.59 at the end of
the first quarter of 2016 and 2.43 at the end of the second
quarter of 2015. The sequential and year-over-year increase was
primarily due to ongoing service promotions targeting families
and increased penetration of mobile broadband devices.
Branded Prepaid ARPU
 Branded prepaid ARPU was $37.86 in the second quarter of
2016, up 0.7% from $37.58 in the first quarter of 2016 and flat
compared to $37.83 in the second quarter of 2015. Sequentially
and year-over-year, the slight increases were primarily due to an
increase in the mix of branded prepaid customers choosing
plans with more data, partially offset by dilution from growth of
customers on rate plan promotions.
REVENUES
Service Revenues
 T-Mobile once again led the industry in year-over-year service
revenue percentage growth in the second quarter of 2016.
This marks the ninth consecutive quarter that T-Mobile has led
the industry in year-over-year service revenue percentage
growth.
 Service revenues were $6.888 billion in the second quarter of
2016, up 4.7% from $6.578 billion in the first quarter of 2016
and up 12.1% from $6.144 billion in the second quarter of
2015.
 Sequentially, the increase in service revenues was primarily due
to growth in the Company’s customer base from the continued
success of T-Mobile’s Un-carrier initiatives and the Company’s
prepaid brands, strong customer response to promotional
activities targeting families, growth in insurance programs
revenue, and a sequentially lower non-cash net revenue deferral
from Data Stash, which totaled $88 million in the second quarter
of 2016, compared to $138 million in the first quarter of 2016.
2.43
2.48
2.54
2.59
2.64
2Q15 3Q15 4Q15 1Q16 2Q16
BrandedPostpaidCustomersper
Account
$37.83
$37.46
$37.63 $37.58
$37.86
2Q15 3Q15 4Q15 1Q16 2Q16
BrandedPrepaidARPU
($ per month)
12
 Year-over-year, the increase in service revenues was primarily
due to growth in the Company’s customer base from the
continued success of T-Mobile’s Un-carrier initiatives and the
Company’s prepaid brands, strong customer response to
promotional activities targeting families, and growth in insurance
programs revenue. These increases were partially offset by a
higher non-cash net revenue deferral from Data Stash, which
totaled $88 million in the second quarter of 2016, compared to
$3 million in the second quarter of 2015.
Equipment Revenues
 Equipment revenues were $2.188 billion in the second quarter
of 2016, up 18.2% from $1.851 billion in the first quarter of
2016 and up 14.3% from $1.915 billion in the second quarter of
2015. Equipment revenues in the second quarter of 2016 were
comprised of lease revenues of $367 million and non-leased
revenues of $1.821 billion.
 Sequentially, the increase in equipment revenues was primarily
due to the continued mix shift back to the EIP program during
the second quarter of 2016, which resulted in an increase in the
average revenue per device sold and the number of devices
sold. Under the EIP program, equipment revenues are
recognized when the device is delivered to the customer rather
than over the term of a lease, resulting in higher equipment
revenues for the quarter.
 Year-over-year, the increase in equipment revenues was
primarily due to an increase in lease revenues and a higher
number of devices sold, partially offset by a lower average
revenue per device sold due to promotions for devices and the
impact from the JUMP! On Demand program, which launched at
the end of the second quarter of 2015.
Total Revenues
 T-Mobile once again led the industry in year-over-year total
revenue percentage growth in the second quarter of 2016.
This marks the twelfth time in the past thirteen quarters that T-
Mobile has led the industry in year-over-year total revenue
percentage growth.
 Total revenues were $9.222 billion in the second quarter of
2016, up 7.2% from $8.599 billion in the first quarter of 2016
and up 12.8% from $8.179 billion in the second quarter of
2015.
 Sequentially, the increase in total revenues was primarily due to
higher equipment revenues from the continued mix shift back to
the EIP program and an increase in service revenues in the
second quarter of 2016.
$6,144
$6,302
$6,556 $6,578
$6,888
2Q15 3Q15 4Q15 1Q16 2Q16
ServiceRevenues
($ in millions)
$1,915
$1,416
$1,536
$1,851
$2,188
2Q15 3Q15 4Q15 1Q16 2Q16
EquipmentRevenues
($ in millions)
$8,179
$7,849
$8,247
$8,599
$9,222
2Q15 3Q15 4Q15 1Q16 2Q16
TotalRevenues
($ in millions)
13
 Year-over-year, the increase in total revenues was primarily due
to higher service revenues from growth in the customer base
and higher equipment revenues.
OPERATINGEXPENSES
Cost of Services
 Cost of services was $1.429 billion in the second quarter of
2016, up 0.6% from $1.421 billion in the first quarter of 2016
and up 2.3% from $1.397 billion in the second quarter of 2015.
 Year-over-year, the increase in cost of services was primarily due
to the network expansion, 700 MHz A-Block build-out, higher
lease expense and higher regulatory program costs, partially
offset by lower domestic customer roaming and lower long
distance costs.
Cost of Equipment Sales
 Cost of equipment sales was $2.619 billion in the second
quarter of 2016, up 10.3% from $2.374 billion in the first quarter
of 2016 and down 1.6% from $2.661 billion in the second
quarter of 2015.
 Sequentially, the increase in cost of equipment sales was
primarily due to the continued mix shift back to the EIP program
during the second quarter of 2016, which resulted in an
increase in the average cost per device sold and the number of
devices sold. Under the EIP program, the cost of a device is
recognized as cost of equipment sales at the time the device is
delivered to the customer rather than recognized as
depreciation expense over the term of the lease, resulting in
higher cost of equipment sales for the quarter.
 Year-over-year, the decrease was primarily driven by a lower
average cost per device sold due in part to the impact from the
JUMP! On Demand program which launched at the end of the
second quarter of 2015, partially offset by an increase in the
number of devices sold.
Selling, General and Admin. (SG&A) Expenses
 SG&A expenses were $2.772 billion in the second quarter of
2016, up 0.8% from $2.749 billion in the first quarter of 2016
and up 13.7% from $2.438 billion in the second quarter of
2015.
 Sequentially, the slight increase in SG&A expenses was primarily
due to strategic investments to support growing the customer
base, partially offset by lower commissions due to lower
branded customer additions.
$1,397 $1,378 $1,384 $1,421 $1,429
22.7%
21.9%
21.1%
21.6%
20.7%
2Q15 3Q15 4Q15 1Q16 2Q16
CostofServices
($ in millions, % of Service Revs)
$2,661 $1,985 $2,019 $2,374 $2,619
139.0% 140.2%
131.4% 128.3%
119.7%
2Q15 3Q15 4Q15 1Q16 2Q16
CostofEquipmentSales
($ in millions, % of Equipment Sales Revs)
$2,438 $2,624 $2,755 $2,749 $2,772
39.7%
41.6% 42.0% 41.8%
40.2%
2Q15 3Q15 4Q15 1Q16 2Q16
SG&AExpenses
($ in millions, % of Service Revs)
14
 Year-over-year, the increase was primarily due to strategic
investments to support the growing customer base including
higher promotional costs, employee-related expenses and
commissions driven by higher branded customer additions.
Depreciation and Amortization (D&A)
 D&A was $1.575 billion in the second quarter of 2016, up 1.5%
from $1.552 billion in the first quarter of 2016 and up 46.5%
from $1.075 billion in the second quarter of 2015. D&A in the
second quarter of 2016 was comprised of device lease-related
D&A of $397 million and non-device lease-related D&A of
$1.178 billion.
 Sequentially, the increase in D&A was primarily due to an
increase in non-device lease related D&A related to the
continued build-out of the Company’s 4G LTE network, partially
offset by a decrease in device lease-related D&A.
 Year-over-year, the increase was primarily due to the impact of
leasing. Under leasing, the cost of the leased device is
recognized as depreciation expense over the term of the lease
rather than recognized as cost of equipment sales when the
device is delivered to the customer. The total number of leased
devices was higher year-over-year, resulting in higher
depreciation expense.
ADJUSTEDEBITDA
 T-Mobile led the industry in year-over-year Adjusted EBITDA
percentage growth in the second quarter of 2016.
 Adjusted EBITDA was $2.464 billion in the second quarter of
2016, down 10.4% from $2.749 billion in the first quarter of
2016 and up 35.6% from $1.817 billion in the second quarter of
2015.
 Excluding spectrum gains from the first quarter of 2016 and
the second quarter of 2015, Adjusted EBITDA increased by
16.6% sequentially and by 37.3% year-over-year.
 Sequentially, the decline in Adjusted EBITDA was primarily due
to the spectrum gain recorded in the first quarter of 2016.
Excluding the spectrum gain, Adjusted EBITDA increased
primarily due to growth in the customer base and lower losses
on equipment, and a sequentially lower non-cash impact of Data
Stash.
 Year-over-year, the increase in Adjusted EBITDA was primarily
due to growth in the customer base and lower losses on
equipment, partially offset by higher SG&A expenses due to
strategic investments to support the growing customer base and
a higher non-cash impact of Data Stash.
$1,075 $1,157 $1,369 $1,552 $1,575
13.1%
14.7%
16.6%
18.0% 17.1%
2Q15 3Q15 4Q15 1Q16 2Q16
D&AExpenses
($ in millions, % of Total Revs)
$1,817 $1,908
$2,280
$2,749
$2,464
2Q15 3Q15 4Q15 1Q16 2Q16
AdjustedEBITDA
($ in millions)
15
 Adjusted EBITDA margin was 36% in the second quarter of
2016 compared to 42% in the first quarter of 2016 and 30% in
the second quarter of 2015. Excluding spectrum gains from
the first quarter of 2016 and the second quarter of 2015,
Adjusted EBITDA margin was 36% in the second quarter of
2016, compared to 32% in the first quarter of 2016 and 29%
in the second quarter of 2015.
 The aggregate impact from leasing and Data Stash on
Adjusted EBITDA in the second quarter of 2016 was $279
million. Lease revenues were $367 million and the net impact
from Data Stash was $88 million in the second quarter of 2016.
NETINCOMEAND EARNINGSPER SHARE
 Net income was $225 million in the second quarter of 2016
compared to net income of $479 million in the first quarter of
2016 and $361 million in the second quarter of 2015.
 Earnings per share was $0.25 in the second quarter of 2016
compared to earnings per share of $0.56 in the first quarter of
2016 and $0.42 in the second quarter of 2015. Sequentially the
decrease was primarily due to the after-tax impact of the
spectrum gain of $0.46 in the first quarter of 2016. Year-over-
year, the decrease was due to several factors: higher interest
expense related to higher debt balances with third parties, lower
interest income, and lower income tax expense in the second
quarter of 2015 due to the impact of income tax benefits for
discrete income tax items recognized in 2015. These decreases
were offset by higher operating income.
CAPITALEXPENDITURES
 Cash capital expenditures for property and equipment were
$1.349 billion in the second quarter of 2016 compared to
$1.335 billion in the first quarter of 2016 and $1.191 billion in
the second quarter of 2015. The sequential and year-over-year
increases were primarily due to the timing of network spend in
connection with T-Mobile’s build out of its 4G LTE network.
 Cash capital expenditures for property and equipment for the six
months ended were $2.684 billion in 2016 compared to $2.173
billion for the same period in 2015, an increase of $511 million.
FREECASHFLOW
 Net cash provided by operating activities was $1.768 billion
in the second quarter of 2016, compared to $1.025 billion in the
first quarter of 2016 and $1.161 billion in the second quarter of
2015.
 Free Cash Flow was $419 million in the second quarter of
2016, compared to an outflow of $310 million in the first quarter
of 2016 and an outflow of $30 million in the second quarter of
2015. Sequentially, the increase in free cash flow was primarily
due to an increase in net cash provided by operating activities
including sales of certain EIP receivables. Year-over-year, the
$361
$138
$297
$479
$225
2Q15 3Q15 4Q15 1Q16 2Q16
NetIncome
($ in millions)
$1,191 $1,120 $1,431 $1,335 $1,349
19.4% 17.8%
21.8% 20.3% 19.6%
2Q15 3Q15 4Q15 1Q16 2Q16
CashCapitalExpenditures
($ in millions, % of Service Revs)
$(30)
$411
$802
$(310)
$419
2Q15 3Q15 4Q15 1Q16 2Q16
FreeCashFlow
($ in millions)
16
increase in free cash flow was primarily due to an increase in net
cash provided by operating activities, partially offset by an
increase in cash capital expenditures. Sequentially and year-
over-year, the net cash proceeds related to sales of certain EIP
receivables increased by $0.4 billion.
 Adjusted Free Cash Flow was $485 million in the second
quarter of 2016, compared to an outflow of $247 million in the
first quarter of 2016 and an inflow of $73 million in the second
quarter of 2015. Adjusted Free Cash Flow excludes
decommissioning payments related to the one-time shutdown of
the CDMA portion of the MetroPCS network. Decommissioning
payments in the second quarter of 2016 were $66 million,
compared to $63 million in the first quarter of 2016 and $103
million in the second quarter of 2015.
 Adjusted Free Cash Flow for the six months ended was $238
million in 2016 compared to an outflow of $349 million for the
same period in 2015 in spite of cash capital expenditures which
increased by $511 million, and the paydown of Accounts
payable and accrued liabilities amounting to $837 million in the
first half of 2016, compared to $546 million in the first half of
2015.
CAPITALSTRUCTURE
 Net debt, excluding tower obligations, at the end of the
second quarter of 2016 was $21.894 billion.
 Total debt, excluding tower obligations, at the end of the
second quarter of 2016 was $27.432 billion and was
comprised of short-term debt of $258 million, long-term debt to
affiliates of $5.600 billion, and long-term debt of $21.574 billion.
 The ratio of net debt, excluding tower obligations, to
Adjusted EBITDA for the trailing last twelve month (“LTM”)
period was 2.3x at the end of the second quarter of 2016
compared to 2.3x at the end of the first quarter of 2016 and 3.1x
at the end of the second quarter of 2015.
 The Company’s cash position remains strong with $5.538
billion in cash and cash equivalents at the end of the second
quarter of 2016. The cash and short-term investments balance
decreased in the second quarter of 2016 compared to the first
quarter of 2016 primarily due to the Company making a
refundable deposit of $2.203 billion to a third party in
connection with a potential asset purchase.
 On April 1, 2016, T-Mobile issued $1.0 billion of 6% Senior
Notes due 2024 in a registered public offering.
 On April 25, 2016, T-Mobile entered into a purchase agreement
with Deutsche Telekom AG (“Deutsche Telekom”), under which
T-Mobile may, at its option, issue and sell to Deutsche Telekom
up to $1.35 billion of 6.000% Senior Notes due 2024.
$73
$487
$897
$(247)
$485
2Q15 3Q15 4Q15 1Q16 2Q16
AdjustedFreeCashFlow
($ in millions)
$19.7 $19.5 $18.7 $19.9 $21.9
3.1x 2.8x 2.5x
2.3x
2.3x
2Q15 3Q15 4Q15 1Q16 2Q16
NetDebt(excl.TowerObligations)
($ in billions, Net Debt to LTM Adj. EBITDA)
17
 On April 29, 2016, T-Mobile and certain of its affiliates, as
guarantors, entered into another purchase agreement with
Deutsche Telekom, under which T-Mobile may, at its option,
issue and sell to Deutsche Telekom up to an additional $650
million of 6.000% Senior Notes due 2024.
 T-Mobile expects to use the net proceeds from these offerings
for the purchase of spectrum licenses, or if not used for
spectrum purchases, refinancing of existing debt, or general
corporate purposes.
GUIDANCE
 T-Mobile expects to drive further customer momentum while
delivering strong growth in Adjusted EBITDA and free cash flow
in 2016.
 Branded postpaid net customer additions for full-year 2016
are now expected to be between 3.4 and 3.8 million, an
increase from the previous guidance range of 3.2 to 3.6 million.
 For full-year 2016, T-Mobile now expects Adjusted EBITDA to
be in the range of $9.8 to $10.1 billion, narrowing the previous
guidance range of $9.7 to $10.2 billion. This guidance includes
the aggregate impact from leasing and Data Stash now
expected to be approximately $0.8 to $1.0 billion, and the
spectrum gain of $0.6 billion recognized in the first quarter of
2016.
 Cash capital expenditures for full-year 2016 are expected to
be in the range of $4.5 to $4.8 billion, unchanged from
previous guidance.
UPCOMINGEVENTS (All dates and attendance tentative)
 Oppenheimer 19th Annual Technology, Internet & Communications Conference, August 9-10, 2016, Boston, MA
 Goldman Sachs 25th Annual Communacopia Conference, September 20–22, 2016, New York, NY
 Deutsche Bank Leveraged Finance Conference, September 26–28, 2016, Scottsdale, AZ
CONTACTINFORMATION
Press: Investor Relations:
Media Relations Nils Paellmann, nils.paellmann@t-mobile.com
T-Mobile US, Inc. Ben Barrett, ben.barrett@t-mobile.com
Jon Perachio, jonathan.perachio@t-mobile.com
Cristal Dunkin, cristal.dunkin@t-mobile.com
877-281-TMUS or 212-358-3210
mediarelations@t-mobile.com investor.relations@t-mobile.com
http://newsroom.t-mobile.com http://investor.t-mobile.com
2016GuidanceOutlook
Original 1Q16 2Q16
Branded Postpaid Net Adds (in millions) 2.4 - 3.4 3.2 - 3.6 3.4 - 3.8
Adjusted EBITDA ($ in billions) $9.1 - $9.7 $9.7- $10.2 $9.8- $10.1
Cash Capex ($ in billions) $4.5 - $4.8 Unchanged Unchanged
18
T-Mobile US, Inc.
Condensed Consolidated Balance Sheets
(Unaudited)
(in millions, except share and per share amounts)
June 30,
2016
December 31,
2015
Assets
Current assets
Cash and cash equivalents $ 5,538 $ 4,582
Short-term investments — 2,998
Accounts receivable, net of allowances of $125 and $116 1,866 1,788
Equipment installment plan receivables, net 1,831 2,378
Accounts receivable from affiliates 39 36
Inventories 1,388 1,295
Asset purchase deposit 2,203 —
Other current assets 1,415 1,813
Total current assets 14,280 14,890
Property and equipment, net 20,570 20,000
Goodwill 1,683 1,683
Spectrum licenses 25,536 23,955
Other intangible assets, net 486 594
Equipment installment plan receivables due after one year, net 831 847
Other assets 582 444
Total assets $ 63,968 $ 62,413
Liabilities and Stockholders' Equity
Current liabilities
Accounts payable and accrued liabilities $ 6,985 $ 8,084
Payables to affiliates 203 135
Short-term debt 258 182
Deferred revenue 936 717
Other current liabilities 370 410
Total current liabilities 8,752 9,528
Long-term debt 21,574 20,461
Long-term debt to affiliates 5,600 5,600
Tower obligations 2,634 2,658
Deferred tax liabilities 4,427 4,061
Deferred rent expense 2,548 2,481
Other long-term liabilities 1,038 1,067
Total long-term liabilities 37,821 36,328
Commitments and contingencies
Stockholders' equity
5.50% Mandatory Convertible Preferred Stock Series A, par value $0.00001 per share, 100,000,000 shares
authorized; 20,000,000 and 20,000,000 shares issued and outstanding; $1,000 and $1,000 aggregate liquidation
value — —
Common Stock, par value $0.00001 per share, 1,000,000,000 shares authorized; 824,116,744 and 819,773,724
shares issued, 822,704,856 and 818,391,219 shares outstanding — —
Additional paid-in capital 38,763 38,666
Treasury stock, at cost, 1,411,888 and 1,382,505 shares issued (1) —
Accumulated other comprehensive loss (1) (1)
Accumulated deficit (21,366) (22,108)
Total stockholders' equity 17,395 16,557
Total liabilities and stockholders' equity $ 63,968 $ 62,413
19
T-Mobile US, Inc.
Condensed Consolidated Statements of Comprehensive Income
(Unaudited)
Three Months Ended Six Months Ended June 30,
(in millions, except share and per share amounts)
June 30,
2016
March 31,
2016
June 30,
2015 2016 2015
Revenues
Branded postpaid revenues $ 4,509 $ 4,302 $ 4,075 $ 8,811 $ 7,849
Branded prepaid revenues 2,119 2,025 1,861 4,144 3,703
Wholesale revenues 207 200 164 407 322
Roaming and other service revenues 53 51 44 104 89
Total service revenues 6,888 6,578 6,144 13,466 11,963
Equipment revenues 2,188 1,851 1,915 4,039 3,766
Other revenues 146 170 120 316 228
Total revenues 9,222 8,599 8,179 17,821 15,957
Operating expenses
Cost of services, exclusive of depreciation and amortization shown
separately below 1,429 1,421 1,397 2,850 2,792
Cost of equipment sales 2,619 2,374 2,661 4,993 5,340
Selling, general and administrative 2,772 2,749 2,438 5,521 4,810
Depreciation and amortization 1,575 1,552 1,075 3,127 2,162
Cost of MetroPCS business combination 59 36 34 95 162
Gains on disposal of spectrum licenses — (636) (23) (636) (23)
Total operating expenses 8,454 7,496 7,582 15,950 15,243
Operating income 768 1,103 597 1,871 714
Other income (expense)
Interest expense (368) (339) (257) (707) (518)
Interest expense to affiliates (93) (79) (92) (172) (156)
Interest income 68 68 114 136 226
Other income (expense), net (3) (2) 1 (5) (7)
Total other expense, net (396) (352) (234) (748) (455)
Income before income taxes 372 751 363 1,123 259
Income tax (expense) benefit (147) (272) (2) (419) 39
Net income 225 479 361 704 298
Dividends on preferred stock (14) (14) (14) (28) (28)
Net income attributable to common stockholders $ 211 $ 465 $ 347 $ 676 $ 270
Net income $ 225 $ 479 $ 361 $ 704 $ 298
Other comprehensive gain (loss), net of tax
Unrealized gain (loss) on available-for-sale securities, net of tax effect of
$2, ($2), $0, $0 and $0 3 (3) — — —
Other comprehensive income (loss) 3 (3) — — —
Total comprehensive income $ 228 $ 476 $ 361 $ 704 $ 298
Earnings per share
Basic $ 0.26 $ 0.57 $ 0.43 $ 0.82 $ 0.33
Diluted $ 0.25 $ 0.56 $ 0.42 $ 0.81 $ 0.33
Weighted average shares outstanding
Basic 822,434,490 819,431,761 811,605,031 820,933,126 810,113,564
Diluted 829,752,956 859,382,827 821,122,537 829,662,053 819,548,539
20
T-Mobile US, Inc.
Condensed Consolidated Statements of Cash Flows
(Unaudited)
Three Months Ended Six Months Ended June 30,
(in millions)
June 30,
2016
March 31,
2016
June 30,
2015 2016 2015
Operating activities
Net income $ 225 $ 479 $ 361 $ 704 $ 298
Adjustments to reconcile net income to net cash provided by operating
activities
Depreciation and amortization 1,575 1,552 1,075 3,127 2,162
Stock-based compensation expense 60 52 56 112 111
Deferred income tax expense (benefit) 140 264 (2) 404 (52)
Bad debt expense 119 121 108 240 212
Losses from sales of receivables 46 52 48 98 113
Deferred rent expense 33 32 47 65 88
Gains on disposal of spectrum licenses — (636) (23) (636) (23)
Changes in operating assets and liabilities
Accounts receivable (105) (202) 62 (307) (108)
Equipment installment plan receivables 343 109 (350) 452 (579)
Inventories 3 (801) 87 (798) (58)
Deferred purchase price from sales of receivables (204) 21 (17) (183) (12)
Other current and long-term assets (56) 185 35 129 126
Accounts payable and accrued liabilities (345) (492) (153) (837) (546)
Other current and long-term liabilities (74) 288 (182) 214 (90)
Other, net 8 1 9 9 8
Net cash provided by operating activities 1,768 1,025 1,161 2,793 1,650
Investing activities
Purchases of property and equipment (1,349) (1,335) (1,191) (2,684) (2,173)
Purchases of spectrum licenses and other intangible assets, including
deposits (2,245) (594) (148) (2,839) (1,844)
Sales of short-term investments 2,923 75 — 2,998 —
Other, net 4 (6) 2 (2) (12)
Net cash used in investing activities (667) (1,860) (1,337) (2,527) (4,029)
Financing activities
Proceeds from issuance of long-term debt 997 — — 997 —
Repayments of capital lease obligations (43) (36) (6) (79) (11)
Repayments of short-term debt for purchases of inventory, property and
equipment, net (150) — (185) (150) (248)
Repayments of long-term debt (5) (5) — (10) —
Tax withholdings on share-based awards (3) (46) (70) (49) (98)
Dividends on preferred stock (14) (14) (14) (28) (28)
Other, net 8 1 61 9 91
Net cash provided by (used in) financing activities 790 (100) (214) 690 (294)
Change in cash and cash equivalents 1,891 (935) (390) 956 (2,673)
Cash and cash equivalents
Beginning of period 3,647 4,582 3,032 4,582 5,315
End of period $ 5,538 $ 3,647 $ 2,642 $ 5,538 $ 2,642
21
T-Mobile US, Inc. Supplementary Operating and Financial Data
Quarter
Six Months Ended
June 30,
(in thousands) Q1 2015 Q2 2015 Q3 2015 Q4 2015 Q1 2016 Q2 2016 2015 2016
Customers, end of period
Branded postpaid phone customers 26,835 27,595 28,438 29,355 30,232 30,878 27,595 30,878
Branded postpaid mobile broadband customers 1,475 1,723 1,965 2,340 2,504 2,748 1,723 2,748
Total branded postpaid customers 28,310 29,318 30,403 31,695 32,736 33,626 29,318 33,626
Branded prepaid customers 16,389 16,567 17,162 17,631 18,438 18,914 16,567 18,914
Total branded customers 44,699 45,885 47,565 49,326 51,174 52,540 45,885 52,540
Wholesale customers 12,137 13,023 13,655 13,956 14,329 14,844 13,023 14,844
Total customers, end of period 56,836 58,908 61,220 63,282 65,503 67,384 58,908 67,384
Quarter
Six Months Ended
June 30,
(in thousands) Q1 2015 Q2 2015 Q3 2015 Q4 2015 Q1 2016 Q2 2016 2015 2016
Net customer additions
Branded postpaid phone customers 991 760 843 917 877 646 1,751 1,523
Branded postpaid mobile broadband customers 134 248 242 375 164 244 382 408
Total branded postpaid customers 1,125 1,008 1,085 1,292 1,041 890 2,133 1,931
Branded prepaid customers 73 178 595 469 807 476 251 1,283
Total branded customers 1,198 1,186 1,680 1,761 1,848 1,366 2,384 3,214
Wholesale customers 620 886 632 301 373 515 1,506 888
Total net customer additions 1,818 2,072 2,312 2,062 2,221 1,881 3,890 4,102
Quarter
Six Months Ended
June 30,
Q1 2015 Q2 2015 Q3 2015 Q4 2015 Q1 2016 Q2 2016 2015 2016
Branded postpaid phone churn 1.30% 1.32% 1.46% 1.46% 1.33% 1.27% 1.31% 1.30%
Branded prepaid churn 4.62% 4.93% 4.09% 4.20% 3.84% 3.91% 4.78% 3.88%
22
T-Mobile US, Inc. Supplementary Operating and Financial Data (continued)
Quarter
Six Months Ended
June 30,
Q1 2015 Q2 2015 Q3 2015 Q4 2015 Q1 2016 Q2 2016 2015 2016
Financial Metrics
Service revenues (in millions) $5,819 $6,144 $6,302 $6,556 $6,578 $6,888 $11,963 $13,466
Total revenues (in millions) $7,778 $8,179 $7,849 $8,247 $8,599 $9,222 $15,957 $17,821
Adjusted EBITDA (in millions) $1,388 $1,817 $1,908 $2,280 $2,749 $2,464 $3,205 $5,213
Adjusted EBITDA margin 24% 30% 30% 35% 42% 36% 27% 39%
Net income (loss) (in millions) $(63) $361 $138 $297 $479 $225 $298 $704
Cash capex - Property & Equipment (in
millions)
$982 $1,191 $1,120 $1,431 $1,335 $1,349 $2,173 $2,684
Free Cash Flow (in millions) $(493) $(30) $411 $802 $(310) $419 $(523) $109
Adjusted Free Cash Flow (in millions) $(422) $73 $487 $897 $(247) $485 $(349) $238
Revenue Metrics
Branded postpaid phone ARPU $46.43 $48.19 $47.99 $48.05 $46.21 $47.11 $47.33 $46.67
Branded postpaid ABPU $60.94 $63.29 $62.96 $63.74 $61.90 $62.59 $62.14 $62.25
Branded prepaid ARPU $37.81 $37.83 $37.46 $37.63 $37.58 $37.86 $37.82 $37.72
Branded postpaid accounts, end of period (in
thousands)
11,831 12,061 12,250 12,456 12,639 12,753 12,061 12,753
Branded postpaid customers per account 2.39 2.43 2.48 2.54 2.59 2.64 2.43 2.64
Device Sales and Leased Devices
Smartphone units (in millions) 8.0 7.4 8.1 10.0 8.8 8.1 15.4 16.9
Branded postpaid handset upgrade rate 8% 9% 9% 10% 7% 6% 17% 13%
Device Financing
EIP financed (in millions) $1,483 $1,697 $1,107 $926 $1,246 $1,562 $3,180 $2,808
EIP billings (in millions) $1,292 $1,393 $1,409 $1,400 $1,324 $1,344 $2,685 $2,668
EIP receivables, net (in millions) $4,842 $5,114 $4,771 $3,225 $3,053 $2,662 $5,114 $2,662
Lease revenues (in millions) $— $— $30 $194 $342 $367 $— $709
Leased devices transferred from inventory to
property and equipment, net of returns (in
millions)
$— $— $822 $1,463 $653 $52 $— $705
Customer Quality
EIP receivables classified as prime 52% 52% 52% 48% 47% 42% 52% 42%
Total bad debt expense and losses from sales of
receivables (in millions)
$169 $156 $198 $228 $173 $165 $325 $338
23
T-Mobile US, Inc.
Reconciliation of Non-GAAP Financial Measures to GAAP Financial Measures
(Unaudited)
This Investor Factbook includes non-GAAP financial measures. The non-GAAP financial measures should be
considered in addition to, but not as a substitute for, the information provided in accordance with GAAP.
Reconciliations for the non-GAAP financial measures to the most directly comparable GAAP financial measures are
provided below. As T-Mobile does not or cannot predict or forecast certain of the expenses which are excluded
from Adjusted EBITDA, but which would be required for the presentation of projected net income, T-Mobile does not
provide projected net income or reconciliations to GAAP in the forward-looking financial measures.
Adjusted EBITDA is reconciled to net income (loss) as follows:
Quarter
Six Months Ended
June 30,
(in millions) Q1 2015 Q2 2015 Q3 2015 Q4 2015 Q1 2016 Q2 2016 2015 2016
Net income (loss) $ (63) $ 361 $ 138 $ 297 $ 479 $ 225 $ 298 $ 704
Adjustments:
Interest expense 261 257 262 305 339 368 518 707
Interest expense to affiliates 64 92 121 134 79 93 156 172
Interest income (112) (114) (109) (85) (68) (68) (226) (136)
Other expense (income), net 8 (1) 1 3 2 3 7 5
Income tax expense (benefit) (41) 2 100 184 272 147 (39) 419
Operating income 117 597 513 838 1,103 768 714 1,871
Depreciation and amortization 1,087 1,075 1,157 1,369 1,552 1,575 2,162 3,127
Cost of MetroPCS business combination 128 34 193 21 36 59 162 95
Stock-based compensation (1)
56 71 43 52 53 61 127 114
Other, net — 40 2 — 5 1 40 6
Adjusted EBITDA $ 1,388 $ 1,817 $ 1,908 $ 2,280 $ 2,749 $ 2,464 $ 3,205 $ 5,213
(1) Stock-based compensation includes payroll tax impacts and may not agree to stock-based compensation expense in the condensed
consolidated financial statements.
24
T-Mobile US, Inc.
Reconciliation of Non-GAAP Financial Measures to GAAP Financial Measures (continued)
(Unaudited)
The following tables illustrate the calculation of ARPU and ABPU and reconcile these measures to the related
service revenues, which we consider to be the most directly comparable GAAP financial measure to ARPU and
ABPU:
Quarter
Six Months Ended
June 30,
(in millions, except average number of
customers, ARPU and ABPU) Q1 2015 Q2 2015 Q3 2015 Q4 2015 Q1 2016 Q2 2016 2015 2016
Calculation of Branded Postpaid Phone
ARPU
Branded postpaid service revenues $ 3,774 $ 4,075 $ 4,197 $ 4,337 $ 4,302 $ 4,509 $ 7,849 $ 8,811
Less: Branded postpaid mobile broadband
revenues (109) (135) (165) (179) (182) (193) (244) (375)
Branded postpaid phone service revenues $ 3,665 $ 3,940 $ 4,032 $ 4,158 $ 4,120 $ 4,316 $ 7,605 $ 8,436
Divided by: Average number of branded
postpaid phone customers (in thousands) and
number of months in period 26,313 27,250 28,003 28,849 29,720 30,537 26,781 30,128
Branded postpaid phone ARPU $ 46.43 $ 48.19 $ 47.99 $ 48.05 $ 46.21 $ 47.11 $ 47.33 $ 46.67
Calculation of Branded Postpaid ABPU
Branded postpaid service revenues $ 3,774 $ 4,075 $ 4,197 $ 4,337 $ 4,302 $ 4,509 $ 7,849 $ 8,811
EIP billings 1,292 1,393 1,409 1,400 1,324 1,344 2,685 2,668
Lease revenues — — 30 194 342 367 — 709
Total billings for branded postpaid
customers $ 5,066 $ 5,468 $ 5,636 $ 5,931 $ 5,968 $ 6,220 $ 10,534 $ 12,188
Divided by: Average number of branded
postpaid customers (in thousands) and number
of months in period 27,717 28,797 29,838 31,013 32,140 33,125 28,257 32,633
Branded postpaid ABPU $ 60.94 $ 63.29 $ 62.96 $ 63.74 $ 61.90 $ 62.59 $ 62.14 $ 62.25
Calculation of Branded Prepaid ARPU
Branded prepaid service revenues $ 1,842 $ 1,861 $ 1,894 $ 1,956 $ 2,025 $ 2,119 $ 3,703 $ 4,144
Divided by: Average number of branded
prepaid customers (in thousands) and number of
months in period 16,238 16,396 16,853 17,330 17,962 18,662 16,317 18,312
Branded prepaid ARPU $ 37.81 $ 37.83 $ 37.46 $ 37.63 $ 37.58 $ 37.86 $ 37.82 $ 37.72
25
T-Mobile US, Inc.
Reconciliation of Non-GAAP Financial Measures to GAAP Financial Measures (continued)
(Unaudited)
Net debt (excluding Tower Obligations) to last twelve months adjusted EBITDA ratio is calculated as follows:
(in millions, except net debt ratio)
Mar 31,
2015
Jun 30,
2015
Sep 30,
2015
Dec 31,
2015
Mar 31,
2016
Jun 30,
2016
Short-term debt $ 467 $ 386 $ 114 $ 182 $ 365 $ 258
Long-term debt to affiliates 5,600 5,600 5,600 5,600 5,600 5,600
Long-term debt (1)
16,248 16,373 16,430 20,461 20,505 21,574
Less: Cash and cash equivalents (3,032) (2,642) (2,633) (4,582) (3,647) (5,538)
Less: Short-term investments — — — (2,998) (2,925) —
Net Debt (excluding Tower Obligations) $ 19,283 $ 19,717 $ 19,511 $ 18,663 $ 19,898 $ 21,894
Divided by: Last twelve months Adjusted EBITDA $ 5,936 $ 6,302 $ 6,864 $ 7,393 $ 8,754 $ 9,401
Net Debt (excluding Tower Obligations) to Last
Twelve Months Adjusted EBITDA Ratio
3.2 3.1 2.8 2.5 2.3 2.3
(1) Long-term debt as of March 31, 2015 through December 31, 2015 has been restated for the adoption of Accounting Standards Update
2015-03, “Simplifying the Presentation of Debt Issuance Costs” in the first quarter of 2016. The impact to the Net Debt (excluding Tower
Obligations) to Last Twelve Months Adjusted EBITDA Ratio was not significant.
Free cash flow and adjusted free cash flow are calculated as follows:
Quarter
Six Months Ended
June 30,
(in millions) Q1 2015 Q2 2015 Q3 2015 Q4 2015 Q1 2016 Q2 2016 2015 2016
Net cash provided by operating activities $ 489 $ 1,161 $ 1,531 $ 2,233 $ 1,025 $ 1,768 $ 1,650 $ 2,793
Cash purchases of property and equipment (982) (1,191) (1,120) (1,431) (1,335) (1,349) (2,173) (2,684)
Free Cash Flow (493) (30) 411 802 (310) 419 (523) 109
MetroPCS CDMA network decommissioning
payments 71 103 76 95 63 66 174 129
Adjusted Free Cash Flow $ (422) $ 73 $ 487 $ 897 $ (247) $ 485 $ (349) $ 238
26
Definitions of Terms
Operating and financial measures are utilized by T-Mobile's management to evaluate its operating performance and, in certain cases, its ability to
meet liquidity requirements. Although companies in the wireless industry may not define measures in precisely the same way, T-Mobile believes
the measures facilitate key operating performance comparisons with other companies in the wireless industry to provide management, investors
and analysts with useful information to assess and evaluate past performance and assist in forecasting future performance.
1. Customer - SIM card with a unique T-Mobile mobile identity number which generates revenue. Branded customers generally include
customers that are qualified either for postpaid service, where they generally pay after incurring service, or prepaid service, where they
generally pay in advance. Wholesale customers include Machine-to-Machine (M2M) and Mobile Virtual Network Operator (MVNO) customers
that operate on T-Mobile's network, but are managed by wholesale partners.
2. Churn - Number of customers whose service was disconnected as a percentage of the average number of customers during the specified
period. The number of customers whose service was disconnected is presented net of customers that subsequently have their service
restored within a certain period of time.
3. Customers per account - The number of branded postpaid customers as of the end of the period divided by the number of branded postpaid
accounts as of the end of the period. An account may include branded postpaid phone and mobile broadband customers.
4. Average Revenue Per User (ARPU) - Average monthly service revenue earned from customers. Service revenues for the specified period
divided by the average customers during the period, further divided by the number of months in the period.
Branded postpaid phone ARPU excludes mobile broadband customers and related revenues.
Average Billings per User (ABPU) - Average monthly branded postpaid service revenue earned from customers plus monthly EIP billings and
lease revenues divided by the average branded postpaid customers during the period, further divided by the number of months in the period.
T-Mobile believes branded postpaid ABPU is indicative of estimated cash collections, including device financing payments, from T-Mobile's
customers each month.
Service revenues - Branded postpaid, including handset insurance, branded prepaid, wholesale, and roaming and other service revenues.
5. Cost of services - Costs directly attributable to providing wireless service through the operation of T-Mobile's network, including direct switch
and cell site costs, such as rent, network access and transport costs, utilities, maintenance, associated labor costs, long distance costs,
regulatory program costs, roaming fees paid to other carriers and data content costs.
Cost of equipment sales - Costs of devices and accessories sold to customers and dealers, device costs to fulfill insurance and warranty
claims, write-downs of inventory related to shrinkage and obsolescence, and shipping and handling costs.
Selling, general and administrative expenses - Costs not directly attributable to providing wireless service for the operation of sales, customer
care and corporate activities. These include commissions paid to dealers and retail employees for activations and upgrades, labor and
facilities costs associated with retail sales force and administrative space, marketing and promotional costs, customer support and billing, bad
debt expense and administrative support activities.
6. Adjusted EBITDA - Earnings before interest expense (net of interest income), tax, depreciation, amortization, stock-based compensation and
expenses not reflective of T-Mobile's ongoing operating performance. Adjusted EBITDA margin represents Adjusted EBITDA divided by
service revenues. Adjusted EBITDA is a non-GAAP financial measure utilized by T-Mobile's management to monitor the financial
performance of its operations. T-Mobile uses Adjusted EBITDA internally as a metric to evaluate and compensate its personnel and
management for their performance, and as a benchmark to evaluate T-Mobile's operating performance in comparison to its competitors.
Management believes analysts and investors use Adjusted EBITDA as a supplemental measure to evaluate overall operating performance
and facilitate comparisons with other wireless communications companies because it is more indicative of T-Mobile's ongoing performance
and trends by excluding certain expenses which are either nonrecurring or may not be indicative of T-Mobile's directly controllable operating
results. Adjusted EBITDA has limitations as an analytical tool and should not be considered in isolation or as a substitute for income from
operations, net income or any other measure of financial performance reported in accordance with GAAP. The reconciliation of Adjusted
EBITDA to net income (loss) is detailed in the Reconciliation of Non-GAAP Financial Measures to GAAP Financial Measures schedule.
7. Cash capital expenditures - Amounts paid for construction and the purchase of property and equipment.
8. Smartphones - UMTS/HSPA/HSPA+ 21/HSPA+ 42/4G LTE enabled converged devices, which integrate voice and data services.
27
Definitions of Terms (continued)
9. Free Cash Flow - Net cash provided by operating activities less cash capital expenditures for property and equipment. Free Cash Flow is
utilized by T-Mobile's management, investors, and analysts to evaluate cash available to pay debt and provide further investment in the
business. The reconciliation of Free Cash Flow to net cash provided by operating activities is detailed in the Reconciliation of Non-GAAP
Financial Measures to GAAP Financial Measures schedule.
10. Adjusted Free Cash Flow - Free Cash Flow excluding decommissioning payments related to the shutdown of the CDMA portion of the
MetroPCS network.
11. Net debt - Short-term debt, long-term debt to affiliates, and long-term debt (excluding tower obligations), less cash and cash equivalents and
short-term investments.
28
Forward-Looking Statements
This Investor Factbook includes "forward-looking statements" within the meaning of the U.S. federal securities laws. Any statements made herein
that are not statements of historical fact, including statements about T-Mobile US, Inc.'s plans, outlook, beliefs, opinion, projections, guidance,
strategy, expected network modernization and other advancements, are forward-looking statements. Generally, forward-looking statements may
be identified by words such as "anticipate," "expect," "suggests," "plan," “project,” "believe," "intend," "estimates," "targets," "views," "may," "will,"
"forecast," and other similar expressions. The forward-looking statements speak only as of the date made, are based on current assumptions
and expectations, and involve a number of risks and uncertainties. Important factors that could affect future results and cause those results to
differ materially from those expressed in the forward-looking statements include, among others, the following: our ability to compete in the highly
competitive U.S. wireless telecommunications industry; adverse conditions in the U.S. and international economies and markets; significant
capital commitments and the capital expenditures required to effect our business plan; our ability to adapt to future changes in technology,
enhance existing offerings, and introduce new offerings to address customers' changing demands; changes in legal and regulatory requirements,
including any change or increase in restrictions on our ability to operate our network; our ability to successfully maintain and improve our
network, and the possibility of incurring additional costs in doing so; major equipment failures; severe weather conditions or other force majeure
events; and other risks described in our filings with the Securities and Exchange Commission, including those described in our most recently filed
Annual Report on Form 10-K. You should not place undue reliance on these forward-looking statements. We do not undertake to update
forward-looking statements, whether as a result of new information, future events or otherwise, except as required by law.
About T-Mobile US, Inc.
As America's Un-carrier, T-Mobile US, Inc. (NASDAQ: TMUS) is redefining the way consumers and businesses buy wireless services through
leading product and service innovation. The Company's advanced nationwide 4G LTE network delivers outstanding wireless experiences to 67.4
million customers who are unwilling to compromise on quality and value. Based in Bellevue, Washington, T-Mobile US provides services through
its subsidiaries and operates its flagship brands, T-Mobile and MetroPCS. For more information, please visit http://www.T-Mobile.com or join the
conversation on Twitter using $TMUS.

More Related Content

What's hot

TMUS Q3 2017 investor Factbook
TMUS Q3 2017 investor Factbook TMUS Q3 2017 investor Factbook
TMUS Q3 2017 investor Factbook
Cristal Dunkin
 
TMUS Q1 2018 Investor Factbook
TMUS Q1 2018 Investor Factbook TMUS Q1 2018 Investor Factbook
TMUS Q1 2018 Investor Factbook
Cristal Dunkin
 
TMUS Q2 2017 investor Factbook
TMUS Q2 2017 investor FactbookTMUS Q2 2017 investor Factbook
TMUS Q2 2017 investor Factbook
Cristal Dunkin
 
TDS Q4 2015 Earnings Presentation
TDS Q4 2015 Earnings PresentationTDS Q4 2015 Earnings Presentation
TDS Q4 2015 Earnings Presentation
USCellular
 
TDS Third Quarter 2016 Results
TDS Third Quarter 2016 ResultsTDS Third Quarter 2016 Results
TDS Third Quarter 2016 Results
TelephoneDataSystems
 
3 q 2017 operating results final
3 q 2017 operating results final3 q 2017 operating results final
3 q 2017 operating results final
TelephoneDataSystems
 
Q3 2015 earnings presentation final
Q3 2015 earnings presentation finalQ3 2015 earnings presentation final
Q3 2015 earnings presentation final
USCellular
 
qwest communications 2-14-06
qwest communications 2-14-06qwest communications 2-14-06
qwest communications 2-14-06finance19
 
Q2 2016 Earnings Presentation - Bruker Corporation
Q2 2016 Earnings Presentation - Bruker CorporationQ2 2016 Earnings Presentation - Bruker Corporation
Q2 2016 Earnings Presentation - Bruker Corporation
InvestorBruker
 
qwest communications q_2Q 05er
qwest communications q_2Q 05erqwest communications q_2Q 05er
qwest communications q_2Q 05erfinance19
 
qwest communications Q2 04_earnings
qwest communications Q2 04_earningsqwest communications Q2 04_earnings
qwest communications Q2 04_earningsfinance19
 
qwest communications 4_30_02Final Earnings
qwest communications 4_30_02Final Earningsqwest communications 4_30_02Final Earnings
qwest communications 4_30_02Final Earningsfinance19
 
qwest communications q_3Q 05er
qwest communications q_3Q 05erqwest communications q_3Q 05er
qwest communications q_3Q 05erfinance19
 
qwest communications Q3 04
qwest communications Q3 04qwest communications Q3 04
qwest communications Q3 04finance19
 
qwest communications 1Q 06 Earnings
qwest communications 1Q 06 Earningsqwest communications 1Q 06 Earnings
qwest communications 1Q 06 Earningsfinance19
 
Telecom Italia 3Q 2010 Results - Domestic Market
Telecom Italia 3Q 2010 Results - Domestic MarketTelecom Italia 3Q 2010 Results - Domestic Market
Telecom Italia 3Q 2010 Results - Domestic Market
Gruppo TIM
 
TMUS Q1 2014 Earnings Slide Presentation
TMUS Q1 2014 Earnings Slide PresentationTMUS Q1 2014 Earnings Slide Presentation
TMUS Q1 2014 Earnings Slide PresentationTMUS_IR
 
Meeting with Investors - May 2015
Meeting with Investors - May 2015Meeting with Investors - May 2015
Meeting with Investors - May 2015TIM RI
 
TMUS Q4 2017 Investor Factbook
TMUS Q4 2017 Investor Factbook TMUS Q4 2017 Investor Factbook
TMUS Q4 2017 Investor Factbook
Cristal Dunkin
 
Q1 2004 Earnings Release
 	Q1 2004 Earnings Release 	Q1 2004 Earnings Release
Q1 2004 Earnings Releasefinance7
 

What's hot (20)

TMUS Q3 2017 investor Factbook
TMUS Q3 2017 investor Factbook TMUS Q3 2017 investor Factbook
TMUS Q3 2017 investor Factbook
 
TMUS Q1 2018 Investor Factbook
TMUS Q1 2018 Investor Factbook TMUS Q1 2018 Investor Factbook
TMUS Q1 2018 Investor Factbook
 
TMUS Q2 2017 investor Factbook
TMUS Q2 2017 investor FactbookTMUS Q2 2017 investor Factbook
TMUS Q2 2017 investor Factbook
 
TDS Q4 2015 Earnings Presentation
TDS Q4 2015 Earnings PresentationTDS Q4 2015 Earnings Presentation
TDS Q4 2015 Earnings Presentation
 
TDS Third Quarter 2016 Results
TDS Third Quarter 2016 ResultsTDS Third Quarter 2016 Results
TDS Third Quarter 2016 Results
 
3 q 2017 operating results final
3 q 2017 operating results final3 q 2017 operating results final
3 q 2017 operating results final
 
Q3 2015 earnings presentation final
Q3 2015 earnings presentation finalQ3 2015 earnings presentation final
Q3 2015 earnings presentation final
 
qwest communications 2-14-06
qwest communications 2-14-06qwest communications 2-14-06
qwest communications 2-14-06
 
Q2 2016 Earnings Presentation - Bruker Corporation
Q2 2016 Earnings Presentation - Bruker CorporationQ2 2016 Earnings Presentation - Bruker Corporation
Q2 2016 Earnings Presentation - Bruker Corporation
 
qwest communications q_2Q 05er
qwest communications q_2Q 05erqwest communications q_2Q 05er
qwest communications q_2Q 05er
 
qwest communications Q2 04_earnings
qwest communications Q2 04_earningsqwest communications Q2 04_earnings
qwest communications Q2 04_earnings
 
qwest communications 4_30_02Final Earnings
qwest communications 4_30_02Final Earningsqwest communications 4_30_02Final Earnings
qwest communications 4_30_02Final Earnings
 
qwest communications q_3Q 05er
qwest communications q_3Q 05erqwest communications q_3Q 05er
qwest communications q_3Q 05er
 
qwest communications Q3 04
qwest communications Q3 04qwest communications Q3 04
qwest communications Q3 04
 
qwest communications 1Q 06 Earnings
qwest communications 1Q 06 Earningsqwest communications 1Q 06 Earnings
qwest communications 1Q 06 Earnings
 
Telecom Italia 3Q 2010 Results - Domestic Market
Telecom Italia 3Q 2010 Results - Domestic MarketTelecom Italia 3Q 2010 Results - Domestic Market
Telecom Italia 3Q 2010 Results - Domestic Market
 
TMUS Q1 2014 Earnings Slide Presentation
TMUS Q1 2014 Earnings Slide PresentationTMUS Q1 2014 Earnings Slide Presentation
TMUS Q1 2014 Earnings Slide Presentation
 
Meeting with Investors - May 2015
Meeting with Investors - May 2015Meeting with Investors - May 2015
Meeting with Investors - May 2015
 
TMUS Q4 2017 Investor Factbook
TMUS Q4 2017 Investor Factbook TMUS Q4 2017 Investor Factbook
TMUS Q4 2017 Investor Factbook
 
Q1 2004 Earnings Release
 	Q1 2004 Earnings Release 	Q1 2004 Earnings Release
Q1 2004 Earnings Release
 

Viewers also liked

Q4 2015 presentation
Q4 2015 presentationQ4 2015 presentation
Q4 2015 presentation
Tele2
 
El reto de los 30 días
El reto de los 30 díasEl reto de los 30 días
El reto de los 30 días
Ana López Iglesias
 
Why Business is Better in the Cloud
Why Business is Better in the CloudWhy Business is Better in the Cloud
Why Business is Better in the Cloud
Perficient, Inc.
 
Manage Your Existing Mobile Apps with AEM Mobile
Manage Your Existing Mobile Apps with AEM MobileManage Your Existing Mobile Apps with AEM Mobile
Manage Your Existing Mobile Apps with AEM Mobile
arumsey
 
Frame based analysis of synesthetic metaphors in Polish
Frame based analysis of synesthetic metaphors in PolishFrame based analysis of synesthetic metaphors in Polish
Frame based analysis of synesthetic metaphors in Polish
Magdalena Zawisławska
 
Jak mówić o smaku?
Jak mówić o smaku?Jak mówić o smaku?
Jak mówić o smaku?
Magdalena Zawisławska
 
Authoring Experience
Authoring ExperienceAuthoring Experience
Authoring Experience
Max Barrass
 
Tele2 Q3 2016 presentation
Tele2 Q3 2016 presentationTele2 Q3 2016 presentation
Tele2 Q3 2016 presentation
Tele2
 
Pharma market 2016 brochure
Pharma market 2016 brochurePharma market 2016 brochure
Pharma market 2016 brochure
John Smith
 
El clima emocional
El clima emocionalEl clima emocional
El clima emocional
Ana López Iglesias
 
Back2 basics - A Day In The Life Of An Oracle Analytics Query
Back2 basics - A Day In The Life Of An Oracle Analytics QueryBack2 basics - A Day In The Life Of An Oracle Analytics Query
Back2 basics - A Day In The Life Of An Oracle Analytics Query
Christian Berg
 
Kti yusran katarina
Kti yusran katarinaKti yusran katarina
Kti yusran katarina
YUSRAN KATARINA
 
IDENTIFIKASI KEJADIAN RISIKO TINGGI PADA IBU HAMIL DI PUSKESMAS KATOBU KABUPA...
IDENTIFIKASI KEJADIAN RISIKO TINGGI PADA IBU HAMIL DI PUSKESMAS KATOBU KABUPA...IDENTIFIKASI KEJADIAN RISIKO TINGGI PADA IBU HAMIL DI PUSKESMAS KATOBU KABUPA...
IDENTIFIKASI KEJADIAN RISIKO TINGGI PADA IBU HAMIL DI PUSKESMAS KATOBU KABUPA...
Warnet Raha
 
8 pasos para quererme más
8 pasos para quererme más8 pasos para quererme más
8 pasos para quererme más
Ana López Iglesias
 

Viewers also liked (17)

San valentin
San valentinSan valentin
San valentin
 
Q4 2015 presentation
Q4 2015 presentationQ4 2015 presentation
Q4 2015 presentation
 
El reto de los 30 días
El reto de los 30 díasEl reto de los 30 días
El reto de los 30 días
 
Nashed-Samuel_Yasser
Nashed-Samuel_YasserNashed-Samuel_Yasser
Nashed-Samuel_Yasser
 
Transforming Development Practice
Transforming Development PracticeTransforming Development Practice
Transforming Development Practice
 
Why Business is Better in the Cloud
Why Business is Better in the CloudWhy Business is Better in the Cloud
Why Business is Better in the Cloud
 
Manage Your Existing Mobile Apps with AEM Mobile
Manage Your Existing Mobile Apps with AEM MobileManage Your Existing Mobile Apps with AEM Mobile
Manage Your Existing Mobile Apps with AEM Mobile
 
Frame based analysis of synesthetic metaphors in Polish
Frame based analysis of synesthetic metaphors in PolishFrame based analysis of synesthetic metaphors in Polish
Frame based analysis of synesthetic metaphors in Polish
 
Jak mówić o smaku?
Jak mówić o smaku?Jak mówić o smaku?
Jak mówić o smaku?
 
Authoring Experience
Authoring ExperienceAuthoring Experience
Authoring Experience
 
Tele2 Q3 2016 presentation
Tele2 Q3 2016 presentationTele2 Q3 2016 presentation
Tele2 Q3 2016 presentation
 
Pharma market 2016 brochure
Pharma market 2016 brochurePharma market 2016 brochure
Pharma market 2016 brochure
 
El clima emocional
El clima emocionalEl clima emocional
El clima emocional
 
Back2 basics - A Day In The Life Of An Oracle Analytics Query
Back2 basics - A Day In The Life Of An Oracle Analytics QueryBack2 basics - A Day In The Life Of An Oracle Analytics Query
Back2 basics - A Day In The Life Of An Oracle Analytics Query
 
Kti yusran katarina
Kti yusran katarinaKti yusran katarina
Kti yusran katarina
 
IDENTIFIKASI KEJADIAN RISIKO TINGGI PADA IBU HAMIL DI PUSKESMAS KATOBU KABUPA...
IDENTIFIKASI KEJADIAN RISIKO TINGGI PADA IBU HAMIL DI PUSKESMAS KATOBU KABUPA...IDENTIFIKASI KEJADIAN RISIKO TINGGI PADA IBU HAMIL DI PUSKESMAS KATOBU KABUPA...
IDENTIFIKASI KEJADIAN RISIKO TINGGI PADA IBU HAMIL DI PUSKESMAS KATOBU KABUPA...
 
8 pasos para quererme más
8 pasos para quererme más8 pasos para quererme más
8 pasos para quererme más
 

Similar to 2Q16 Investor Factbook

TMUS Q2 2015 Investor Factbook
TMUS Q2 2015 Investor FactbookTMUS Q2 2015 Investor Factbook
TMUS Q2 2015 Investor Factbook
TMUS_IR
 
TMUS Q3 20215 Earnings - Investor Factbook
TMUS Q3 20215 Earnings - Investor FactbookTMUS Q3 20215 Earnings - Investor Factbook
TMUS Q3 20215 Earnings - Investor Factbook
TMUS_IR
 
Q3 2014 Investor Factbook
Q3 2014 Investor FactbookQ3 2014 Investor Factbook
Q3 2014 Investor FactbookTMUS_IR
 
TMUS Q2 2018 Investor Factbook
TMUS Q2 2018 Investor Factbook TMUS Q2 2018 Investor Factbook
TMUS Q2 2018 Investor Factbook
Cristal Dunkin
 
TMUS 4Q15 Investor Factbook Final
TMUS 4Q15 Investor Factbook FinalTMUS 4Q15 Investor Factbook Final
TMUS 4Q15 Investor Factbook Final
TMUS_IR
 
TMUS Q1 2015 Investor Factbok
TMUS Q1 2015 Investor FactbokTMUS Q1 2015 Investor Factbok
TMUS Q1 2015 Investor Factbok
TMUS_IR
 
TMUS Q4 2017 Investor Factbook
TMUS Q4 2017 Investor Factbook TMUS Q4 2017 Investor Factbook
TMUS Q4 2017 Investor Factbook
Cristal Dunkin
 
TMUS Q4 2014 Investor Factbook
TMUS Q4 2014 Investor FactbookTMUS Q4 2014 Investor Factbook
TMUS Q4 2014 Investor Factbook
TMUS_IR
 
Telecom sector-in-india
Telecom sector-in-indiaTelecom sector-in-india
Telecom sector-in-india
Karron Singh
 
T-Mobile US Q2 2014 Earnings Presentation
T-Mobile US Q2 2014 Earnings PresentationT-Mobile US Q2 2014 Earnings Presentation
T-Mobile US Q2 2014 Earnings Presentation
TMUS_IR
 
Comparison of Global & Indian Telecom
Comparison of Global & Indian TelecomComparison of Global & Indian Telecom
Comparison of Global & Indian Telecom
Islamic University of Science & Technology
 
qwest communications 1Q 04Earnings
qwest communications 1Q 04Earningsqwest communications 1Q 04Earnings
qwest communications 1Q 04Earningsfinance19
 
Digital transformation for 2020 and beyond
Digital transformation for 2020 and beyondDigital transformation for 2020 and beyond
Digital transformation for 2020 and beyond
Sarhan, Ahmed
 
Telecom Global Market Report 2018
Telecom Global Market Report 2018Telecom Global Market Report 2018
Telecom Global Market Report 2018
SainathMuntha1
 
T-Mobile US Inc. Full Report
T-Mobile US Inc. Full ReportT-Mobile US Inc. Full Report
T-Mobile US Inc. Full ReportMozika Maloba
 
Analysys Mason - Digital Economy and Strategies for Telecoms
Analysys Mason - Digital Economy and Strategies for TelecomsAnalysys Mason - Digital Economy and Strategies for Telecoms
Analysys Mason - Digital Economy and Strategies for TelecomsAlex Llorens
 
Beacon May 2016
Beacon May 2016Beacon May 2016
sprint nextel Quarterly Results 2008 3rd
sprint nextel Quarterly Results 2008 3rdsprint nextel Quarterly Results 2008 3rd
sprint nextel Quarterly Results 2008 3rdfinance6
 
Premium Rate Services' Annual Market Review 2014, Market Outlook 2015
Premium Rate Services' Annual Market Review 2014, Market Outlook 2015Premium Rate Services' Annual Market Review 2014, Market Outlook 2015
Premium Rate Services' Annual Market Review 2014, Market Outlook 2015
mobilesquared Ltd
 

Similar to 2Q16 Investor Factbook (20)

TMUS Q2 2015 Investor Factbook
TMUS Q2 2015 Investor FactbookTMUS Q2 2015 Investor Factbook
TMUS Q2 2015 Investor Factbook
 
TMUS Q3 20215 Earnings - Investor Factbook
TMUS Q3 20215 Earnings - Investor FactbookTMUS Q3 20215 Earnings - Investor Factbook
TMUS Q3 20215 Earnings - Investor Factbook
 
Q3 2014 Investor Factbook
Q3 2014 Investor FactbookQ3 2014 Investor Factbook
Q3 2014 Investor Factbook
 
TMUS Q2 2018 Investor Factbook
TMUS Q2 2018 Investor Factbook TMUS Q2 2018 Investor Factbook
TMUS Q2 2018 Investor Factbook
 
TMUS 4Q15 Investor Factbook Final
TMUS 4Q15 Investor Factbook FinalTMUS 4Q15 Investor Factbook Final
TMUS 4Q15 Investor Factbook Final
 
TMUS Q1 2015 Investor Factbok
TMUS Q1 2015 Investor FactbokTMUS Q1 2015 Investor Factbok
TMUS Q1 2015 Investor Factbok
 
TMUS Q4 2017 Investor Factbook
TMUS Q4 2017 Investor Factbook TMUS Q4 2017 Investor Factbook
TMUS Q4 2017 Investor Factbook
 
TMUS Q4 2014 Investor Factbook
TMUS Q4 2014 Investor FactbookTMUS Q4 2014 Investor Factbook
TMUS Q4 2014 Investor Factbook
 
At&tib final 2q13
At&tib final 2q13At&tib final 2q13
At&tib final 2q13
 
Telecom sector-in-india
Telecom sector-in-indiaTelecom sector-in-india
Telecom sector-in-india
 
T-Mobile US Q2 2014 Earnings Presentation
T-Mobile US Q2 2014 Earnings PresentationT-Mobile US Q2 2014 Earnings Presentation
T-Mobile US Q2 2014 Earnings Presentation
 
Comparison of Global & Indian Telecom
Comparison of Global & Indian TelecomComparison of Global & Indian Telecom
Comparison of Global & Indian Telecom
 
qwest communications 1Q 04Earnings
qwest communications 1Q 04Earningsqwest communications 1Q 04Earnings
qwest communications 1Q 04Earnings
 
Digital transformation for 2020 and beyond
Digital transformation for 2020 and beyondDigital transformation for 2020 and beyond
Digital transformation for 2020 and beyond
 
Telecom Global Market Report 2018
Telecom Global Market Report 2018Telecom Global Market Report 2018
Telecom Global Market Report 2018
 
T-Mobile US Inc. Full Report
T-Mobile US Inc. Full ReportT-Mobile US Inc. Full Report
T-Mobile US Inc. Full Report
 
Analysys Mason - Digital Economy and Strategies for Telecoms
Analysys Mason - Digital Economy and Strategies for TelecomsAnalysys Mason - Digital Economy and Strategies for Telecoms
Analysys Mason - Digital Economy and Strategies for Telecoms
 
Beacon May 2016
Beacon May 2016Beacon May 2016
Beacon May 2016
 
sprint nextel Quarterly Results 2008 3rd
sprint nextel Quarterly Results 2008 3rdsprint nextel Quarterly Results 2008 3rd
sprint nextel Quarterly Results 2008 3rd
 
Premium Rate Services' Annual Market Review 2014, Market Outlook 2015
Premium Rate Services' Annual Market Review 2014, Market Outlook 2015Premium Rate Services' Annual Market Review 2014, Market Outlook 2015
Premium Rate Services' Annual Market Review 2014, Market Outlook 2015
 

Recently uploaded

Snam 2023-27 Industrial Plan - Financial Presentation
Snam 2023-27 Industrial Plan - Financial PresentationSnam 2023-27 Industrial Plan - Financial Presentation
Snam 2023-27 Industrial Plan - Financial Presentation
Valentina Ottini
 
Collective Mining | Corporate Presentation - May 2024
Collective Mining | Corporate Presentation - May 2024Collective Mining | Corporate Presentation - May 2024
Collective Mining | Corporate Presentation - May 2024
CollectiveMining1
 
Collective Mining | Corporate Presentation - May 2024
Collective Mining | Corporate Presentation - May 2024Collective Mining | Corporate Presentation - May 2024
Collective Mining | Corporate Presentation - May 2024
CollectiveMining1
 
cyberagent_For New Investors_EN_240424.pdf
cyberagent_For New Investors_EN_240424.pdfcyberagent_For New Investors_EN_240424.pdf
cyberagent_For New Investors_EN_240424.pdf
CyberAgent, Inc.
 
Osisko Development - Investor Presentation - June 24
Osisko Development - Investor Presentation - June 24Osisko Development - Investor Presentation - June 24
Osisko Development - Investor Presentation - June 24
Philip Rabenok
 
Corporate Presentation Probe June 2024.pdf
Corporate Presentation Probe June 2024.pdfCorporate Presentation Probe June 2024.pdf
Corporate Presentation Probe June 2024.pdf
Probe Gold
 
Investor Day 2024 Presentation Sysco 2024
Investor Day 2024 Presentation Sysco 2024Investor Day 2024 Presentation Sysco 2024
Investor Day 2024 Presentation Sysco 2024
Sysco_Investors
 
New Tax Regime User Guide Flexi Plan Revised (1).pptx
New Tax Regime User Guide Flexi Plan Revised (1).pptxNew Tax Regime User Guide Flexi Plan Revised (1).pptx
New Tax Regime User Guide Flexi Plan Revised (1).pptx
RajkumarRajamanikam
 

Recently uploaded (8)

Snam 2023-27 Industrial Plan - Financial Presentation
Snam 2023-27 Industrial Plan - Financial PresentationSnam 2023-27 Industrial Plan - Financial Presentation
Snam 2023-27 Industrial Plan - Financial Presentation
 
Collective Mining | Corporate Presentation - May 2024
Collective Mining | Corporate Presentation - May 2024Collective Mining | Corporate Presentation - May 2024
Collective Mining | Corporate Presentation - May 2024
 
Collective Mining | Corporate Presentation - May 2024
Collective Mining | Corporate Presentation - May 2024Collective Mining | Corporate Presentation - May 2024
Collective Mining | Corporate Presentation - May 2024
 
cyberagent_For New Investors_EN_240424.pdf
cyberagent_For New Investors_EN_240424.pdfcyberagent_For New Investors_EN_240424.pdf
cyberagent_For New Investors_EN_240424.pdf
 
Osisko Development - Investor Presentation - June 24
Osisko Development - Investor Presentation - June 24Osisko Development - Investor Presentation - June 24
Osisko Development - Investor Presentation - June 24
 
Corporate Presentation Probe June 2024.pdf
Corporate Presentation Probe June 2024.pdfCorporate Presentation Probe June 2024.pdf
Corporate Presentation Probe June 2024.pdf
 
Investor Day 2024 Presentation Sysco 2024
Investor Day 2024 Presentation Sysco 2024Investor Day 2024 Presentation Sysco 2024
Investor Day 2024 Presentation Sysco 2024
 
New Tax Regime User Guide Flexi Plan Revised (1).pptx
New Tax Regime User Guide Flexi Plan Revised (1).pptxNew Tax Regime User Guide Flexi Plan Revised (1).pptx
New Tax Regime User Guide Flexi Plan Revised (1).pptx
 

2Q16 Investor Factbook

  • 1. 1
  • 2. 2 —John Legere President and CEO of T-Mobile T-MobileUS,Inc. Investor Factbook T-MobileUSReportsSecond Quarter2016Results 1.9 Million Customer Nets, Record-Low Churn of 1.27%, Net Income of $225 Million, 12% Service Revenue Growth and 36% Adjusted EBITDA Growth Year- over-Year SecondQuarter2016Highlights: Customer momentum continues for the fastest growing wireless company in America:  1.9 million total net adds - 13th consecutive quarter of over 1 million  890,000 branded postpaid net adds  646,000 branded postpaid phone net adds - led industry in branded postpaid phone net adds for the 10th consecutive quarter  476,000 branded prepaid net adds - up 167% YoY due to strong growth from MetroPCS  Record-low branded postpaid phone churn of 1.27% - down 6 bps QoQ and 5 bps YoY Customer growth translating into industry-leading financial growth:  $6.9 billion service revenues, up 12.1% YoY  T-Mobile led industry in YoY service revenue percentage growth for 9th consecutive quarter  $9.2 billion total revenues, up 12.8% YoY  T-Mobile led industry in YoY total revenue percentage growth for 12th time in past 13 quarters  Net income of $225 million and earnings per share of $0.25  $2.5 billion Adjusted EBITDA, up 35.6% YoY  36% Adjusted EBITDA margin, up from 30% in the second quarter of 2015  Branded postpaid phone ARPU of $47.11, up 1.9% QoQ and generally stable adjusting for Data Stash Continued improvements in America’s fastest and fastest growing 4G LTE network:  Fastest 4G LTE network in the US - leading in average download speeds for 10th consecutive quarter  311 million POPs covered with 4G LTE  “Extended Range LTE” covers more than 200 million POPs across 350 market areas Raising customer outlook and narrowing Adjusted EBITDA target for 2016:  Guidance range for branded postpaid net adds increased to 3.4 to 3.8 million from 3.2 to 3.6 million  Narrowing Adjusted EBITDA target to $9.8 to $10.1 billion from $9.7 to $10.2 billion  Guidance includes aggregate impact of leasing and Data Stash now expected to be $0.8 to $1.0 billion, and the $0.6 billion spectrum gain in the first quarter of 2016  Maintaining guidance of $4.5 to $4.8 billion of cash capital expenditures “We outperformed the competition again on every key metric, while delivering the best postpaid phone churn numbers in our history!” said John Legere, President and CEO of T-Mobile. “Quarter after quarter this team continues to deliver results that are the best in the business despite the competition’s best efforts to compete.”
  • 3. 3 CUSTOMERMETRICS Branded Postpaid Customers  Branded postpaid net customer additions were 890,000 in the second quarter of 2016 compared to 1,041,000 in the first quarter of 2016 and 1,008,000 in the second quarter of 2015. The sequential and year-over-year decline in branded postpaid net customer additions was primarily due to the absence of iconic device launches in the period.  Branded postpaid phone net customer additions were 646,000 in the second quarter of 2016, compared to 877,000 in the first quarter of 2016 and 760,000 in the second quarter of 2015. T-Mobile led the industry in branded postpaid phone net customer additions for the 10th consecutive quarter.  Branded postpaid mobile broadband net customer additions were 244,000 in the second quarter of 2016, compared to 164,000 in the first quarter of 2016 and 248,000 in the second quarter of 2015.  Branded postpaid phone churn was 1.27% in the second quarter of 2016, down 6 basis points from 1.33% in the first quarter of 2016 and down 5 basis points from 1.32% in the second quarter of 2015. This quarter marked the best ever branded postpaid phone churn performance in the Company’s history. The sequential and year-over-year decline in churn reflects a reduction in promotional activity across the industry in the second quarter of 2016 as well as ongoing improvements in the Company’s network, customer service, and the overall value of its offerings in the marketplace, resulting in increased customer satisfaction and loyalty.  In June 2016, T-Mobile entered into an agreement under which the Company agreed to sell its marketing and distribution rights to certain existing T-Mobile co-branded customers to a current MVNO partner. The transaction, expected to close late third quarter of 2016, is subject to regulatory approval and other closing conditions. Assuming closing, approximately 1.4 million branded postpaid phone customers and approximately 0.3 million branded prepaid customers would transition to being reported as wholesale customers. The customer transition is expected to have a significant impact on reported branded postpaid phone churn following closing. For example, on a pro-forma basis as if the transaction closed at the beginning of the second quarter of 2016, reported branded postpaid phone churn would have been 18 basis points lower at 1.09%. 760 843 917 877 646 248 242 375 164 244 2Q15 3Q15 4Q15 1Q16 2Q16 TotalBrandedPostpaidNetAdds (in thousands) Phone Mobile Broadband 1,008 1,085 1,292 1,041 890 1.32% 1.46% 1.46% 1.33% 1.27% 2Q15 3Q15 4Q15 1Q16 2Q16 BrandedPostpaidPhoneChurn
  • 4. 4 Branded Prepaid Customers  Branded prepaid net customer additions were 476,000 in the second quarter of 2016, compared to 807,000 in the first quarter of 2016 and 178,000 in the second quarter of 2015. The sequential decline was primarily due to seasonal factors. The year-over-year increase was primarily driven by successful MetroPCS promotional activities and continued growth in new markets.  Migrations to branded postpaid plans reduced branded prepaid net customer additions in the second quarter of 2016 by approximately 210,000, up from 200,000 in the first quarter of 2016 and 175,000 in the second quarter of 2015.  Branded prepaid churn was 3.91% in the second quarter of 2016, compared to 3.84% in the first quarter of 2016 and 4.93% in the second quarter of 2015. The sequential increase was primarily due to seasonal factors. The year-over-year decline was primarily impacted by strong performance at the MetroPCS brand and a methodology change that occurred in the third quarter of 2015. Total Branded Customers  Total branded net customer additions were 1,366,000 in the second quarter of 2016 compared to 1,848,000 in the first quarter of 2016 and 1,186,000 in the second quarter of 2015. This was the 10th consecutive quarter in which branded net customer additions surpassed the one million milestone. Wholesale Customers  Wholesale net customer additions were 515,000 in the second quarter of 2016 compared to 373,000 in the first quarter of 2016 and 886,000 in the second quarter of 2015. 178 595 469 807 476 2Q15 3Q15 4Q15 1Q16 2Q16 TotalBrandedPrepaidNetAdds (in thousands) 4.93% 4.09% 4.20% 3.84% 3.91% 2Q15 3Q15 4Q15 1Q16 2Q16 BrandedPrepaidChurn 1,186 1,680 1,761 1,848 1,366 2Q15 3Q15 4Q15 1Q16 2Q16 TotalBrandedNetAdds (in thousands) 886 632 301 373 515 2Q15 3Q15 4Q15 1Q16 2Q16 WholesaleNetAdds (in thousands)
  • 5. 5 Total Customers  Total net customer additions were 1,881,000 in the second quarter of 2016 compared to 2,221,000 in the first quarter of 2016 and 2,072,000 in the second quarter of 2015. This was the 13th consecutive quarter in which total net customer additions exceeded one million.  T-Mobile ended the second quarter of 2016 with 67.4 million total customers, up more than 24 million customers on a pro forma combined basis from the end of the first quarter of 2013, when T-Mobile launched the first Un-carrier initiative. T-MobileCoverageMap (as of June 30, 2016) NETWORK Network Modernization Update  T-Mobile now provides 4G LTE coverage to 311 million people. This is up from 308 million as of the first quarter 2016 earnings, and 290 million as of the second quarter 2015 earnings.  Wideband LTE, which refers to markets that have bandwidth of at least 15+15 MHz dedicated to 4G LTE, is now available nationwide, covering 224 million people.  Voice over LTE (“VoLTE”) comprised 57% of total voice call minutes in the second quarter of 2016 compared to 16% in the second quarter of 2015. Moving voice traffic to VoLTE frees up capacity and allows for an accelerated re-farming of spectrum currently used for 2G and 3G. T-Mobile is leading the US wireless industry in terms of VoLTE migration. Based on T-Mobile’s analysis of crowd-sourced 4G LTE download speeds. Network Speed  T-Mobile continues to have the fastest nationwide 4G LTE network in the U.S. based on download speeds from millions of user-generated tests. This is the tenth consecutive quarter that T-Mobile has led the industry in average download speeds.  In the second quarter of 2016, T-Mobile’s average 4G LTE download speed was 22.4 Mbps compared to Verizon at 21.6 Mbps, AT&T at 20.7 Mbps, and Sprint at 16.1 Mbps. 2,072 2,312 2,062 2,221 1,881 2Q15 3Q15 4Q15 1Q16 2Q16 TotalNetAdds (in thousands) 22.4 21.6 20.7 16.1 T-Mobile Verizon AT&T Sprint Average4GLTESpeeds-2Q16 (in Mbps)
  • 6. 6 Spectrum  At the end of the second quarter of 2016, T-Mobile owns or has agreements to own an average of 86 MHz of spectrum across the top 25 markets in the U.S. The spectrum is comprised of an average of 12 MHz in the 700 MHz band, 30 MHz in the 1900 MHz PCS band, and 44 MHz in the AWS band.  During the first and second quarters of 2016, T-Mobile entered into agreements with multiple parties to acquire 700 MHz A- Block spectrum licenses covering approximately 59 million POPs for $1.1 billion. These transactions, the majority of which are expected to close in the second half of 2016, will increase T- Mobile’s low-band spectrum holdings from 210 million POPs to 269 million POPs upon closing and include the cities of Chicago, Nashville, Salt Lake City and Columbus.  The Company is a qualified bidder in the 600 MHz broadcast incentive auction. A-Block Update  T-Mobile owns or has agreements to own 700 MHz A-Block spectrum covering 269 million people or approximately 83% of the U.S. population. The spectrum covers all of the top 10 market areas and 29 of the top 30 market areas in the U.S.  T-Mobile has deployed its 700 MHz A-Block spectrum in 350 market areas covering more than 200 million people under the brand name “Extended Range LTE.” Extended Range LTE travels up to twice as far as mid-band spectrum and works up to four times better in buildings. The Company expects to continue to aggressively roll-out new 700 MHz sites in 2016 including the cities of San Francisco, Phoenix, San Diego, and Las Vegas. UN-CARRIERINITIATIVES  At the end of the second quarter of 2016, 95% of the branded postpaid customer base was on a Simple Choice plan, up from 94% at the end of the first quarter of 2016 and 93% at the end of the second quarter of 2015.  At the end of the second quarter of 2016, 14.0 million customers were enrolled in T-Mobile’s JUMP! programs, up from 13.7 million at the end of the first quarter of 2016 and 11.3 million at the end of the second quarter of 2015. Un-carrier Updates  Un-carrier 11: GET THANKED: On June 6, 2016, T-Mobile introduced its eleventh Un-carrier move, a set of initiatives dedicated exclusively to thanking T-Mobile customers. It was the biggest Un-carrier yet in terms of media coverage and social media discussions. 700MHz, 12 PCS,30 AWS,44 T-Mobile AverageSpectrum Ownership,Top25Markets (Band, in MHz) 11.3 12.2 13.3 13.7 14.0 2Q15 3Q15 4Q15 1Q16 2Q16 TotalCustomersEnrolledin JUMP! Programs (in millions)
  • 7. 7  Stock Up™ is a program that provides eligible T-Mobile customers the opportunity to become T-Mobile owners by offering every existing and new account holder a full share of T- Mobile common stock. Customers can also grow their ownership by up to 100 shares per year by earning one share for every new active account they refer.  As part of Un-carrier 11, the Company also launched T-Mobile Tuesdays, a program that thanks all of our eligible customers with free stuff and a chance to win epic prizes every Tuesday. All customers need to do to get thanked is to download the T-Mobile Tuesdays app and check in every Tuesday to claim their gifts. Since T-Mobile Tuesdays launched, the app was ranked #1 on the Apple App Store and has been downloaded nearly 5 million times, and customers have hit the redemption button 8 million times to receive their gifts.  T-Mobile continues to add new and exciting gifts and prizes to the T-Mobile Tuesdays line-up. Most recently, the Company added free, unlimited data for Pokemon Go for a full year.  Binge On Amped: T-Mobile has continued to expand its popular video initiative to include even more services that can stream without using up customers’ high-speed data allotment. More than 100 video services now qualify including new services like PBS, ABC and Disney Channel in addition to initial program participants like Netflix, Hulu and HBO GO. T-Mobile customers have streamed more than three quarters of a billion hours of video without using their high-speed data allowance since the launch of Binge On in November 2015. DEVICES  Total devices sold or leased were 8.9 million units in the second quarter of 2016 compared to 9.4 million units in the first quarter of 2016 and 8.3 million units in the second quarter of 2015.  Total smartphones sold or leased were 8.1 million units in the second quarter of 2016 compared to 8.8 million units in the first quarter of 2016 and 7.4 million units in the second quarter of 2015.  The upgrade rate for branded postpaid customers was approximately 6% in the second quarter of 2016 compared to approximately 7% in the first quarter of 2016 and approximately 9% in the second quarter of 2015. 24 56 87 102 4Q15 1Q16 2Q16 Current Binge OnServicePartners DevicesSoldorLeased (in million units) 2Q15 1Q16 2Q16 Total Company Smartphones 7.4 8.8 8.1 Non-Smartphones 0.5 0.2 0.3 Mobile Broadband Devices 0.4 0.4 0.5 Total Company 8.3 9.4 8.9
  • 8. 8 DEVICEFINANCING Equipment Installment Plans (EIP)  T-Mobile financed $1.562 billion of equipment sales on EIP in the second quarter of 2016, up 25.4% from $1.246 billion in the first quarter of 2016 and down 8.0% from $1.697 billion in the second quarter of 2015. The sequential increase was primarily due to the mix shift back to the EIP program which started in the first quarter of 2016 and continued in the second quarter of 2016. The year-over-year decrease was primarily due to promotions for devices, the impact of the JUMP! On Demand program launched at the end of the second quarter of 2015, and a lower upgrade rate for branded postpaid customers.  Customers on Simple Choice plans had associated EIP billings of $1.344 billion in the second quarter of 2016, up 1.5% compared to $1.324 billion in the first quarter of 2016 and down 3.5% from $1.393 billion in the second quarter of 2015. The sequential increase was primarily due to a higher level of devices financed using EIP plans. The year-over-year decline was primarily due to promotions for devices, the impact of the JUMP! On Demand program launched at the end of the second quarter of 2015, and a lower upgrade rate for branded postpaid customers in the second quarter of 2016.  Total EIP receivables, net of imputed discount and allowances for credit losses, was $2.662 billion at the end of the second quarter of 2016 compared to $3.053 billion at the end of the first quarter of 2016 and $5.114 billion at the end of the second quarter of 2015. The sequential and year-over-year decline in the total EIP receivables, net was primarily due to sales of certain EIP receivables and the impact of the JUMP! On Demand program launched at the end of the second quarter of 2015.  In the second quarter of 2016, T-Mobile amended the terms of its arrangement to sell certain EIP accounts receivable to increase its maximum funding commitment thereunder from $800 million to $1.3 billion. As of June 30, 2016, the arrangement provided funding of $1.2 billion, an increase of $0.4 billion, compared to March 31, 2016. T-Mobile will continue to service the customers and the related receivables, including facilitating customer payment collection, in exchange for a monthly fee. Leasing Plans  Leased devices transferred from inventory to property and equipment, net was $52 million in the second quarter of 2016 compared to $653 million in the first quarter of 2016. The sequential decline was primarily due to the continued mix shift back to the EIP program in the second quarter of 2016. $272 $(343) $(1,546) $(172) $(391) $5,114 $4,771 $3,225 $3,053 $2,662 2Q15 3Q15 4Q15 1Q16 2Q16 TotalEIPReceivables,netandQoQ Changein TotalEIPReceivables ($ in millions) QoQChginTotalEIP TotalEIPRec.,net
  • 9. 9  Depreciation expense associated with leased devices was $397 million in the second quarter of 2016 compared to $403 million in the first quarter of 2016.  Leased devices included in property and equipment, net were $1.878 billion at the end of the second quarter of 2016 compared to $2.223 billion at the end of the first quarter of 2016.  Lease revenues were $367 million in the second quarter of 2016 compared to $342 million in the first quarter of 2016.  Original consideration received and lease revenues, net were $327 million in the second quarter of 2016, down from $377 million in the first quarter of 2016. Original consideration represents cash down payments received from customers at operating lease inception, which is amortized over the term of the lease. Lease revenues, net exclude amortization of the original consideration.  The difference between the original consideration received and lease revenues, net, and the amount of leased devices transferred from inventory to property and equipment, net of returns approximates the working capital impact of leasing.  Future minimum lease payments expected to be received over the lease term were $1.178 billion at the end of the second quarter of 2016, down from $1.425 billion at the end of the first quarter of 2016. Future minimum lease payments exclude optional residual buy-out amounts at the end of the lease term. CUSTOMERQUALITY  Total bad debt expense and losses from sales of receivables was $165 million in the second quarter of 2016 compared to $173 million in the first quarter of 2016 and $156 million in the second quarter of 2015.  As a percentage of total revenues, total bad debt expense and losses from sales of receivables was 1.79% in the second quarter of 2016 compared to 2.01% in the first quarter of 2016 and 1.91% in the second quarter of 2015.  Total bad debt expense and losses from sales of receivables was sequentially lower in the second quarter of 2016. Typically, bad debt expense tends to increase seasonally in the second half of the year compared to the first half. $87 $293 $377 $327 $822 $1,463 $653 $52 3Q15 4Q15 1Q16 2Q16 LeasedDevicesTransferredto P&E, netandOriginal Consideration Received&LeaseRevenues,Net ($ in millions) Cons. Rec'd&LeaseRevs,Net LeasedDevicesTrans.toP&E $156 $198 $228 $173 $165 1.91% 2.52% 2.76% 2.01% 1.79% 2Q15 3Q15 4Q15 1Q16 2Q16 TotalBadDebtExpenseandLosses fromSalesofReceivables ($ in millions, % of Total Revs)
  • 10. 10  EIP receivables classified as Prime were 42% of total EIP receivables at the end of the second quarter of 2016, down compared to 47% at the end of the first quarter of 2016 and 52% at the end of the second quarter of 2015. The sequential and year-over-year decline in EIP receivables classified as Prime was due to the continued sales of certain EIP receivables and the additional EIP securitization in the second quarter of 2016. Including the EIP receivables sold, total EIP receivables classified as Prime were 53% at the end of the second quarter of 2016, compared to 52% at the end of the first quarter of 2016. REVENUEMETRICS Branded Postpaid Phone ARPU  Branded postpaid phone ARPU was $47.11 in the second quarter of 2016, up 1.9% from $46.21 in the first quarter of 2016 and down 2.2% from $48.19 in the second quarter of 2015. As noted in prior quarters, branded postpaid phone ARPU in the second quarter of 2016 was impacted by the non- cash net revenue deferral for Data Stash.  Excluding the impact of Data Stash, branded postpaid phone ARPU in the second quarter of 2016 increased by 0.8% sequentially and declined by 0.4% year-over-year. Branded postpaid phone ARPU was generally stable as continued strategic focus on family plan penetration, promotional activity, and Un-carrier initiatives were offset by higher data attach rates and growth in insurance programs revenue. Branded Postpaid ABPU  Branded postpaid ABPU was $62.59 in the second quarter of 2016, up 1.1% from $61.90 in the first quarter of 2016 and down 1.1% from $63.29 in the second quarter of 2015. Branded postpaid ABPU in the second quarter of 2016 was impacted by the non-cash net revenue deferral for Data Stash.  Excluding the impact of Data Stash, branded postpaid ABPU in the second quarter of 2016 increased by 0.3% sequentially and by 0.3% year-over-year. Sequentially and year-over-year, the slight increase in branded postpaid ABPU was primarily due to stability in branded postpaid phone ARPU. Growth in total lease revenues and EIP billings on a per user basis also contributed to the year-over-year increase. $48.19 $47.99 $48.05 $46.21 $47.11 2Q15 3Q15 4Q15 1Q16 2Q16 BrandedPostpaidPhoneARPU ($ per month) $63.29 $62.96 $63.74 $61.90 $62.59 2Q15 3Q15 4Q15 1Q16 2Q16 BrandedPostpaidABPU ($ per month)
  • 11. 11 Branded Postpaid Customers per Account  Branded postpaid customers per account was 2.64 at the end of the second quarter of 2016, compared to 2.59 at the end of the first quarter of 2016 and 2.43 at the end of the second quarter of 2015. The sequential and year-over-year increase was primarily due to ongoing service promotions targeting families and increased penetration of mobile broadband devices. Branded Prepaid ARPU  Branded prepaid ARPU was $37.86 in the second quarter of 2016, up 0.7% from $37.58 in the first quarter of 2016 and flat compared to $37.83 in the second quarter of 2015. Sequentially and year-over-year, the slight increases were primarily due to an increase in the mix of branded prepaid customers choosing plans with more data, partially offset by dilution from growth of customers on rate plan promotions. REVENUES Service Revenues  T-Mobile once again led the industry in year-over-year service revenue percentage growth in the second quarter of 2016. This marks the ninth consecutive quarter that T-Mobile has led the industry in year-over-year service revenue percentage growth.  Service revenues were $6.888 billion in the second quarter of 2016, up 4.7% from $6.578 billion in the first quarter of 2016 and up 12.1% from $6.144 billion in the second quarter of 2015.  Sequentially, the increase in service revenues was primarily due to growth in the Company’s customer base from the continued success of T-Mobile’s Un-carrier initiatives and the Company’s prepaid brands, strong customer response to promotional activities targeting families, growth in insurance programs revenue, and a sequentially lower non-cash net revenue deferral from Data Stash, which totaled $88 million in the second quarter of 2016, compared to $138 million in the first quarter of 2016. 2.43 2.48 2.54 2.59 2.64 2Q15 3Q15 4Q15 1Q16 2Q16 BrandedPostpaidCustomersper Account $37.83 $37.46 $37.63 $37.58 $37.86 2Q15 3Q15 4Q15 1Q16 2Q16 BrandedPrepaidARPU ($ per month)
  • 12. 12  Year-over-year, the increase in service revenues was primarily due to growth in the Company’s customer base from the continued success of T-Mobile’s Un-carrier initiatives and the Company’s prepaid brands, strong customer response to promotional activities targeting families, and growth in insurance programs revenue. These increases were partially offset by a higher non-cash net revenue deferral from Data Stash, which totaled $88 million in the second quarter of 2016, compared to $3 million in the second quarter of 2015. Equipment Revenues  Equipment revenues were $2.188 billion in the second quarter of 2016, up 18.2% from $1.851 billion in the first quarter of 2016 and up 14.3% from $1.915 billion in the second quarter of 2015. Equipment revenues in the second quarter of 2016 were comprised of lease revenues of $367 million and non-leased revenues of $1.821 billion.  Sequentially, the increase in equipment revenues was primarily due to the continued mix shift back to the EIP program during the second quarter of 2016, which resulted in an increase in the average revenue per device sold and the number of devices sold. Under the EIP program, equipment revenues are recognized when the device is delivered to the customer rather than over the term of a lease, resulting in higher equipment revenues for the quarter.  Year-over-year, the increase in equipment revenues was primarily due to an increase in lease revenues and a higher number of devices sold, partially offset by a lower average revenue per device sold due to promotions for devices and the impact from the JUMP! On Demand program, which launched at the end of the second quarter of 2015. Total Revenues  T-Mobile once again led the industry in year-over-year total revenue percentage growth in the second quarter of 2016. This marks the twelfth time in the past thirteen quarters that T- Mobile has led the industry in year-over-year total revenue percentage growth.  Total revenues were $9.222 billion in the second quarter of 2016, up 7.2% from $8.599 billion in the first quarter of 2016 and up 12.8% from $8.179 billion in the second quarter of 2015.  Sequentially, the increase in total revenues was primarily due to higher equipment revenues from the continued mix shift back to the EIP program and an increase in service revenues in the second quarter of 2016. $6,144 $6,302 $6,556 $6,578 $6,888 2Q15 3Q15 4Q15 1Q16 2Q16 ServiceRevenues ($ in millions) $1,915 $1,416 $1,536 $1,851 $2,188 2Q15 3Q15 4Q15 1Q16 2Q16 EquipmentRevenues ($ in millions) $8,179 $7,849 $8,247 $8,599 $9,222 2Q15 3Q15 4Q15 1Q16 2Q16 TotalRevenues ($ in millions)
  • 13. 13  Year-over-year, the increase in total revenues was primarily due to higher service revenues from growth in the customer base and higher equipment revenues. OPERATINGEXPENSES Cost of Services  Cost of services was $1.429 billion in the second quarter of 2016, up 0.6% from $1.421 billion in the first quarter of 2016 and up 2.3% from $1.397 billion in the second quarter of 2015.  Year-over-year, the increase in cost of services was primarily due to the network expansion, 700 MHz A-Block build-out, higher lease expense and higher regulatory program costs, partially offset by lower domestic customer roaming and lower long distance costs. Cost of Equipment Sales  Cost of equipment sales was $2.619 billion in the second quarter of 2016, up 10.3% from $2.374 billion in the first quarter of 2016 and down 1.6% from $2.661 billion in the second quarter of 2015.  Sequentially, the increase in cost of equipment sales was primarily due to the continued mix shift back to the EIP program during the second quarter of 2016, which resulted in an increase in the average cost per device sold and the number of devices sold. Under the EIP program, the cost of a device is recognized as cost of equipment sales at the time the device is delivered to the customer rather than recognized as depreciation expense over the term of the lease, resulting in higher cost of equipment sales for the quarter.  Year-over-year, the decrease was primarily driven by a lower average cost per device sold due in part to the impact from the JUMP! On Demand program which launched at the end of the second quarter of 2015, partially offset by an increase in the number of devices sold. Selling, General and Admin. (SG&A) Expenses  SG&A expenses were $2.772 billion in the second quarter of 2016, up 0.8% from $2.749 billion in the first quarter of 2016 and up 13.7% from $2.438 billion in the second quarter of 2015.  Sequentially, the slight increase in SG&A expenses was primarily due to strategic investments to support growing the customer base, partially offset by lower commissions due to lower branded customer additions. $1,397 $1,378 $1,384 $1,421 $1,429 22.7% 21.9% 21.1% 21.6% 20.7% 2Q15 3Q15 4Q15 1Q16 2Q16 CostofServices ($ in millions, % of Service Revs) $2,661 $1,985 $2,019 $2,374 $2,619 139.0% 140.2% 131.4% 128.3% 119.7% 2Q15 3Q15 4Q15 1Q16 2Q16 CostofEquipmentSales ($ in millions, % of Equipment Sales Revs) $2,438 $2,624 $2,755 $2,749 $2,772 39.7% 41.6% 42.0% 41.8% 40.2% 2Q15 3Q15 4Q15 1Q16 2Q16 SG&AExpenses ($ in millions, % of Service Revs)
  • 14. 14  Year-over-year, the increase was primarily due to strategic investments to support the growing customer base including higher promotional costs, employee-related expenses and commissions driven by higher branded customer additions. Depreciation and Amortization (D&A)  D&A was $1.575 billion in the second quarter of 2016, up 1.5% from $1.552 billion in the first quarter of 2016 and up 46.5% from $1.075 billion in the second quarter of 2015. D&A in the second quarter of 2016 was comprised of device lease-related D&A of $397 million and non-device lease-related D&A of $1.178 billion.  Sequentially, the increase in D&A was primarily due to an increase in non-device lease related D&A related to the continued build-out of the Company’s 4G LTE network, partially offset by a decrease in device lease-related D&A.  Year-over-year, the increase was primarily due to the impact of leasing. Under leasing, the cost of the leased device is recognized as depreciation expense over the term of the lease rather than recognized as cost of equipment sales when the device is delivered to the customer. The total number of leased devices was higher year-over-year, resulting in higher depreciation expense. ADJUSTEDEBITDA  T-Mobile led the industry in year-over-year Adjusted EBITDA percentage growth in the second quarter of 2016.  Adjusted EBITDA was $2.464 billion in the second quarter of 2016, down 10.4% from $2.749 billion in the first quarter of 2016 and up 35.6% from $1.817 billion in the second quarter of 2015.  Excluding spectrum gains from the first quarter of 2016 and the second quarter of 2015, Adjusted EBITDA increased by 16.6% sequentially and by 37.3% year-over-year.  Sequentially, the decline in Adjusted EBITDA was primarily due to the spectrum gain recorded in the first quarter of 2016. Excluding the spectrum gain, Adjusted EBITDA increased primarily due to growth in the customer base and lower losses on equipment, and a sequentially lower non-cash impact of Data Stash.  Year-over-year, the increase in Adjusted EBITDA was primarily due to growth in the customer base and lower losses on equipment, partially offset by higher SG&A expenses due to strategic investments to support the growing customer base and a higher non-cash impact of Data Stash. $1,075 $1,157 $1,369 $1,552 $1,575 13.1% 14.7% 16.6% 18.0% 17.1% 2Q15 3Q15 4Q15 1Q16 2Q16 D&AExpenses ($ in millions, % of Total Revs) $1,817 $1,908 $2,280 $2,749 $2,464 2Q15 3Q15 4Q15 1Q16 2Q16 AdjustedEBITDA ($ in millions)
  • 15. 15  Adjusted EBITDA margin was 36% in the second quarter of 2016 compared to 42% in the first quarter of 2016 and 30% in the second quarter of 2015. Excluding spectrum gains from the first quarter of 2016 and the second quarter of 2015, Adjusted EBITDA margin was 36% in the second quarter of 2016, compared to 32% in the first quarter of 2016 and 29% in the second quarter of 2015.  The aggregate impact from leasing and Data Stash on Adjusted EBITDA in the second quarter of 2016 was $279 million. Lease revenues were $367 million and the net impact from Data Stash was $88 million in the second quarter of 2016. NETINCOMEAND EARNINGSPER SHARE  Net income was $225 million in the second quarter of 2016 compared to net income of $479 million in the first quarter of 2016 and $361 million in the second quarter of 2015.  Earnings per share was $0.25 in the second quarter of 2016 compared to earnings per share of $0.56 in the first quarter of 2016 and $0.42 in the second quarter of 2015. Sequentially the decrease was primarily due to the after-tax impact of the spectrum gain of $0.46 in the first quarter of 2016. Year-over- year, the decrease was due to several factors: higher interest expense related to higher debt balances with third parties, lower interest income, and lower income tax expense in the second quarter of 2015 due to the impact of income tax benefits for discrete income tax items recognized in 2015. These decreases were offset by higher operating income. CAPITALEXPENDITURES  Cash capital expenditures for property and equipment were $1.349 billion in the second quarter of 2016 compared to $1.335 billion in the first quarter of 2016 and $1.191 billion in the second quarter of 2015. The sequential and year-over-year increases were primarily due to the timing of network spend in connection with T-Mobile’s build out of its 4G LTE network.  Cash capital expenditures for property and equipment for the six months ended were $2.684 billion in 2016 compared to $2.173 billion for the same period in 2015, an increase of $511 million. FREECASHFLOW  Net cash provided by operating activities was $1.768 billion in the second quarter of 2016, compared to $1.025 billion in the first quarter of 2016 and $1.161 billion in the second quarter of 2015.  Free Cash Flow was $419 million in the second quarter of 2016, compared to an outflow of $310 million in the first quarter of 2016 and an outflow of $30 million in the second quarter of 2015. Sequentially, the increase in free cash flow was primarily due to an increase in net cash provided by operating activities including sales of certain EIP receivables. Year-over-year, the $361 $138 $297 $479 $225 2Q15 3Q15 4Q15 1Q16 2Q16 NetIncome ($ in millions) $1,191 $1,120 $1,431 $1,335 $1,349 19.4% 17.8% 21.8% 20.3% 19.6% 2Q15 3Q15 4Q15 1Q16 2Q16 CashCapitalExpenditures ($ in millions, % of Service Revs) $(30) $411 $802 $(310) $419 2Q15 3Q15 4Q15 1Q16 2Q16 FreeCashFlow ($ in millions)
  • 16. 16 increase in free cash flow was primarily due to an increase in net cash provided by operating activities, partially offset by an increase in cash capital expenditures. Sequentially and year- over-year, the net cash proceeds related to sales of certain EIP receivables increased by $0.4 billion.  Adjusted Free Cash Flow was $485 million in the second quarter of 2016, compared to an outflow of $247 million in the first quarter of 2016 and an inflow of $73 million in the second quarter of 2015. Adjusted Free Cash Flow excludes decommissioning payments related to the one-time shutdown of the CDMA portion of the MetroPCS network. Decommissioning payments in the second quarter of 2016 were $66 million, compared to $63 million in the first quarter of 2016 and $103 million in the second quarter of 2015.  Adjusted Free Cash Flow for the six months ended was $238 million in 2016 compared to an outflow of $349 million for the same period in 2015 in spite of cash capital expenditures which increased by $511 million, and the paydown of Accounts payable and accrued liabilities amounting to $837 million in the first half of 2016, compared to $546 million in the first half of 2015. CAPITALSTRUCTURE  Net debt, excluding tower obligations, at the end of the second quarter of 2016 was $21.894 billion.  Total debt, excluding tower obligations, at the end of the second quarter of 2016 was $27.432 billion and was comprised of short-term debt of $258 million, long-term debt to affiliates of $5.600 billion, and long-term debt of $21.574 billion.  The ratio of net debt, excluding tower obligations, to Adjusted EBITDA for the trailing last twelve month (“LTM”) period was 2.3x at the end of the second quarter of 2016 compared to 2.3x at the end of the first quarter of 2016 and 3.1x at the end of the second quarter of 2015.  The Company’s cash position remains strong with $5.538 billion in cash and cash equivalents at the end of the second quarter of 2016. The cash and short-term investments balance decreased in the second quarter of 2016 compared to the first quarter of 2016 primarily due to the Company making a refundable deposit of $2.203 billion to a third party in connection with a potential asset purchase.  On April 1, 2016, T-Mobile issued $1.0 billion of 6% Senior Notes due 2024 in a registered public offering.  On April 25, 2016, T-Mobile entered into a purchase agreement with Deutsche Telekom AG (“Deutsche Telekom”), under which T-Mobile may, at its option, issue and sell to Deutsche Telekom up to $1.35 billion of 6.000% Senior Notes due 2024. $73 $487 $897 $(247) $485 2Q15 3Q15 4Q15 1Q16 2Q16 AdjustedFreeCashFlow ($ in millions) $19.7 $19.5 $18.7 $19.9 $21.9 3.1x 2.8x 2.5x 2.3x 2.3x 2Q15 3Q15 4Q15 1Q16 2Q16 NetDebt(excl.TowerObligations) ($ in billions, Net Debt to LTM Adj. EBITDA)
  • 17. 17  On April 29, 2016, T-Mobile and certain of its affiliates, as guarantors, entered into another purchase agreement with Deutsche Telekom, under which T-Mobile may, at its option, issue and sell to Deutsche Telekom up to an additional $650 million of 6.000% Senior Notes due 2024.  T-Mobile expects to use the net proceeds from these offerings for the purchase of spectrum licenses, or if not used for spectrum purchases, refinancing of existing debt, or general corporate purposes. GUIDANCE  T-Mobile expects to drive further customer momentum while delivering strong growth in Adjusted EBITDA and free cash flow in 2016.  Branded postpaid net customer additions for full-year 2016 are now expected to be between 3.4 and 3.8 million, an increase from the previous guidance range of 3.2 to 3.6 million.  For full-year 2016, T-Mobile now expects Adjusted EBITDA to be in the range of $9.8 to $10.1 billion, narrowing the previous guidance range of $9.7 to $10.2 billion. This guidance includes the aggregate impact from leasing and Data Stash now expected to be approximately $0.8 to $1.0 billion, and the spectrum gain of $0.6 billion recognized in the first quarter of 2016.  Cash capital expenditures for full-year 2016 are expected to be in the range of $4.5 to $4.8 billion, unchanged from previous guidance. UPCOMINGEVENTS (All dates and attendance tentative)  Oppenheimer 19th Annual Technology, Internet & Communications Conference, August 9-10, 2016, Boston, MA  Goldman Sachs 25th Annual Communacopia Conference, September 20–22, 2016, New York, NY  Deutsche Bank Leveraged Finance Conference, September 26–28, 2016, Scottsdale, AZ CONTACTINFORMATION Press: Investor Relations: Media Relations Nils Paellmann, nils.paellmann@t-mobile.com T-Mobile US, Inc. Ben Barrett, ben.barrett@t-mobile.com Jon Perachio, jonathan.perachio@t-mobile.com Cristal Dunkin, cristal.dunkin@t-mobile.com 877-281-TMUS or 212-358-3210 mediarelations@t-mobile.com investor.relations@t-mobile.com http://newsroom.t-mobile.com http://investor.t-mobile.com 2016GuidanceOutlook Original 1Q16 2Q16 Branded Postpaid Net Adds (in millions) 2.4 - 3.4 3.2 - 3.6 3.4 - 3.8 Adjusted EBITDA ($ in billions) $9.1 - $9.7 $9.7- $10.2 $9.8- $10.1 Cash Capex ($ in billions) $4.5 - $4.8 Unchanged Unchanged
  • 18. 18 T-Mobile US, Inc. Condensed Consolidated Balance Sheets (Unaudited) (in millions, except share and per share amounts) June 30, 2016 December 31, 2015 Assets Current assets Cash and cash equivalents $ 5,538 $ 4,582 Short-term investments — 2,998 Accounts receivable, net of allowances of $125 and $116 1,866 1,788 Equipment installment plan receivables, net 1,831 2,378 Accounts receivable from affiliates 39 36 Inventories 1,388 1,295 Asset purchase deposit 2,203 — Other current assets 1,415 1,813 Total current assets 14,280 14,890 Property and equipment, net 20,570 20,000 Goodwill 1,683 1,683 Spectrum licenses 25,536 23,955 Other intangible assets, net 486 594 Equipment installment plan receivables due after one year, net 831 847 Other assets 582 444 Total assets $ 63,968 $ 62,413 Liabilities and Stockholders' Equity Current liabilities Accounts payable and accrued liabilities $ 6,985 $ 8,084 Payables to affiliates 203 135 Short-term debt 258 182 Deferred revenue 936 717 Other current liabilities 370 410 Total current liabilities 8,752 9,528 Long-term debt 21,574 20,461 Long-term debt to affiliates 5,600 5,600 Tower obligations 2,634 2,658 Deferred tax liabilities 4,427 4,061 Deferred rent expense 2,548 2,481 Other long-term liabilities 1,038 1,067 Total long-term liabilities 37,821 36,328 Commitments and contingencies Stockholders' equity 5.50% Mandatory Convertible Preferred Stock Series A, par value $0.00001 per share, 100,000,000 shares authorized; 20,000,000 and 20,000,000 shares issued and outstanding; $1,000 and $1,000 aggregate liquidation value — — Common Stock, par value $0.00001 per share, 1,000,000,000 shares authorized; 824,116,744 and 819,773,724 shares issued, 822,704,856 and 818,391,219 shares outstanding — — Additional paid-in capital 38,763 38,666 Treasury stock, at cost, 1,411,888 and 1,382,505 shares issued (1) — Accumulated other comprehensive loss (1) (1) Accumulated deficit (21,366) (22,108) Total stockholders' equity 17,395 16,557 Total liabilities and stockholders' equity $ 63,968 $ 62,413
  • 19. 19 T-Mobile US, Inc. Condensed Consolidated Statements of Comprehensive Income (Unaudited) Three Months Ended Six Months Ended June 30, (in millions, except share and per share amounts) June 30, 2016 March 31, 2016 June 30, 2015 2016 2015 Revenues Branded postpaid revenues $ 4,509 $ 4,302 $ 4,075 $ 8,811 $ 7,849 Branded prepaid revenues 2,119 2,025 1,861 4,144 3,703 Wholesale revenues 207 200 164 407 322 Roaming and other service revenues 53 51 44 104 89 Total service revenues 6,888 6,578 6,144 13,466 11,963 Equipment revenues 2,188 1,851 1,915 4,039 3,766 Other revenues 146 170 120 316 228 Total revenues 9,222 8,599 8,179 17,821 15,957 Operating expenses Cost of services, exclusive of depreciation and amortization shown separately below 1,429 1,421 1,397 2,850 2,792 Cost of equipment sales 2,619 2,374 2,661 4,993 5,340 Selling, general and administrative 2,772 2,749 2,438 5,521 4,810 Depreciation and amortization 1,575 1,552 1,075 3,127 2,162 Cost of MetroPCS business combination 59 36 34 95 162 Gains on disposal of spectrum licenses — (636) (23) (636) (23) Total operating expenses 8,454 7,496 7,582 15,950 15,243 Operating income 768 1,103 597 1,871 714 Other income (expense) Interest expense (368) (339) (257) (707) (518) Interest expense to affiliates (93) (79) (92) (172) (156) Interest income 68 68 114 136 226 Other income (expense), net (3) (2) 1 (5) (7) Total other expense, net (396) (352) (234) (748) (455) Income before income taxes 372 751 363 1,123 259 Income tax (expense) benefit (147) (272) (2) (419) 39 Net income 225 479 361 704 298 Dividends on preferred stock (14) (14) (14) (28) (28) Net income attributable to common stockholders $ 211 $ 465 $ 347 $ 676 $ 270 Net income $ 225 $ 479 $ 361 $ 704 $ 298 Other comprehensive gain (loss), net of tax Unrealized gain (loss) on available-for-sale securities, net of tax effect of $2, ($2), $0, $0 and $0 3 (3) — — — Other comprehensive income (loss) 3 (3) — — — Total comprehensive income $ 228 $ 476 $ 361 $ 704 $ 298 Earnings per share Basic $ 0.26 $ 0.57 $ 0.43 $ 0.82 $ 0.33 Diluted $ 0.25 $ 0.56 $ 0.42 $ 0.81 $ 0.33 Weighted average shares outstanding Basic 822,434,490 819,431,761 811,605,031 820,933,126 810,113,564 Diluted 829,752,956 859,382,827 821,122,537 829,662,053 819,548,539
  • 20. 20 T-Mobile US, Inc. Condensed Consolidated Statements of Cash Flows (Unaudited) Three Months Ended Six Months Ended June 30, (in millions) June 30, 2016 March 31, 2016 June 30, 2015 2016 2015 Operating activities Net income $ 225 $ 479 $ 361 $ 704 $ 298 Adjustments to reconcile net income to net cash provided by operating activities Depreciation and amortization 1,575 1,552 1,075 3,127 2,162 Stock-based compensation expense 60 52 56 112 111 Deferred income tax expense (benefit) 140 264 (2) 404 (52) Bad debt expense 119 121 108 240 212 Losses from sales of receivables 46 52 48 98 113 Deferred rent expense 33 32 47 65 88 Gains on disposal of spectrum licenses — (636) (23) (636) (23) Changes in operating assets and liabilities Accounts receivable (105) (202) 62 (307) (108) Equipment installment plan receivables 343 109 (350) 452 (579) Inventories 3 (801) 87 (798) (58) Deferred purchase price from sales of receivables (204) 21 (17) (183) (12) Other current and long-term assets (56) 185 35 129 126 Accounts payable and accrued liabilities (345) (492) (153) (837) (546) Other current and long-term liabilities (74) 288 (182) 214 (90) Other, net 8 1 9 9 8 Net cash provided by operating activities 1,768 1,025 1,161 2,793 1,650 Investing activities Purchases of property and equipment (1,349) (1,335) (1,191) (2,684) (2,173) Purchases of spectrum licenses and other intangible assets, including deposits (2,245) (594) (148) (2,839) (1,844) Sales of short-term investments 2,923 75 — 2,998 — Other, net 4 (6) 2 (2) (12) Net cash used in investing activities (667) (1,860) (1,337) (2,527) (4,029) Financing activities Proceeds from issuance of long-term debt 997 — — 997 — Repayments of capital lease obligations (43) (36) (6) (79) (11) Repayments of short-term debt for purchases of inventory, property and equipment, net (150) — (185) (150) (248) Repayments of long-term debt (5) (5) — (10) — Tax withholdings on share-based awards (3) (46) (70) (49) (98) Dividends on preferred stock (14) (14) (14) (28) (28) Other, net 8 1 61 9 91 Net cash provided by (used in) financing activities 790 (100) (214) 690 (294) Change in cash and cash equivalents 1,891 (935) (390) 956 (2,673) Cash and cash equivalents Beginning of period 3,647 4,582 3,032 4,582 5,315 End of period $ 5,538 $ 3,647 $ 2,642 $ 5,538 $ 2,642
  • 21. 21 T-Mobile US, Inc. Supplementary Operating and Financial Data Quarter Six Months Ended June 30, (in thousands) Q1 2015 Q2 2015 Q3 2015 Q4 2015 Q1 2016 Q2 2016 2015 2016 Customers, end of period Branded postpaid phone customers 26,835 27,595 28,438 29,355 30,232 30,878 27,595 30,878 Branded postpaid mobile broadband customers 1,475 1,723 1,965 2,340 2,504 2,748 1,723 2,748 Total branded postpaid customers 28,310 29,318 30,403 31,695 32,736 33,626 29,318 33,626 Branded prepaid customers 16,389 16,567 17,162 17,631 18,438 18,914 16,567 18,914 Total branded customers 44,699 45,885 47,565 49,326 51,174 52,540 45,885 52,540 Wholesale customers 12,137 13,023 13,655 13,956 14,329 14,844 13,023 14,844 Total customers, end of period 56,836 58,908 61,220 63,282 65,503 67,384 58,908 67,384 Quarter Six Months Ended June 30, (in thousands) Q1 2015 Q2 2015 Q3 2015 Q4 2015 Q1 2016 Q2 2016 2015 2016 Net customer additions Branded postpaid phone customers 991 760 843 917 877 646 1,751 1,523 Branded postpaid mobile broadband customers 134 248 242 375 164 244 382 408 Total branded postpaid customers 1,125 1,008 1,085 1,292 1,041 890 2,133 1,931 Branded prepaid customers 73 178 595 469 807 476 251 1,283 Total branded customers 1,198 1,186 1,680 1,761 1,848 1,366 2,384 3,214 Wholesale customers 620 886 632 301 373 515 1,506 888 Total net customer additions 1,818 2,072 2,312 2,062 2,221 1,881 3,890 4,102 Quarter Six Months Ended June 30, Q1 2015 Q2 2015 Q3 2015 Q4 2015 Q1 2016 Q2 2016 2015 2016 Branded postpaid phone churn 1.30% 1.32% 1.46% 1.46% 1.33% 1.27% 1.31% 1.30% Branded prepaid churn 4.62% 4.93% 4.09% 4.20% 3.84% 3.91% 4.78% 3.88%
  • 22. 22 T-Mobile US, Inc. Supplementary Operating and Financial Data (continued) Quarter Six Months Ended June 30, Q1 2015 Q2 2015 Q3 2015 Q4 2015 Q1 2016 Q2 2016 2015 2016 Financial Metrics Service revenues (in millions) $5,819 $6,144 $6,302 $6,556 $6,578 $6,888 $11,963 $13,466 Total revenues (in millions) $7,778 $8,179 $7,849 $8,247 $8,599 $9,222 $15,957 $17,821 Adjusted EBITDA (in millions) $1,388 $1,817 $1,908 $2,280 $2,749 $2,464 $3,205 $5,213 Adjusted EBITDA margin 24% 30% 30% 35% 42% 36% 27% 39% Net income (loss) (in millions) $(63) $361 $138 $297 $479 $225 $298 $704 Cash capex - Property & Equipment (in millions) $982 $1,191 $1,120 $1,431 $1,335 $1,349 $2,173 $2,684 Free Cash Flow (in millions) $(493) $(30) $411 $802 $(310) $419 $(523) $109 Adjusted Free Cash Flow (in millions) $(422) $73 $487 $897 $(247) $485 $(349) $238 Revenue Metrics Branded postpaid phone ARPU $46.43 $48.19 $47.99 $48.05 $46.21 $47.11 $47.33 $46.67 Branded postpaid ABPU $60.94 $63.29 $62.96 $63.74 $61.90 $62.59 $62.14 $62.25 Branded prepaid ARPU $37.81 $37.83 $37.46 $37.63 $37.58 $37.86 $37.82 $37.72 Branded postpaid accounts, end of period (in thousands) 11,831 12,061 12,250 12,456 12,639 12,753 12,061 12,753 Branded postpaid customers per account 2.39 2.43 2.48 2.54 2.59 2.64 2.43 2.64 Device Sales and Leased Devices Smartphone units (in millions) 8.0 7.4 8.1 10.0 8.8 8.1 15.4 16.9 Branded postpaid handset upgrade rate 8% 9% 9% 10% 7% 6% 17% 13% Device Financing EIP financed (in millions) $1,483 $1,697 $1,107 $926 $1,246 $1,562 $3,180 $2,808 EIP billings (in millions) $1,292 $1,393 $1,409 $1,400 $1,324 $1,344 $2,685 $2,668 EIP receivables, net (in millions) $4,842 $5,114 $4,771 $3,225 $3,053 $2,662 $5,114 $2,662 Lease revenues (in millions) $— $— $30 $194 $342 $367 $— $709 Leased devices transferred from inventory to property and equipment, net of returns (in millions) $— $— $822 $1,463 $653 $52 $— $705 Customer Quality EIP receivables classified as prime 52% 52% 52% 48% 47% 42% 52% 42% Total bad debt expense and losses from sales of receivables (in millions) $169 $156 $198 $228 $173 $165 $325 $338
  • 23. 23 T-Mobile US, Inc. Reconciliation of Non-GAAP Financial Measures to GAAP Financial Measures (Unaudited) This Investor Factbook includes non-GAAP financial measures. The non-GAAP financial measures should be considered in addition to, but not as a substitute for, the information provided in accordance with GAAP. Reconciliations for the non-GAAP financial measures to the most directly comparable GAAP financial measures are provided below. As T-Mobile does not or cannot predict or forecast certain of the expenses which are excluded from Adjusted EBITDA, but which would be required for the presentation of projected net income, T-Mobile does not provide projected net income or reconciliations to GAAP in the forward-looking financial measures. Adjusted EBITDA is reconciled to net income (loss) as follows: Quarter Six Months Ended June 30, (in millions) Q1 2015 Q2 2015 Q3 2015 Q4 2015 Q1 2016 Q2 2016 2015 2016 Net income (loss) $ (63) $ 361 $ 138 $ 297 $ 479 $ 225 $ 298 $ 704 Adjustments: Interest expense 261 257 262 305 339 368 518 707 Interest expense to affiliates 64 92 121 134 79 93 156 172 Interest income (112) (114) (109) (85) (68) (68) (226) (136) Other expense (income), net 8 (1) 1 3 2 3 7 5 Income tax expense (benefit) (41) 2 100 184 272 147 (39) 419 Operating income 117 597 513 838 1,103 768 714 1,871 Depreciation and amortization 1,087 1,075 1,157 1,369 1,552 1,575 2,162 3,127 Cost of MetroPCS business combination 128 34 193 21 36 59 162 95 Stock-based compensation (1) 56 71 43 52 53 61 127 114 Other, net — 40 2 — 5 1 40 6 Adjusted EBITDA $ 1,388 $ 1,817 $ 1,908 $ 2,280 $ 2,749 $ 2,464 $ 3,205 $ 5,213 (1) Stock-based compensation includes payroll tax impacts and may not agree to stock-based compensation expense in the condensed consolidated financial statements.
  • 24. 24 T-Mobile US, Inc. Reconciliation of Non-GAAP Financial Measures to GAAP Financial Measures (continued) (Unaudited) The following tables illustrate the calculation of ARPU and ABPU and reconcile these measures to the related service revenues, which we consider to be the most directly comparable GAAP financial measure to ARPU and ABPU: Quarter Six Months Ended June 30, (in millions, except average number of customers, ARPU and ABPU) Q1 2015 Q2 2015 Q3 2015 Q4 2015 Q1 2016 Q2 2016 2015 2016 Calculation of Branded Postpaid Phone ARPU Branded postpaid service revenues $ 3,774 $ 4,075 $ 4,197 $ 4,337 $ 4,302 $ 4,509 $ 7,849 $ 8,811 Less: Branded postpaid mobile broadband revenues (109) (135) (165) (179) (182) (193) (244) (375) Branded postpaid phone service revenues $ 3,665 $ 3,940 $ 4,032 $ 4,158 $ 4,120 $ 4,316 $ 7,605 $ 8,436 Divided by: Average number of branded postpaid phone customers (in thousands) and number of months in period 26,313 27,250 28,003 28,849 29,720 30,537 26,781 30,128 Branded postpaid phone ARPU $ 46.43 $ 48.19 $ 47.99 $ 48.05 $ 46.21 $ 47.11 $ 47.33 $ 46.67 Calculation of Branded Postpaid ABPU Branded postpaid service revenues $ 3,774 $ 4,075 $ 4,197 $ 4,337 $ 4,302 $ 4,509 $ 7,849 $ 8,811 EIP billings 1,292 1,393 1,409 1,400 1,324 1,344 2,685 2,668 Lease revenues — — 30 194 342 367 — 709 Total billings for branded postpaid customers $ 5,066 $ 5,468 $ 5,636 $ 5,931 $ 5,968 $ 6,220 $ 10,534 $ 12,188 Divided by: Average number of branded postpaid customers (in thousands) and number of months in period 27,717 28,797 29,838 31,013 32,140 33,125 28,257 32,633 Branded postpaid ABPU $ 60.94 $ 63.29 $ 62.96 $ 63.74 $ 61.90 $ 62.59 $ 62.14 $ 62.25 Calculation of Branded Prepaid ARPU Branded prepaid service revenues $ 1,842 $ 1,861 $ 1,894 $ 1,956 $ 2,025 $ 2,119 $ 3,703 $ 4,144 Divided by: Average number of branded prepaid customers (in thousands) and number of months in period 16,238 16,396 16,853 17,330 17,962 18,662 16,317 18,312 Branded prepaid ARPU $ 37.81 $ 37.83 $ 37.46 $ 37.63 $ 37.58 $ 37.86 $ 37.82 $ 37.72
  • 25. 25 T-Mobile US, Inc. Reconciliation of Non-GAAP Financial Measures to GAAP Financial Measures (continued) (Unaudited) Net debt (excluding Tower Obligations) to last twelve months adjusted EBITDA ratio is calculated as follows: (in millions, except net debt ratio) Mar 31, 2015 Jun 30, 2015 Sep 30, 2015 Dec 31, 2015 Mar 31, 2016 Jun 30, 2016 Short-term debt $ 467 $ 386 $ 114 $ 182 $ 365 $ 258 Long-term debt to affiliates 5,600 5,600 5,600 5,600 5,600 5,600 Long-term debt (1) 16,248 16,373 16,430 20,461 20,505 21,574 Less: Cash and cash equivalents (3,032) (2,642) (2,633) (4,582) (3,647) (5,538) Less: Short-term investments — — — (2,998) (2,925) — Net Debt (excluding Tower Obligations) $ 19,283 $ 19,717 $ 19,511 $ 18,663 $ 19,898 $ 21,894 Divided by: Last twelve months Adjusted EBITDA $ 5,936 $ 6,302 $ 6,864 $ 7,393 $ 8,754 $ 9,401 Net Debt (excluding Tower Obligations) to Last Twelve Months Adjusted EBITDA Ratio 3.2 3.1 2.8 2.5 2.3 2.3 (1) Long-term debt as of March 31, 2015 through December 31, 2015 has been restated for the adoption of Accounting Standards Update 2015-03, “Simplifying the Presentation of Debt Issuance Costs” in the first quarter of 2016. The impact to the Net Debt (excluding Tower Obligations) to Last Twelve Months Adjusted EBITDA Ratio was not significant. Free cash flow and adjusted free cash flow are calculated as follows: Quarter Six Months Ended June 30, (in millions) Q1 2015 Q2 2015 Q3 2015 Q4 2015 Q1 2016 Q2 2016 2015 2016 Net cash provided by operating activities $ 489 $ 1,161 $ 1,531 $ 2,233 $ 1,025 $ 1,768 $ 1,650 $ 2,793 Cash purchases of property and equipment (982) (1,191) (1,120) (1,431) (1,335) (1,349) (2,173) (2,684) Free Cash Flow (493) (30) 411 802 (310) 419 (523) 109 MetroPCS CDMA network decommissioning payments 71 103 76 95 63 66 174 129 Adjusted Free Cash Flow $ (422) $ 73 $ 487 $ 897 $ (247) $ 485 $ (349) $ 238
  • 26. 26 Definitions of Terms Operating and financial measures are utilized by T-Mobile's management to evaluate its operating performance and, in certain cases, its ability to meet liquidity requirements. Although companies in the wireless industry may not define measures in precisely the same way, T-Mobile believes the measures facilitate key operating performance comparisons with other companies in the wireless industry to provide management, investors and analysts with useful information to assess and evaluate past performance and assist in forecasting future performance. 1. Customer - SIM card with a unique T-Mobile mobile identity number which generates revenue. Branded customers generally include customers that are qualified either for postpaid service, where they generally pay after incurring service, or prepaid service, where they generally pay in advance. Wholesale customers include Machine-to-Machine (M2M) and Mobile Virtual Network Operator (MVNO) customers that operate on T-Mobile's network, but are managed by wholesale partners. 2. Churn - Number of customers whose service was disconnected as a percentage of the average number of customers during the specified period. The number of customers whose service was disconnected is presented net of customers that subsequently have their service restored within a certain period of time. 3. Customers per account - The number of branded postpaid customers as of the end of the period divided by the number of branded postpaid accounts as of the end of the period. An account may include branded postpaid phone and mobile broadband customers. 4. Average Revenue Per User (ARPU) - Average monthly service revenue earned from customers. Service revenues for the specified period divided by the average customers during the period, further divided by the number of months in the period. Branded postpaid phone ARPU excludes mobile broadband customers and related revenues. Average Billings per User (ABPU) - Average monthly branded postpaid service revenue earned from customers plus monthly EIP billings and lease revenues divided by the average branded postpaid customers during the period, further divided by the number of months in the period. T-Mobile believes branded postpaid ABPU is indicative of estimated cash collections, including device financing payments, from T-Mobile's customers each month. Service revenues - Branded postpaid, including handset insurance, branded prepaid, wholesale, and roaming and other service revenues. 5. Cost of services - Costs directly attributable to providing wireless service through the operation of T-Mobile's network, including direct switch and cell site costs, such as rent, network access and transport costs, utilities, maintenance, associated labor costs, long distance costs, regulatory program costs, roaming fees paid to other carriers and data content costs. Cost of equipment sales - Costs of devices and accessories sold to customers and dealers, device costs to fulfill insurance and warranty claims, write-downs of inventory related to shrinkage and obsolescence, and shipping and handling costs. Selling, general and administrative expenses - Costs not directly attributable to providing wireless service for the operation of sales, customer care and corporate activities. These include commissions paid to dealers and retail employees for activations and upgrades, labor and facilities costs associated with retail sales force and administrative space, marketing and promotional costs, customer support and billing, bad debt expense and administrative support activities. 6. Adjusted EBITDA - Earnings before interest expense (net of interest income), tax, depreciation, amortization, stock-based compensation and expenses not reflective of T-Mobile's ongoing operating performance. Adjusted EBITDA margin represents Adjusted EBITDA divided by service revenues. Adjusted EBITDA is a non-GAAP financial measure utilized by T-Mobile's management to monitor the financial performance of its operations. T-Mobile uses Adjusted EBITDA internally as a metric to evaluate and compensate its personnel and management for their performance, and as a benchmark to evaluate T-Mobile's operating performance in comparison to its competitors. Management believes analysts and investors use Adjusted EBITDA as a supplemental measure to evaluate overall operating performance and facilitate comparisons with other wireless communications companies because it is more indicative of T-Mobile's ongoing performance and trends by excluding certain expenses which are either nonrecurring or may not be indicative of T-Mobile's directly controllable operating results. Adjusted EBITDA has limitations as an analytical tool and should not be considered in isolation or as a substitute for income from operations, net income or any other measure of financial performance reported in accordance with GAAP. The reconciliation of Adjusted EBITDA to net income (loss) is detailed in the Reconciliation of Non-GAAP Financial Measures to GAAP Financial Measures schedule. 7. Cash capital expenditures - Amounts paid for construction and the purchase of property and equipment. 8. Smartphones - UMTS/HSPA/HSPA+ 21/HSPA+ 42/4G LTE enabled converged devices, which integrate voice and data services.
  • 27. 27 Definitions of Terms (continued) 9. Free Cash Flow - Net cash provided by operating activities less cash capital expenditures for property and equipment. Free Cash Flow is utilized by T-Mobile's management, investors, and analysts to evaluate cash available to pay debt and provide further investment in the business. The reconciliation of Free Cash Flow to net cash provided by operating activities is detailed in the Reconciliation of Non-GAAP Financial Measures to GAAP Financial Measures schedule. 10. Adjusted Free Cash Flow - Free Cash Flow excluding decommissioning payments related to the shutdown of the CDMA portion of the MetroPCS network. 11. Net debt - Short-term debt, long-term debt to affiliates, and long-term debt (excluding tower obligations), less cash and cash equivalents and short-term investments.
  • 28. 28 Forward-Looking Statements This Investor Factbook includes "forward-looking statements" within the meaning of the U.S. federal securities laws. Any statements made herein that are not statements of historical fact, including statements about T-Mobile US, Inc.'s plans, outlook, beliefs, opinion, projections, guidance, strategy, expected network modernization and other advancements, are forward-looking statements. Generally, forward-looking statements may be identified by words such as "anticipate," "expect," "suggests," "plan," “project,” "believe," "intend," "estimates," "targets," "views," "may," "will," "forecast," and other similar expressions. The forward-looking statements speak only as of the date made, are based on current assumptions and expectations, and involve a number of risks and uncertainties. Important factors that could affect future results and cause those results to differ materially from those expressed in the forward-looking statements include, among others, the following: our ability to compete in the highly competitive U.S. wireless telecommunications industry; adverse conditions in the U.S. and international economies and markets; significant capital commitments and the capital expenditures required to effect our business plan; our ability to adapt to future changes in technology, enhance existing offerings, and introduce new offerings to address customers' changing demands; changes in legal and regulatory requirements, including any change or increase in restrictions on our ability to operate our network; our ability to successfully maintain and improve our network, and the possibility of incurring additional costs in doing so; major equipment failures; severe weather conditions or other force majeure events; and other risks described in our filings with the Securities and Exchange Commission, including those described in our most recently filed Annual Report on Form 10-K. You should not place undue reliance on these forward-looking statements. We do not undertake to update forward-looking statements, whether as a result of new information, future events or otherwise, except as required by law. About T-Mobile US, Inc. As America's Un-carrier, T-Mobile US, Inc. (NASDAQ: TMUS) is redefining the way consumers and businesses buy wireless services through leading product and service innovation. The Company's advanced nationwide 4G LTE network delivers outstanding wireless experiences to 67.4 million customers who are unwilling to compromise on quality and value. Based in Bellevue, Washington, T-Mobile US provides services through its subsidiaries and operates its flagship brands, T-Mobile and MetroPCS. For more information, please visit http://www.T-Mobile.com or join the conversation on Twitter using $TMUS.