SlideShare a Scribd company logo
1 of 12
Download to read offline
Year 2015 2016E 2017E
P/E 39.58 37.38 30.54
PEG 9.40 1.90 1.50
P/Sales 0.99 1.27 1.16
P/FCF 46.09 28.29 16.61
P/Book 1.93 2.60 2.56
December 11, 2016
T-MOBILE US INC - (TMUS)
“Yeah, I Could Hear You the Entire Time”
OUSEMGEQUITYRESEARCH 1
Investment Thesis
T-Mobile US, Inc., offers voice, messaging, and data services in the postpaid,
prepaid, and wholesale markets for customers and businesses in the United
States, Puerto Rico, and the U.S. Virgin Islands.
Thesis Highlights
 Growing LTE Demand in a Growing Data Market
Overall mobile subscriptions are expected to increase from 7.3 billion in 2015 to over
9 billion by 2021, 4.3 billion of which are expected to be LTE based subscriptions.
This is the effects of a shift to more advanced technologies in developed markets
such as Western Europe and North America.
 Branded Segments Outperform With Help From Initiatives
TMUS provides wireless communication services to three primary categories of
customers: branded postpaid, branded prepaid, and wholesale. Due largely in part to
its aggressive pricing model and the success of MetroPCS, T-Mobile is the only
wireless company with positive net growth in both postpaid and prepaid. For Q3 the
postpaid segment of TMUS saw 890,000 net adds versus –185,000 for T, 86,000 for
VZ and 173,000 for sprint. Likewise, its prepaid segment saw growth of 8 percent in
both revenue and customer base YOY in 2015.
 Network Investment and Expansion
TMUS has been investing significantly over the years to enhance its network and
provide faster high-bandwidth mobile communications services. During FY2014 and
FY2015, the company’s capital expenditures for property and equipment related to
network modernization and expansion were $4.5 billion and $4.3 billion respectively.
And for 2016, that number is expected be in the $4.5 billion to $4.8 billion range.
TMUS is also focused on expanding network coverage through an aggressive
spectrum acquisition strategy with multiple acquisitions in 2014, 2015, and 2016.
Thesis Risks
 Net Neutrality
Net neutrality has become an increasingly common buzzword during the last decade,
as digital privacy and service quality issues move into public view. Pricing plans and
data speed have been the main concern for firms in this industry, as changes in
federal regulation could drastically affect the viability of current revenue streams, in
addition to creating new challenges for existing business models. Management has
outlined these new regulations as a significant risk that has yet to fully play out.
Combined with recent rulings from the FCC in February and June, many of these
worst cases scenario risks have been confirmed.
Stock Rating: Buy
Price Target
Current Price
$66.05 (16.4%)
$56.74
Relevant Information
ROE 8.03%
EV/EBITDA 7.55
Current Ratio 1.67
Short Interest 5.96%
Dividend Yield 0.00%
Debt Rating BB
Next Earnings Date 02/22/2017
Analysts Mozika Maloba
Head Analyst
Peter Rousseau
Junior Analyst
Brad Morrissey
Junior Analyst
Collin Patterson
Analyst
Nick Gilkey
Analyst
Company Information
Sector Communications
Industry Telecom
Market Cap $46.75B
Sales $35.31B
Beta 0.78
Price-Based Multiples
$30
$35
$40
$45
$50
$55
$60
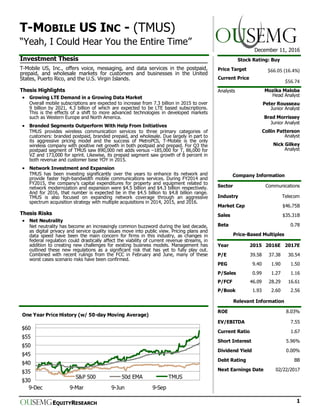
9-Dec 9-Mar 9-Jun 9-Sep
One Year Price History (w/ 50-day Moving Average)
S&P 500 50d EMA TMUS
OUSEMGEQUITYRESEARCH 2
DECEMBER 11, 2016 | T-MOBILE US INC. (TMUS)
Thesis Point 1:
▪ Opportunity For LTE
Market Capitalization
Growing LTE Demand in a Growing Data Market
Opportunity For LTE Market Capitalization
TMUS has a large opportunity to capitalize on the growing demand for LTE/4G
Technology. Overall mobile subscriptions are expected to increase from 7.3 billion in
2015 to over 9 billion in 2021. Of the total mobile subscriptions, LTE based
subscriptions are estimated to be over 4.3 billion by 2021. The shift is mainly due to
substantial migration to more advanced technologies including WCDMA/HSPA and LTE
in developed markets such as Western Europe and North America. Specifically in
North America, overall mobile subscriptions look to sustain a LSD CAGR through 2021.
Substantial growth, however, will be seen in Data Traffic and Total Mobile Traffic,
stemming from an increase use of the smartphone for streaming and Internet
browsing.
As the consumer trends are examined, they tend to favor TMUS. For example, only 23
percent of U.S. consumers have an unlimited data plan; yet the monthly mobile phone
data allowance plans held by domestic customers are shifting to higher GB plans as
data traffic increases. In addition, in an Ericsson analysis, “network measurements on
LTE networks showed significant opportunities for improvement in cell-edge
performance in the U.S.”, essentially meaning that LTE has displayed speeds that are
still below expectations with regards to collaboration services and HD video viewing.
Deloitte supports the Mobile Traffic growth thesis, noting that 72 percent of 18-24
year olds use their mobile phones while watching TV/a film (as well as 74 percent of
25-34 year olds), while in the older demographics that percentage drops down to
30-40.
U.S. and Canada Mobile Projections
2015 2021 CAGR 2015-
Mobile Subscriptions (million) 390 450 2%
Smartphone Subscriptions (million) 280 370 5%
Data Traffic per active smartphone (GB/
month) 3.8 22 35%
Total Mobile Traffic (EB/month) 1.3 8.5 35%
OUSEMGEQUITYRESEARCH 3
DECEMBER 11, 2016 | T-MOBILE US INC. (TMUS)
Branded Segments Outperform With Help From Initiatives
Branded Segments Impressive Performance
T-Mobile’s branded operating segments have significantly outperformed competitors
over roughly the last three years. The postpaid segment which accounts for 51
percent of revenue saw a 13.8 percent increase in revenue in FY15 while the growing
prepaid segment accounting for 24 percent of revenue increased revenue by ~8
percent.
Management announced on September 20th QTD postpaid net phone adds of 753k
with estimates around 814k for the quarter. This compares to leading competitors S,
VZ and T registering roughly 173k, 86k and -185k respectively. Since the second
quarter of 2013 when TMUS began adding postpaid phone subscriptions, they have
captured 90 percent of growth in the industry. Managements release of QTD
performance for prepaid in September net phone adds was 650k with a full quarter
estimate of 715k.
The main focus for the prepaid segment has been on the Metro PCS brand.
Management continues to leverage the recognizable and higher quality prepaid brand
to significantly grow prepaid customer base. Metro PCS achieved 167 percent growth
over the last year in its third full year of operation under TMUS following the
acquisition completion in 2013. Additionally, Metro PCS added more than 476k
customers in 2Q16 due in large to its impressive geographic expansion. TMUS has
been the only wireless company with positive net subscriber growth in both prepaid
and postpaid segments for twelve consecutive quarters. Moving forward under the Un
-carrier initiative, management looks to explore joint distribution between the two
segments to continue to optimize both brands.
Un-carrier Initiative
Launched in 2013, Un-carrier has been TMUS’s radical initiative to drive simplification
and transparency for customers through various promotions and plan benefits. JUMP!
is an offering that allows customers to pay an additional $10-$30 a month that allows
them to upgrade their handset every six months with insurance and extended
warranty. One of the most influential initiatives introduced was Binge On. This
offering made video streaming 3x more efficient for customers while allowing them to
stream programs such as HBO, Hulu, Netflix, and WatchESPN for free. Over 99
percent of customers kept Binge On activated with their plans when introduced and
has significantly increased customer video consumption. The success of Binge On led
to the development and implementation of T-Mobile ONE, TMUS’s sole postpaid plan
offering moving forward. Launched in September, this plan provides unlimited talk,
text, 4G LTE, and video and music streaming at a more affordable price. For one line
this plan is $70, to add a second line it is $50, and for all lines beyond that it is $20.
T-Mobile ONE has created significant differentiation from competitors and provided a
strong runway for outperformance over the investment horizon. TMUS’s network
capacity allows them to be the only major carrier capable of implementing this
unlimited strategy for all customers while increasing quality globally, benefiting the
network, and increasing ARPU. Due to the 480p resolution video streaming limit,
TMUS has cut existing data consumption by 50 percent and directed customers away
from HD streaming. As this strategy is fully rolled out, TMUS will see significant upside
as results continue to distance themselves from overcrowded network providers such
as Verizon and AT&T.
Thesis Point 2:
▪ Continued outperformance
in net adds
▪ Un-Carrier initiative
OUSEMGEQUITYRESEARCH 4
DECEMBER 11, 2016 | T-MOBILE US INC. (TMUS)
Network Investment and Expansion
Expansive Network in the U.S.
T-Mobile has had the fastest 4G LTE Network for the past two and a half years, and
on August 4, 2016, Nielsen Mobile Insights released results from a survey placing
TMUS at the top for customer sentiment. TMUS uses mid-band spectrum licenses
such as Advanced Wireless Services and Personal Communications Services, and low-
band spectrum licenses which utilizes its 700 MHz A-Block spectrum. On its 700 MHz
A-Block Spectrum, TMUS is able to deploy its Extended Range LTE which is able to
reach twice the distance and work four times faster in buildings on average than its
regular LTE signal. This upgraded LTE service currently covers 190 million people in
over 300 market areas. TMUS’s LTE service as a whole has had a YOY growth of 40
million customers from 2014 to 2015, bringing its coverage to 305 million people, and
its nationwide network covers 91 percent of people in the U.S.
The Growing Process of the TMUS LTE Network
TMUS has also been investing significantly over the past couple of years into
enhancing its network to provide higher-bandwidth mobile communications services.
These past investments have been made primarily to support the growth of LTE and
have therefore focused on the use of a strategy focused on modernizing its network
and 4G evolutions. In 2014, TMUS acquired multiple spectrum licenses in 19 markets
from Verizon Wireless for 700 MHz A-Block Advanced Wireless Service (AWS) and
Personal Communications Services (PCS), costing it $2.4 billion. Along with this, TMUS
also acquired AWS spectrum licenses that covered 97 million people. TMUS continued
to invest in its network throughout 2015 by entering into multiple agreements with
Verizon (VZ) and AT&T (T) for the exchange of additional AWS and PCS spectrum
licenses. TMUS plans to continue to invest into 2016 as well with an increase of $300
million in the range of capital expenditures for property and equipment from FY2015,
but its past investments have already put TMUS next to its competitors in LTE
coverage.
TMUS is currently the nation’s third-largest wireless carrier with around 68 million
customers. However, Its LTE network covers nearly 312 million POPs, which is higher
than T’s roughly 300 million POPs and right alongside VZ’s 312 million POPs. Now
TMUS is able to focus on the development of its network so that it can cover patchy
areas and enable high-speed LTE connections across its entire network. TMUS
primarily works on its AWS-1 and 700 MHz licenses, but it spent around $1.8 billion
on AWS-3 spectrum licenses, and has said it could start building out those licenses as
early as this year.
The Federal Communications Commission's Auction
T-Mobile has had the fastest 4G LTE Network for the past two and a half years, and
on August 4, 2016, Nielsen Mobile Insights released results from a survey placing
TMUS at the top for customer sentiment. TMUS uses mid-band spectrum licenses
such as Advanced Wireless Services and Personal Communications Services, and low-
band spectrum licenses which utilizes its 700 MHz A-Block spectrum. On its 700 MHz
A-Block Spectrum, TMUS is able to deploy its Extended Range LTE which is able to
reach twice the distance and work four times faster in buildings on average than its
regular LTE signal. This upgraded LTE service currently covers 190 million people in
over 300 market areas. TMUS’s LTE service as a whole has had a YOY growth of 40
million customers from 2014 to 2015, bringing its coverage to 305 million people, and
its nationwide network covers 91 percent of people in the U.S.
Thesis Point 3:
▪ Expansive Network in the
U.S.
▪ The Growing Process of
the TMUS LTE Network
▪ The FCC’s Auction
OUSEMGEQUITYRESEARCH 5
DECEMBER 11, 2016 | T-MOBILE US INC. (TMUS)
Net Neutrality
Service As a Utility
Management notes that they have yet to fully experience the anticipated downside
from the reclassification of their services as publicly necessary utilities, similar to
bussing, airlines, and telephone lines. The FCC intends to redefine wireless service
providers as Title 2 utilities, which would greatly increase their regulation from state
and local governments. By viewing these services as public goods instead of luxuries,
the FCC has indicated that customers should have easier access to these services, and
at a price that everyone can pay. Monopolies and collaborative agreements between
firms will also be more closely monitored by a wider variety of regulatory authorities,
further benefiting the consumer.
Defining Data
New contracts will require greater transparency and scrutiny from authorities before
being put in place, while existing plans will benefit from being grandfathered in with
less strict regulations. For TMUS, current pricing plans are well-established and should
fare better than its competitors, which have been relatively slow to adapt pricing
around data. The quality of service these contracts provide will also be homogenized,
eliminating data-throttling and fast lanes. This will eliminate partnership opportunities
for third parties who may wish to speed up their service for certain customers. This
has been a focal point of recent controversy, as Netflix and other streaming services
require significant amounts of high speed data, and are willing to pay extra to
guarantee a high quality service for their customers. Companies have employed data
throttling on customers using significant amounts of data, restricting the available
streaming speed regardless of their contract. This has led many firms to redefine
unlimited data according to their personal preference, and even to claim that
customers don’t need or want such unlimited services.
Thesis Risk 1:
▪ Service As a Utility
▪ Defining Data
OUSEMGEQUITYRESEARCH6
T-MOBILEUSINC.(TMUS)
INCOMESTATEMENT
IncomeStatement
FQ32016CommonSizedFQ22016CommonSizedFQ12016CommonSizedFY12015CommonSizedFY12014CommonSizedFY12013CommonSized
Revenue9,246.00$1.009,222.00$1.008,599.00$1.0032,053.00$1.0029,564.00$1.0024,420.00$1.00
CostofRevenue3,975.000.434,048.000.443,795.000.4414,898.000.4615,409.000.5212,255.000.50
GrossProfit5,271.000.575,174.000.564,804.000.5617,155.000.5414,155.000.4812,165.000.50
OperatingExpenses4,282.000.464,406.000.483,701.000.4315,090.000.4712,739.000.4311,171.000.46
OperatingIncome989.000.11768.000.081,103.000.132,065.000.061,416.000.05996.000.04
InterestExpense452.000.05461.000.05418.000.051,496.000.051,351.000.051,223.000.05
PretaxIncome598.000.06372.000.04751.000.09978.000.03413.000.0151.000.00
IncomeTaxExpense232.000.03147.000.02272.000.03245.000.01166.000.0116.000.00
IncomeBeforeXOItems366.000.04225.000.02479.000.06733.000.02247.000.0135.000.00
ExtraordinaryLossNetofTax0.000.000.000.000.000.000.000.000.000.000.000.00
MinorityInterests0.000.000.000.000.000.000.000.000.000.000.000.00
NetIncome366.00$0.04225.00$0.02479.00$0.06733.00$0.02247.00$0.0135.00$0.00
OUSEMGEQUITYRESEARCH7
T-MOBILEUSINC.(TMUS)
BALANCESHEET
BalanceSheet
FQ32016CommonSizedFQ22016CommonSizedFQ12016CommonSizedFY12015CommonSizedFY12014CommonSizedFY12013CommonSized
Cash&NearCashItems5,352.00$0.085,538.00$0.093,647.00$0.064,582.00$0.075,315.00$0.095,891.00$0.12
Short-TermInvestments0.000.000.000.002925.000.052998.000.050.000.000.000.00
Accounts&NotesReceivable1885.000.031866.000.031880.000.031788.000.031865.000.033619.000.07
Inventories1039.000.021388.000.021443.000.021295.000.021085.000.02586.000.01
OtherCurrentAssets5254.000.085488.000.093449.000.054227.000.075719.000.102132.000.04
TotalCurrentAssets13530.000.2114280.000.2213344.000.2114890.000.2413984.000.2512228.000.24
LTInvestments&LTReceivables0.000.000.000.000.000.000.000.000.000.000.000.00
GrossFixedAssets#N/AN/A#VALUE!#N/AN/A#VALUE!#N/AN/A#VALUE!43192.000.6938036.000.6734998.000.70
AccumulatedDepreciation#N/AN/A#VALUE!#N/AN/A#VALUE!#N/AN/A#VALUE!23192.000.3721791.000.3819649.000.39
NetFixedAssets20574.000.3220570.000.3220625.000.3320000.000.3216245.000.2915349.000.31
OtherLong-TermAssets30168.000.4729118.000.4629094.000.4627546.000.4426424.000.4722376.000.45
TotalLong-TermAssets50742.000.7949688.000.7849719.000.7947546.000.7642669.000.7537725.000.76
TotalAssets64272.001.0063968.001.0063063.001.0062436.001.0056653.001.0049953.001.00
AccountsPayable#N/AN/A#VALUE!#N/AN/A#VALUE!#N/AN/A#VALUE!6137.000.105322.000.094567.000.09
Short-TermBorrowings325.000.01258.000.00365.000.01182.000.0087.000.00244.000.00
OtherShort-TermLiabilities7794.000.128494.000.139004.000.143209.000.053367.000.06997.000.02
TotalCurrentLiabilities8119.000.138752.000.149369.000.159528.000.158776.000.155808.000.12
Long-TermBorrowings30054.000.4729808.000.4728745.000.4628742.000.4624394.000.4322441.000.45
OtherLong-TermLiabilities8246.000.138013.000.137845.000.127609.000.127820.000.147459.000.15
TotalLong-TermLiabilities38300.000.6037821.000.5936590.000.5836351.000.5832214.000.5729900.000.60
TotalLiabilities46419.000.7246573.000.7345959.000.7345879.000.7340990.000.7235708.000.71
TotalPreferredEquity0.000.000.000.000.000.000.000.000.000.000.000.00
MinorityInterest0.000.000.000.000.000.000.000.000.000.000.000.00
ShareCapital&APIC38853.000.6038763.000.6138700.000.6138666.000.6238503.000.6837330.000.75
RetainedEarnings&OtherEquity(21000.00)(0.33)(21368.00)(0.33)(21596.00)(0.34)(22109.00)(0.35)(22840.00)(0.40)(23085.00)(0.46)
TotalEquity17853.000.2817395.000.2717104.000.2716557.000.2715663.000.2814245.000.29
TotalLiabilities&Equity64,272.00$1.0063,968.00$1.0063,063.00$1.0062,436.00$1.0056,653.00$1.0049,953.00$1.00
OUSEMGEQUITYRESEARCH8
T-MOBILEUSINC.(TMUS)
STATEMENTOFCASHFLOWS
CashFlowStatement
FQ32016CommonSizedFQ22016CommonSizedFQ12016CommonSizedFY12015CommonSizedFY12014CommonSizedFY12013CommonSized
NetIncome366.00$1.00225.00$1.00479.00$1.00733.00$1.00247.00$1.0035.00$1.00
Depreciation&Amortization1568.004.281575.007.001552.003.244688.006.404412.0017.863627.00103.63
OtherNon-CashAdjustments303.000.83276.001.23468.000.982239.003.05(2115.00)(8.56)545.0015.57
ChangesinNon-CashCapital(497.00)(1.36)(308.00)(1.37)(1474.00)(3.08)(2246.00)(3.06)1602.006.49(662.00)(18.91)
CashFromOperations1740.004.751768.007.861025.002.145414.007.394146.0016.793545.00101.29
DisposalofFixedAssets0.000.000.000.000.000.000.000.0020.000.083.000.09
CapitalExpenditures(1159.00)(3.17)(1349.00)(6.00)(1335.00)(2.79)(4724.00)(6.44)(4317.00)(17.48)(4025.00)(115.00)
IncreaseinInvestments0.000.000.000.000.000.000.000.000.000.000.000.00
DecreaseinInvestments0.000.000.000.000.000.000.000.000.000.000.000.00
OtherInvestingActivities(700.00)(1.91)682.003.03(525.00)(1.10)(4836.00)(6.60)(2949.00)(11.94)1930.0055.14
CashFromInvestingActivities(1859.00)(5.08)(667.00)(2.96)(1860.00)(3.88)(9560.00)(13.04)(7246.00)(29.34)(2092.00)(59.77)
DividendsPaid(13.00)(0.04)(14.00)(0.06)(14.00)(0.03)(55.00)(0.08)0.000.000.000.00
ChangeinShort-TermBorrowings0.000.00(150.00)(0.67)0.000.00(564.00)(0.77)(418.00)(1.69)(244.00)(6.97)
IncreaseinLong-TermBorrowings0.000.00997.004.430.000.003979.005.432993.0012.122494.0071.26
DecreaseinLong-termBorrowings(59.00)(0.16)(48.00)(0.21)(41.00)(0.09)(57.00)(0.08)(1019.00)(4.13)(9.00)(0.26)
IncreaseinCapitalStocks0.000.000.000.000.000.0047.000.061043.004.221924.0054.97
DecreaseinCapitalStocks0.000.000.000.000.000.000.000.000.000.000.000.00
OtherFinancingActivities5.000.015.000.02(45.00)(0.09)63.000.09(75.00)(0.30)(121.00)(3.46)
CashfromFinancingActivities(67.00)(0.18)790.003.51(100.00)(0.21)3413.004.662524.0010.224044.00115.54
NetChangesinCash(186.00)$(0.51)1,891.00$8.40(935.00)$-1.95(733.00)$-1.00(576.00)$-2.335,497.00$157.06
OUSEMGEQUITYRESEARCH9
T-MOBILEUSINC.(TMUS)
COMPARABLEANALYSIS
RELATIVEVALUATION
T-MobileUS,Inc.PublicComparableCompanies
ControlFirmCurrentPriceMarketValue1
MarketWeightings5-YearTTMNTM5-YearTTMNTM5-YearTTMNTM5-YearTTMNTM
T-MobileUS,Inc.$58.55$48,246.149.7%1.41x2.11x1.77x5.89x9.14x6.49x17.61x32.32x16.86x2.20x2.83x2.22x
Telecommunications
SprintCorp.$8.74$34,796.3141.4%1.59x2.03x1.97x7.18x8.00x6.16x81.76x210.25x27.11x3.51x3.86x2.98x
AT&TInc.$40.41$248,157.817.4%2.05x2.51x2.19x6.23x7.77x6.63x11.15x14.90x12.71x1.85x2.55x2.12x
VerizonCommunicationsInc.$51.13$208,438.310.6%1.89x2.40x2.43x5.34x6.74x6.65x8.16x9.53x10.24x1.62x2.26x2.11x
Mean2
1.95x2.43x2.27x5.92x7.35x6.61x14.88x26.45x12.68x1.87x2.52x2.18x
Median1.89x2.40x2.19x6.23x7.77x6.63x11.15x14.90x12.71x1.85x2.55x2.12x
Premium/Discount3
(0.54x)(0.32x)(0.50x)(0.03x)1.79x(0.12x)2.72x5.87x4.18x0.33x0.31x0.04x
1)inmillions
2)Market-valueweightedaverage
3)Premium/Discounttothemarket-valueweightedaverage
YTD
Performance
RevenueEBITDAEBITDA
NetDebtasaMultipleof:
EBIT
EnterpriseValueasaMutlipleof:
ControlFirmCurrentPriceMarketValue1
5-YearTTMNTM5-YearTTMNTM5-YearTTMNTM5-YearTTMNTM
T-MobileUS,Inc.$58.55$48,246.151.1%0.90x1.46x1.17x30.94x69.20x31.27x33.02x39.77x15.11x1.59x2.81x2.56x
Telecommunications
SprintCorp.$8.74$34,796.3(0.2%)0.66x1.05x1.02x301.52x----128.91x----1.38x1.70x1.75x
AT&TInc.$40.41$248,157.83.4%1.44x1.69x1.49x12.81x14.90x13.61x13.24x13.64x13.02x1.92x1.90x1.97x
VerizonCommunicationsInc.$51.13$208,438.34.3%1.31x1.59x1.66x12.85x12.90x12.83x10.26x10.07x11.78x7.55x13.04x7.13x
Mean2
1.33x1.60x1.53x33.27x13.00x12.32x20.16x11.16x11.57x4.27x6.61x4.14x
Median1.31x1.59x1.49x12.85x13.90x13.22x13.24x11.86x12.40x1.92x1.90x1.97x
Premium/Discount3
(0.43x)(0.15x)(0.36x)(2.33x)56.20x18.96x12.86x28.61x3.54x(2.68x)(3.80x)(1.58x)
5-YearEPS
CAGR
RevenueEarningsFreeCashFlowBookValue
PriceasaMutlipleof:
1)inmillions
2)Market-valueweightedaverage
3)Premium/Discounttothemarket-valueweightedaverage
EnterpriseValuetoSalesMultipleAnalysisEnterpriseValuetoSalesMultipleAnalysis
10%ReductionEV/Sales10%Expansion10%ReductionEV/Sales10%Expansion
1.9x2.1x2.3x2.2x2.4x2.7x
10%Reduction$40.37$50.75$59.27$67.8010%Reduction$40.37$62.31$72.12$81.93
2016ESales$44.85$59.27$68.74$78.212016ESales$44.85$72.12$83.02$93.91
10%Expansion$49.34$67.80$78.21$88.6310%Expansion$49.34$81.93$93.91$105.90
PricetoBookValueMultipleAnalysisPricetoBookValueMultipleAnalysis
10%ReductionP/B10%Expansion10%ReductionP/B10%Expansion
2.5x2.8x3.1x5.9x6.6x7.3x
10%Reduction$19.67$49.77$55.30$60.8410%Reduction$19.67$117.03$130.03$143.04
2016EBookValue$21.86$55.30$61.45$67.592016EBookValue$21.86$130.03$144.48$158.93
10%Expansion$24.04$60.84$67.59$74.3510%Expansion$24.04$143.04$158.93$174.82
OUSEMGEQUITYRESEARCH
T-MOBILEUSINC.(TMUS)
COMPARABLEANALYSIS
ANALYSISOFCOMPS
OnanEV/Sales,Price/Sales,andPrice/Bookmultiplebasis,TMUSistradingatadiscountcomparedtoitsmaincompetitorsSprint,Verizon,andAT&T.Thisis
duelargelyinparttoitsboostsincustomeraddsinthelastyear.Sprint(S)hashadnegativeearningsforthelast4earningscalls,buthasbeenincreasingits
EPSwitheverycallfrom–0.21inQ415to–.04inQ316.Ifitisabletocontinuethistrend,SprintwillseeapositiveEPSin2017.Betweenthethree,Sprint
arguablyhasthemostroomtogrow,buttheyposenothreatastheirnetaddshavebeenconsistentlypoorincomparisontoT-Mobile,Verizon,andAT&T.
AssetsEquityCapital
ControlFirmCurrentPriceMarketValue1
5-YearTTMNTM5-YearTTMNTM5-YearTTMNTMTTMTTMTTM
T-MobileUS,Inc.$58.55$48,246.19.1%51.43%53.52%57.34%9.68%6.53%10.52%3.82%2.29%3.82%1.17%4.06%1.67%
Telecommunications
SprintCorp.$8.74$34,796.31.5%48.59%52.66%55.88%4.70%0.96%7.28%(2.43%)(6.20%)(0.64%)(2.53%)#####(3.70%)
AT&TInc.$40.41$248,157.81.7%52.24%46.59%49.41%18.61%16.87%17.20%10.55%9.00%9.42%3.29%12.75%5.29%
VerizonCommunicationsInc.$51.13$208,438.30.7%62.13%60.16%59.46%22.88%25.16%23.69%10.91%12.41%12.95%6.67%101.04%12.90%
Mean2
54.32%53.13%54.92%15.40%14.33%16.06%6.34%5.07%7.24%2.48%34.58%4.83%
Median52.24%52.66%55.88%18.61%16.87%17.20%10.55%9.00%9.42%3.29%12.75%5.29%
Premium/Discount3
(2.89%)0.39%2.43%(5.72%)(7.80%)(5.54%)(2.53%)(2.78%)(3.42%)(1.31%)#####(3.16%)
ReturnOnOperatingMetrics
GrossMarginEBITMarginNetMargin
1)inmillions
2)Absoluteaverage3)
Premium/Discounttotheabsoluteaverage
16'-17'
Revenue
Growth
OUSEMGEQUITYRESEARCH11
T-MOBILEUSINC.(TMUS)
DISCOUNTEDCASHFLOW
T-MobileUS,Inc.DiscountedCashFlow
CAGRCAGR
201120122013201420152016E2017E2018E2019E2020E2021EAssumptionsRiskFreeRate2.41%
Revenue$4,847.4$5,101.3$24,420.0$29,564.0$32,053.045.9%$36,893.0$40,582.3$43,423.1$47,070.6$49,612.4$50,604.75.4%Beta0.78
%YoYGrowth19.1%5.2%378.7%21.1%8.4%15.1%10.0%7.0%8.4%5.4%2.0%ExpectedMarketReturn10.00%
(-)CostofGoodsSold3,452.33,571.515,882.020,084.019,962.022,476.223,930.024,316.926,359.527,783.028,338.6CostofEquity8.33%
%ofRevenue71.2%70.0%65.0%67.9%62.3%60.9%59.0%56.0%56.0%56.0%56.0%TotalDebt28,924.0
GrossProfit$1,395.1$1,529.8$8,538.0$9,480.0$12,091.054.0%$14,416.8$16,652.3$19,106.1$20,711.1$21,829.5$22,266.17.5%TaxRate25.05%
%Margin28.8%30.0%35.0%32.1%37.7%39.1%41.0%44.0%44.0%44.0%44.0%CostofDebt4.09%
%YoYGrowth7.2%9.7%458.1%11.0%27.5%19.2%15.5%14.7%8.4%5.4%2.0%DebtCapitalization63.60%
(-)OperatingExpenditures644.0696.87,382.08,863.010,189.010,699.012,377.613,461.214,591.915,379.816,193.5EquityCapitalization36.40%
%ofRevenue13.3%13.7%30.2%30.0%31.8%29.0%30.5%31.0%31.0%31.0%32.0%TaxRate25.05%
%YoYGrowth3.6%8.2%959.4%20.1%15.0%5.0%15.7%8.8%8.4%5.4%5.3%WACC6.32%
OperatingIncome$751.2$833.0$1,156.0$617.0$1,902.020.4%$3,717.9$4,274.7$5,645.0$6,119.2$6,449.6$6,072.68.5%
%Margin15.5%16.3%4.7%2.1%5.9%10.1%10.5%13.0%13.0%13.0%12.0%
%YoYGrowth10.5%10.9%38.8%(46.6%)208.3%95.5%15.0%32.1%8.4%5.4%(5.8%)CumulativeValueofFCF$15,156.3
(-)InterestExpense263.0277.91,289.01,450.01,578.01,699.01,905.41,742.41,856.01,855.01,855.0TerminalYearFCF$3,557.6
TaxableIncome$488.2$555.1-$133.0-$833.0$324.0(7.9%)$2,018.8$2,369.3$3,902.6$4,263.2$4,594.6$4,217.613.1%TerminalGrowthRate2.00%
%Margin10.1%10.9%-0.5%-2.8%1.0%5.5%5.8%9.0%9.1%9.3%8.3%CapitalizaitonRate4.32%
(-)Taxes178.3213.316.0166.0245.0802.7990.61,424.01,569.01,733.31,749.4FVofEnterpriseValue$82,350.8
%TaxRate36.5%38.4%-12.0%-19.9%75.6%39.8%41.8%36.5%36.8%37.7%41.5%DiscountFactor0.736
NOPAT$309.9$341.8-$149.0($999.0)$79.0(23.9%)$1,216.1$1,378.6$2,478.6$2,694.2$2,861.3$2,468.212.5%PVofEnterpriseValue$75,773.10
%Margin6.4%6.7%-0.6%-3.4%0.2%3.3%3.4%5.7%5.7%5.8%4.9%(-)Debt$28,924.0
%YoYGrowth2.5%10.3%(143.6%)570.5%(107.9%)1,439.4%13.4%79.8%8.7%6.2%(13.7%)(-)PreferredStock0.0
(+)D&A544.1648.13,642.04,675.05,064.06,283.36,646.86,881.26,516.16,835.77,055.0(-)MinorityInterest0.0
%ofRevenue11.2%12.7%14.9%15.8%15.8%17.0%16.4%15.8%13.8%13.8%13.9%(+)Cash&Equivalents$7,580.0
(+)Non-CashExpenses1,356.3624.14,591.72,158.02,360.0(1,449.4)1,512.42,435.12,013.32,976.73,036.30.060ImpliedEquityValue$54,429.10
%ofRevenue28.0%12.2%18.8%7.3%7.4%(3.9%)3.7%5.6%4.3%6.0%6.0%CurrentSharesOutstanding824.0
(-)CapitalExpenditures956.0869.04,406.07,217.06,659.04,770.65,161.05,453.35,765.46,003.36,325.6ImpliedSharePrice$66.05
%ofRevenue19.7%17.0%18.0%24.4%20.8%12.9%12.7%12.6%12.2%12.1%12.5%CurrentSharePrice$56.74
%YoYGrowth19.6%(9.1%)407.0%63.8%(7.7%)(28.4%)8.2%5.7%5.7%4.1%5.4%Upside/Downside16.4%
CurrentAssets2,668.63,109.112,228.013,984.014,890.013,808.315,638.819,109.022,490.127,071.828,988.9
%ofRevenue55.1%60.9%50.1%47.3%46.5%37.4%38.5%44.0%47.8%54.6%57.3%
%YoYGrowth76.7%16.5%293.3%14.4%6.5%(7.3%)13.3%22.2%17.7%20.4%7.1%
CurrentLiabilities816.7847.85,808.08,776.09,528.09,385.510,314.012,051.714,661.015,478.614,719.4
%ofRevenue16.8%16.6%23.8%29.7%29.7%25.4%25.4%27.8%31.1%31.2%29.1%
%YoYGrowth1.8%3.8%585.1%51.1%8.6%(1.5%)9.9%16.8%21.7%5.6%(4.9%)
(-)ChangesinNWC1,143.9409.44,158.7(1,212.0)154.0(939.3)902.01,732.6771.73,764.12,676.3
%ofRevenue23.6%8.0%17.0%(4.1%)0.5%(2.5%)2.2%4.0%1.6%7.6%5.3%
FreeCashFlow110.2335.6(480.0)(171.0)690.044.3%2,218.73,474.94,609.04,686.52,906.43,557.68.2%CurrentEnterpriseValue$53,524.8
0.0601.0001.0001.0001.0000.940CurrentEBITDA$6,966.0
0.9410.8850.8320.7830.7360.692CurrentEV/EBITDA7.7x
PresentValueofFCF$125.8$3,074.0$3,835.0$3,667.7$2,139.3$2,314.562.5%
ImpliedEnterpriseValue$60,616.8
EBITDA$1,295.2$1,481.1$4,798.0$5,292.0$6,966.040.0%$10,001.2$10,921.5$12,526.2$12,635.3$13,285.4$13,127.54.6%ImpliedEBITDA$13,127.5
%Margin26.7%29.0%19.6%17.9%21.7%27.1%26.9%28.8%26.8%26.8%25.9%ImpliedEV/EBITDA4.6x
%YoYGrowth14.3%14.3%224.0%10.3%31.6%43.6%9.2%14.7%0.9%5.1%(1.2%)
ConversionRate8.5%22.7%(10.0%)(3.2%)9.9%22.2%31.8%36.8%37.1%21.9%27.1%
CustomFCF
PresentValueFactor
TimeWeightedFactor
DiscountedCashFlowCharacteristics
WeightedAverageCostofCapital
ExitMultiples
HistoricalDataProjectionPeriod
CustomRevenue
CustomCOGS
CustomOPEX
CustomTax
CustomD&A
CustomNon-Cash
CustomCAPEX
CustomAssets
CustomLiabilities
∆1.62x2.62x3.62x4.62x5.62x6.62x-1.0%0.0%1.0%2.0%3.0%4.0%5.0%
(9%)$11,946-$2.45$12.04$26.54$41.04$55.54$70.033.32%$261.09$264.68$268.27$271.86$275.45$279.05$282.64
(6%)$12,340-$1.68$13.30$28.27$43.25$58.22$73.204.32%$138.25$140.22$142.18$144.14$146.11$148.07$150.03
(3%)$12,734-$0.91$14.55$30.00$45.45$60.91$76.365.32%$89.39$90.71$92.03$93.35$94.67$95.99$97.31
0%$13,128-$0.13$15.80$31.73$47.66$63.59$79.526.32%$63.12$64.10$65.08$66.05$67.03$68.01$68.99
+3%$13,521$0.64$17.05$33.46$49.87$66.28$82.697.32%$46.72$47.48$48.25$49.01$49.78$50.54$51.31
+6%$13,915$1.41$18.30$35.19$52.07$68.96$85.858.32%$35.49$36.11$36.74$37.36$37.98$38.60$39.22
+9%$14,309$2.19$19.55$36.92$54.28$71.65$89.019.32%$27.32$27.84$28.36$28.88$29.40$29.92$30.44
CostofCapital
ImpliedSharePrice
TerminalYearSalesGrowth
ImpliedSharePrice
EBITDAMultiple
OUSEMGEQUITYRESEARCH12
T-MOBILEUSINC.(TMUS)
ANNOTATEDSTOCKCHART
0202
1
Series
1
30.23
35.23
40.23
45.23
50.23
55.23
60.23
0.00.00.00.00.00.00.00.00.00.00.00.00.00.00.00.00.00.00.00.00.00.00.00.00.00.00.00.00.00.00.00.00.00.00.00.00.00.00.00.00.00.00.00.00.00.00.00.00.00.00.00.00.00.00.00.00.00.00.00.00.00.00.00.00.00.00.00.00.00.00.00.00.00.00.00.00.00.00.00.00.00.00.00.00.00.00.00.00.00.00.00.00.00.00.00.00.00.00.00.00.00.00.00.00.00.00.00.00.00.00.00.00.00.00.00.00.00.10.10.10.10.10.10.10.10.10.10.10.10.10.10.10.10.10.10.10.10.10.10.10.10.10.10.10.10.10.10.10.10.10.10.10.10.10.10.10.10.10.10.10.10.10.10.10.10.10.10.10.10.10.10.10.10.10.10.10.10.10.10.10.10.10.10.10.10.10.10.10.10.10.10.10.10.10.10.10.10.10.10.10.10.10.10.10.10.10.10.10.10.10.10.10.10.10.10.10.10.10.10.10.10.10.10.10.10.10.10.10.10.10.10.10.10.10.10.10.10.10.10.10.10.10.10.10.10.10.10.10.10.10.10.10.10.10.10.10.10.10.10.10.10.10.10.10.10.10.10.10.10.10.10.10.10.10.10.10.10.10.10.10.10.10.10.10.10.10.10.10.10.10.10.10.10.10.10.10.10.10.10.10.10.10.10.10.10.10.10.10.10.10.10.10.10.10.10.10.10.10.10.10.10.10.10.10.10.10.10.10.10.10.10.10.10.10.10.10.10.10.10.10.10.10.10.10.10.10.10.10.10.20.20.20.20.20.20.20.20.20.20.20.20.20.20.20.20.20.20.20.20.20.20.20.20.20.20.20.20.20.20.20.20.20.20.20.20.20.20.20.20.20.20.20.20.20.20.20.20.20.20.20.20.20.20.20.20.20.20.20.20.20.20.20.20.20.20.20.20.20.20.20.20.20.20.20.20.20.20.20.20.20.20.20.20.20.20.20.20.20.20.20.20.20.20.20.20.20.20.20.20.20.20.20.20.20.20.20.20.20.20.20.20.20.20.20.20.20.20.20.20.20.20.20.20.20.20.20.20.20.20.20.20.20.20.20.20.20.20.20.20.20.20.20.20.20.20.20.20.20.20.20.2
8-Dec22-Jan7-Mar19-Apr1-Jun14-Jul25-Aug7-Oct18-Nov
30
35
40
45
50
55
60
8-Dec8-Jan8-Feb8-Mar8-Apr8-May8-Jun8-Jul8-Aug8-Sep8-Oct8-Nov8-Dec
iPhone7orderatT-Mobile
andSprintjumpoverealrier
models
Earnings
EPS:0.165
Estimate:0.178
Earnings
EPS:0.27
Estimate:0.23
Earnings
EPS:0.560
Estimate:0.093
TalksofsSprintand
T-Mobilemergerriseonce
again
Earnings
EPS:0.250
Estimate:0.214

More Related Content

What's hot

Ofcom - The Communications Market in UK 2009
Ofcom - The Communications Market in UK 2009Ofcom - The Communications Market in UK 2009
Ofcom - The Communications Market in UK 2009Subrahmanyam KVJ
 
Yet another metamorphosis for gcc telecom operators
Yet another metamorphosis for gcc telecom operatorsYet another metamorphosis for gcc telecom operators
Yet another metamorphosis for gcc telecom operatorssharingpublications
 
Impact of Over the Top (OTT) Services on Telecom
Impact of Over the Top (OTT) Services on TelecomImpact of Over the Top (OTT) Services on Telecom
Impact of Over the Top (OTT) Services on TelecomTanu Dewan
 
Ericsson Traffic and Market Report- June 2012
Ericsson Traffic and Market Report- June 2012Ericsson Traffic and Market Report- June 2012
Ericsson Traffic and Market Report- June 2012Ericsson Slides
 
World Class Benchmarking: PLDT Inc (TEL PM)
World Class Benchmarking: PLDT Inc (TEL PM)World Class Benchmarking: PLDT Inc (TEL PM)
World Class Benchmarking: PLDT Inc (TEL PM)Andrew Stotz, PhD, CFA
 
Content for-all-the-potential-for-lte-broadcast-embms-white-paper
Content for-all-the-potential-for-lte-broadcast-embms-white-paperContent for-all-the-potential-for-lte-broadcast-embms-white-paper
Content for-all-the-potential-for-lte-broadcast-embms-white-paperKamal Kishor Pandey
 
Wireless advertising messaging legal analysis & public policy issues, a review
Wireless advertising messaging legal analysis & public policy issues, a reviewWireless advertising messaging legal analysis & public policy issues, a review
Wireless advertising messaging legal analysis & public policy issues, a reviewAndrew Olsen
 
White paper: Closing the mobile data revenue gap (2010)
White paper: Closing the mobile data revenue gap (2010)White paper: Closing the mobile data revenue gap (2010)
White paper: Closing the mobile data revenue gap (2010)Corine Suscens
 
Reducing the cost per gigabyte - a 3d b consult white paper
Reducing the cost per gigabyte - a 3d b consult white paperReducing the cost per gigabyte - a 3d b consult white paper
Reducing the cost per gigabyte - a 3d b consult white paperToomas Sarv
 
Australian Telco Sector Analysis
Australian Telco Sector AnalysisAustralian Telco Sector Analysis
Australian Telco Sector AnalysisSam Rahmanian
 
New Report: The Connected Consumer Survey 2013: Voice and Messaging
New Report: The Connected Consumer Survey 2013: Voice and MessagingNew Report: The Connected Consumer Survey 2013: Voice and Messaging
New Report: The Connected Consumer Survey 2013: Voice and MessagingAnalysysMasonResearch
 
Over-the-top (OTT) TW FINAL v-xv
Over-the-top (OTT) TW FINAL v-xvOver-the-top (OTT) TW FINAL v-xv
Over-the-top (OTT) TW FINAL v-xvTom Wilson
 
. State of the telecoms services sector in europe
. State of the telecoms services sector in europe. State of the telecoms services sector in europe
. State of the telecoms services sector in europeCMR WORLD TECH
 
Ericsson Mobility Report, November 2015 - Regional report Sub-Saharan Africa
Ericsson Mobility Report, November 2015 - Regional report Sub-Saharan AfricaEricsson Mobility Report, November 2015 - Regional report Sub-Saharan Africa
Ericsson Mobility Report, November 2015 - Regional report Sub-Saharan AfricaEricsson
 
Usa Turkey Telecom And Mobile Marketing Advertising Benchmarking Limited Edition
Usa Turkey Telecom And Mobile Marketing Advertising Benchmarking Limited EditionUsa Turkey Telecom And Mobile Marketing Advertising Benchmarking Limited Edition
Usa Turkey Telecom And Mobile Marketing Advertising Benchmarking Limited EditionEvrim Dirik
 

What's hot (20)

Ofcom - The Communications Market in UK 2009
Ofcom - The Communications Market in UK 2009Ofcom - The Communications Market in UK 2009
Ofcom - The Communications Market in UK 2009
 
Financial Mgmt Ind
Financial Mgmt IndFinancial Mgmt Ind
Financial Mgmt Ind
 
Yet another metamorphosis for gcc telecom operators
Yet another metamorphosis for gcc telecom operatorsYet another metamorphosis for gcc telecom operators
Yet another metamorphosis for gcc telecom operators
 
Impact of Over the Top (OTT) Services on Telecom
Impact of Over the Top (OTT) Services on TelecomImpact of Over the Top (OTT) Services on Telecom
Impact of Over the Top (OTT) Services on Telecom
 
ADL_TimeToBetterLeverageLTE
ADL_TimeToBetterLeverageLTEADL_TimeToBetterLeverageLTE
ADL_TimeToBetterLeverageLTE
 
Ericsson Traffic and Market Report- June 2012
Ericsson Traffic and Market Report- June 2012Ericsson Traffic and Market Report- June 2012
Ericsson Traffic and Market Report- June 2012
 
Mobile Broadband Growth - Reports from HSPA Operators Worldwide August 2010
Mobile Broadband Growth - Reports from HSPA Operators Worldwide August 2010Mobile Broadband Growth - Reports from HSPA Operators Worldwide August 2010
Mobile Broadband Growth - Reports from HSPA Operators Worldwide August 2010
 
World Class Benchmarking: PLDT Inc (TEL PM)
World Class Benchmarking: PLDT Inc (TEL PM)World Class Benchmarking: PLDT Inc (TEL PM)
World Class Benchmarking: PLDT Inc (TEL PM)
 
Content for-all-the-potential-for-lte-broadcast-embms-white-paper
Content for-all-the-potential-for-lte-broadcast-embms-white-paperContent for-all-the-potential-for-lte-broadcast-embms-white-paper
Content for-all-the-potential-for-lte-broadcast-embms-white-paper
 
Wireless advertising messaging legal analysis & public policy issues, a review
Wireless advertising messaging legal analysis & public policy issues, a reviewWireless advertising messaging legal analysis & public policy issues, a review
Wireless advertising messaging legal analysis & public policy issues, a review
 
White paper: Closing the mobile data revenue gap (2010)
White paper: Closing the mobile data revenue gap (2010)White paper: Closing the mobile data revenue gap (2010)
White paper: Closing the mobile data revenue gap (2010)
 
Reducing the cost per gigabyte - a 3d b consult white paper
Reducing the cost per gigabyte - a 3d b consult white paperReducing the cost per gigabyte - a 3d b consult white paper
Reducing the cost per gigabyte - a 3d b consult white paper
 
Australian Telco Sector Analysis
Australian Telco Sector AnalysisAustralian Telco Sector Analysis
Australian Telco Sector Analysis
 
New Report: The Connected Consumer Survey 2013: Voice and Messaging
New Report: The Connected Consumer Survey 2013: Voice and MessagingNew Report: The Connected Consumer Survey 2013: Voice and Messaging
New Report: The Connected Consumer Survey 2013: Voice and Messaging
 
Over-the-top (OTT) TW FINAL v-xv
Over-the-top (OTT) TW FINAL v-xvOver-the-top (OTT) TW FINAL v-xv
Over-the-top (OTT) TW FINAL v-xv
 
. State of the telecoms services sector in europe
. State of the telecoms services sector in europe. State of the telecoms services sector in europe
. State of the telecoms services sector in europe
 
Media Update - July 2011
Media Update - July 2011Media Update - July 2011
Media Update - July 2011
 
Ericsson Mobility Report, November 2015 - Regional report Sub-Saharan Africa
Ericsson Mobility Report, November 2015 - Regional report Sub-Saharan AfricaEricsson Mobility Report, November 2015 - Regional report Sub-Saharan Africa
Ericsson Mobility Report, November 2015 - Regional report Sub-Saharan Africa
 
Usa Turkey Telecom And Mobile Marketing Advertising Benchmarking Limited Edition
Usa Turkey Telecom And Mobile Marketing Advertising Benchmarking Limited EditionUsa Turkey Telecom And Mobile Marketing Advertising Benchmarking Limited Edition
Usa Turkey Telecom And Mobile Marketing Advertising Benchmarking Limited Edition
 
OTTs vs MNOs
OTTs vs MNOs OTTs vs MNOs
OTTs vs MNOs
 

Viewers also liked (14)

Formwell Co-Profile
Formwell Co-ProfileFormwell Co-Profile
Formwell Co-Profile
 
using-islam-for-political-power-job-quotas-and-us-dollars
using-islam-for-political-power-job-quotas-and-us-dollarsusing-islam-for-political-power-job-quotas-and-us-dollars
using-islam-for-political-power-job-quotas-and-us-dollars
 
Mega meta unidad 3
Mega meta unidad 3Mega meta unidad 3
Mega meta unidad 3
 
Pestalozzi
PestalozziPestalozzi
Pestalozzi
 
Elasticidad
ElasticidadElasticidad
Elasticidad
 
Recursos mineros en el perú 22222
Recursos mineros en el perú  22222Recursos mineros en el perú  22222
Recursos mineros en el perú 22222
 
Defensoría Universitaria
Defensoría UniversitariaDefensoría Universitaria
Defensoría Universitaria
 
ソースコードの改善について
ソースコードの改善についてソースコードの改善について
ソースコードの改善について
 
Tipos de madera
Tipos de maderaTipos de madera
Tipos de madera
 
Ensayo proctor
Ensayo proctorEnsayo proctor
Ensayo proctor
 
Cronograma de Pagos - 2017
Cronograma de Pagos - 2017Cronograma de Pagos - 2017
Cronograma de Pagos - 2017
 
Jordada PLURILINGÜISME I DIVERSITAT CULTURAL: Projecte Europeu KOINOS Portfol...
Jordada PLURILINGÜISME I DIVERSITAT CULTURAL: Projecte Europeu KOINOS Portfol...Jordada PLURILINGÜISME I DIVERSITAT CULTURAL: Projecte Europeu KOINOS Portfol...
Jordada PLURILINGÜISME I DIVERSITAT CULTURAL: Projecte Europeu KOINOS Portfol...
 
Ka219comentado
Ka219comentadoKa219comentado
Ka219comentado
 
Idi piri reis
Idi piri reisIdi piri reis
Idi piri reis
 

Similar to T-Mobile US Inc. Full Report

Global Telecoms - The Big Picture 2016 and Key Industry Statistics
Global Telecoms - The Big Picture 2016 and Key Industry StatisticsGlobal Telecoms - The Big Picture 2016 and Key Industry Statistics
Global Telecoms - The Big Picture 2016 and Key Industry StatisticsMarketResearch.com
 
Wireless at a Crossroads
Wireless at a CrossroadsWireless at a Crossroads
Wireless at a CrossroadsCognizant
 
ATT Inc. Strategy Analysis
ATT Inc. Strategy AnalysisATT Inc. Strategy Analysis
ATT Inc. Strategy AnalysisKyle Hughes
 
Trafficandmarketreportjune2012final 120605095343-phpapp02
Trafficandmarketreportjune2012final 120605095343-phpapp02Trafficandmarketreportjune2012final 120605095343-phpapp02
Trafficandmarketreportjune2012final 120605095343-phpapp02abhikwb
 
Ericsson Mobility Report, June 2016 - Regional report North America
Ericsson Mobility Report, June 2016 - Regional report North AmericaEricsson Mobility Report, June 2016 - Regional report North America
Ericsson Mobility Report, June 2016 - Regional report North AmericaEricsson
 
Ericsson Mobility Report June 2013
Ericsson Mobility Report June 2013 Ericsson Mobility Report June 2013
Ericsson Mobility Report June 2013 Ericsson
 
Openet guide shared_data_2014_may27
Openet guide shared_data_2014_may27Openet guide shared_data_2014_may27
Openet guide shared_data_2014_may27Abdallah Nabulsi
 
Telecommunications | GlowTouch
Telecommunications | GlowTouchTelecommunications | GlowTouch
Telecommunications | GlowTouchSanjay K
 
Understanding today’s smartphone user
Understanding today’s smartphone userUnderstanding today’s smartphone user
Understanding today’s smartphone userDavid Martin
 
ATT Strategy Analysis
ATT Strategy AnalysisATT Strategy Analysis
ATT Strategy AnalysisKyle Hughes
 
Using LTE to Boost ARPU
Using LTE to Boost ARPUUsing LTE to Boost ARPU
Using LTE to Boost ARPUeXplanoTech
 
Gsma data-demand-explained-june-2015
Gsma data-demand-explained-june-2015Gsma data-demand-explained-june-2015
Gsma data-demand-explained-june-2015Ketut Widya
 
WORKFORCE MANAGEMENT HARDWARE AND SOFTWARE: BUSINESS DEVELOPMENT STRATEGIES ...
WORKFORCE MANAGEMENT HARDWARE AND SOFTWARE:  BUSINESS DEVELOPMENT STRATEGIES ...WORKFORCE MANAGEMENT HARDWARE AND SOFTWARE:  BUSINESS DEVELOPMENT STRATEGIES ...
WORKFORCE MANAGEMENT HARDWARE AND SOFTWARE: BUSINESS DEVELOPMENT STRATEGIES ...Kim Boggio
 
Q3 2016 factbook final
Q3 2016 factbook finalQ3 2016 factbook final
Q3 2016 factbook finalCristal Dunkin
 
Day 1 C2C - Ovum - Connectivity index Global and Africa
Day 1 C2C - Ovum - Connectivity index Global and AfricaDay 1 C2C - Ovum - Connectivity index Global and Africa
Day 1 C2C - Ovum - Connectivity index Global and AfricaMyles Freedman
 
Australia – Telecoms Industry Analysis and Forecast to 2015-2020
Australia – Telecoms Industry Analysis and Forecast to 2015-2020 Australia – Telecoms Industry Analysis and Forecast to 2015-2020
Australia – Telecoms Industry Analysis and Forecast to 2015-2020 Sachin Sharma
 
State of 4G Apps Development 2014: Trends, Challenges, Solutions
State of 4G Apps Development 2014: Trends, Challenges, Solutions State of 4G Apps Development 2014: Trends, Challenges, Solutions
State of 4G Apps Development 2014: Trends, Challenges, Solutions Intersog
 
Project on Vodafone Strategies
Project on Vodafone StrategiesProject on Vodafone Strategies
Project on Vodafone StrategiesDevansh Aggarwal
 

Similar to T-Mobile US Inc. Full Report (20)

Global Telecoms - The Big Picture 2016 and Key Industry Statistics
Global Telecoms - The Big Picture 2016 and Key Industry StatisticsGlobal Telecoms - The Big Picture 2016 and Key Industry Statistics
Global Telecoms - The Big Picture 2016 and Key Industry Statistics
 
Wireless at a Crossroads
Wireless at a CrossroadsWireless at a Crossroads
Wireless at a Crossroads
 
ATT Inc. Strategy Analysis
ATT Inc. Strategy AnalysisATT Inc. Strategy Analysis
ATT Inc. Strategy Analysis
 
Trafficandmarketreportjune2012final 120605095343-phpapp02
Trafficandmarketreportjune2012final 120605095343-phpapp02Trafficandmarketreportjune2012final 120605095343-phpapp02
Trafficandmarketreportjune2012final 120605095343-phpapp02
 
Ericsson Mobility Report, June 2016 - Regional report North America
Ericsson Mobility Report, June 2016 - Regional report North AmericaEricsson Mobility Report, June 2016 - Regional report North America
Ericsson Mobility Report, June 2016 - Regional report North America
 
Pricing Benchmark 4^Edition 2015
Pricing Benchmark 4^Edition 2015Pricing Benchmark 4^Edition 2015
Pricing Benchmark 4^Edition 2015
 
Ericsson Mobility Report June 2013
Ericsson Mobility Report June 2013 Ericsson Mobility Report June 2013
Ericsson Mobility Report June 2013
 
Openet guide shared_data_2014_may27
Openet guide shared_data_2014_may27Openet guide shared_data_2014_may27
Openet guide shared_data_2014_may27
 
Telecommunications | GlowTouch
Telecommunications | GlowTouchTelecommunications | GlowTouch
Telecommunications | GlowTouch
 
Understanding today’s smartphone user
Understanding today’s smartphone userUnderstanding today’s smartphone user
Understanding today’s smartphone user
 
ATT Strategy Analysis
ATT Strategy AnalysisATT Strategy Analysis
ATT Strategy Analysis
 
Using LTE to Boost ARPU
Using LTE to Boost ARPUUsing LTE to Boost ARPU
Using LTE to Boost ARPU
 
Gsma data-demand-explained-june-2015
Gsma data-demand-explained-june-2015Gsma data-demand-explained-june-2015
Gsma data-demand-explained-june-2015
 
WORKFORCE MANAGEMENT HARDWARE AND SOFTWARE: BUSINESS DEVELOPMENT STRATEGIES ...
WORKFORCE MANAGEMENT HARDWARE AND SOFTWARE:  BUSINESS DEVELOPMENT STRATEGIES ...WORKFORCE MANAGEMENT HARDWARE AND SOFTWARE:  BUSINESS DEVELOPMENT STRATEGIES ...
WORKFORCE MANAGEMENT HARDWARE AND SOFTWARE: BUSINESS DEVELOPMENT STRATEGIES ...
 
Q3 2016 factbook final
Q3 2016 factbook finalQ3 2016 factbook final
Q3 2016 factbook final
 
Day 1 C2C - Ovum - Connectivity index Global and Africa
Day 1 C2C - Ovum - Connectivity index Global and AfricaDay 1 C2C - Ovum - Connectivity index Global and Africa
Day 1 C2C - Ovum - Connectivity index Global and Africa
 
Gsa global lte_market_update_010813
Gsa global lte_market_update_010813Gsa global lte_market_update_010813
Gsa global lte_market_update_010813
 
Australia – Telecoms Industry Analysis and Forecast to 2015-2020
Australia – Telecoms Industry Analysis and Forecast to 2015-2020 Australia – Telecoms Industry Analysis and Forecast to 2015-2020
Australia – Telecoms Industry Analysis and Forecast to 2015-2020
 
State of 4G Apps Development 2014: Trends, Challenges, Solutions
State of 4G Apps Development 2014: Trends, Challenges, Solutions State of 4G Apps Development 2014: Trends, Challenges, Solutions
State of 4G Apps Development 2014: Trends, Challenges, Solutions
 
Project on Vodafone Strategies
Project on Vodafone StrategiesProject on Vodafone Strategies
Project on Vodafone Strategies
 

T-Mobile US Inc. Full Report