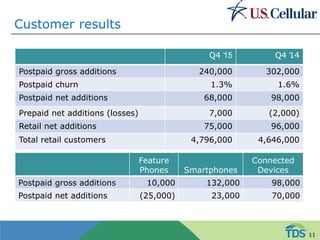
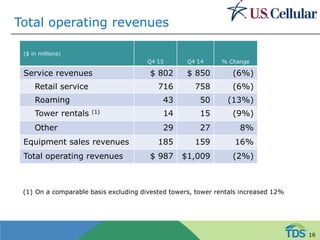
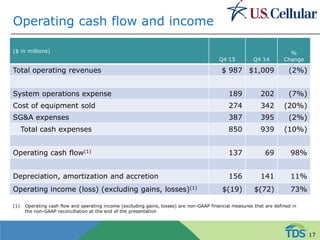
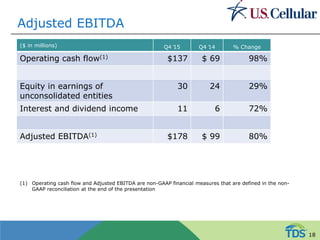
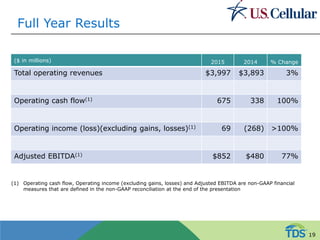
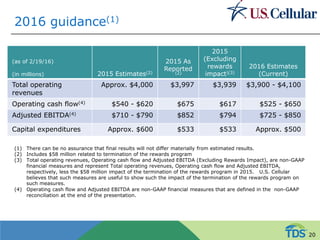
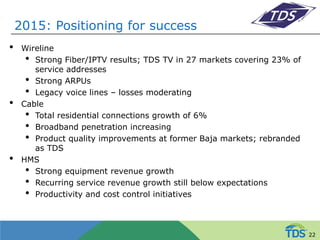
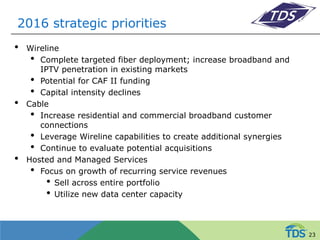
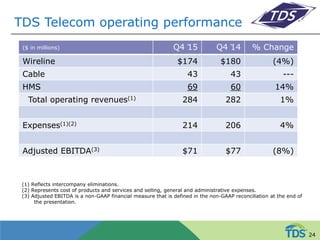
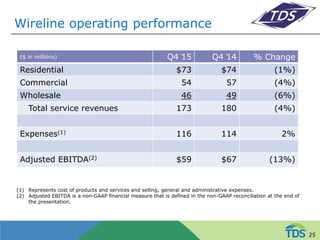
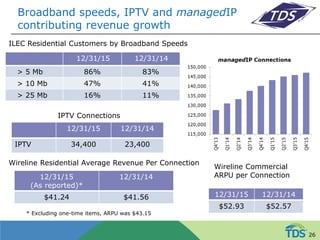
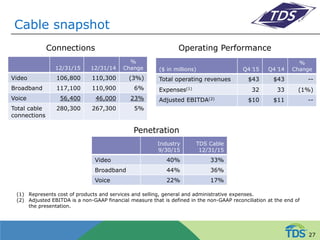
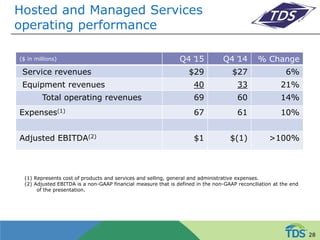
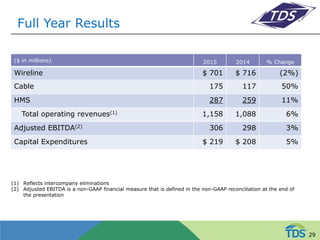
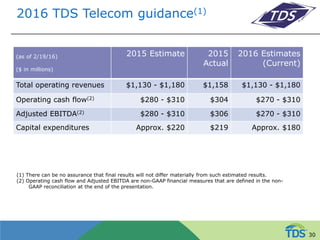
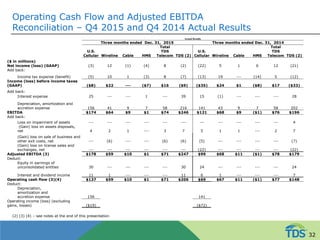
SlideShare a Scribd company logo
1 of 35
Download to read offline
February 19, 2016
Fourth Quarter 2015 Results,
2015 Accomplishments and
2016 Strategic Priorities and
Guidance
Safe Harbor Statement Under the Private
Securities Litigation Reform Act of 1995
All information set forth in this presentation, except historical and factual information,
represents forward-looking statements. This includes all statements about the company’s
plans, beliefs, estimates, and expectations. These statements are based on current
estimates, projections, and assumptions, which involve certain risks and uncertainties that
could cause actual results to differ materially from those in the forward-looking statements.
Important factors that may affect these forward-looking statements include, but are not
limited to: intense competition; the ability to execute TDS’ business strategy; uncertainties
in TDS’ future cash flows and liquidity and access to the capital markets; the ability to make
payments on TDS and U.S. Cellular indebtedness or comply with the terms of debt
covenants; impacts of any pending acquisitions/divestures/exchanges of properties and/or
licenses, including, but not limited to, the ability to obtain regulatory approvals,
successfully complete the transactions and the financial impacts of such transactions; the
ability of the company to successfully manage and grow its markets; the overall economy;
the access to and pricing of unbundled network elements; the ability to obtain or maintain
roaming arrangements with other carriers on acceptable terms; the state and federal
telecommunications regulatory environment; the value of assets and investments; adverse
changes in the ratings afforded TDS and U.S. Cellular debt securities by accredited ratings
organizations; industry consolidation; advances in telecommunications technology; pending
and future litigation; changes in income tax rates, laws, regulations or rulings; changes in
customer growth rates, average monthly revenue per user, churn rates, roaming revenue
and terms, the availability of wireless devices, or the mix of products and services offered
by U.S. Cellular and TDS Telecom. Investors are encouraged to consider these and other
risks and uncertainties that are discussed in documents furnished to the Securities and
Exchange Commission (“SEC”).
2
Upcoming conferences
• 3/2/16 – Morgan Stanley Technology, Media and Telecom Conference
(San Francisco)
• 3/7/16 – Deutsche Bank 2016 Media, Internet & Telecom Conference
(Palm Beach, Florida)
• 3/8/16 – Raymond James 2016 Institutional Investors Conference
(Orlando)
3
TDS – Executing on Strategic Imperatives
• Executing strategies to build long-term shareholder value:
• Invest in our business to improve returns
• Network and IT investments improving competitive position
• Disciplined buyer of cable assets – no acquisitions identified in
2015 that met our investment criteria
• Return value to shareholders
• Increased 2016 dividend 5% -- 42nd year of dividend increases
• No TDS share repurchase in 2015
• Since capital allocation ratio was announced mid-2013, $581 million
invested, $196 million returned to shareholders
• Support growth initiatives through sound and disciplined financing
strategies
• USM debt shelf will be replenished back to $500 million
• Bonus depreciation aids cash flow
4
2015: Positioning for success
• Customer growth
• Decline in switching activity drives fewer gross additions
• Significant improvement in churn evidence of high customer satisfaction
• Strong Network
• Completed roll-out of 4G LTE network, covering 99% of our customer
base; 83% of our data traffic on this network
• Ongoing VoLTE user trials
• Multiple 4G LTE roaming agreements signed and customer rollout
underway
• Competitive product and service offerings
• Strong device portfolio
• Successful EIP offerings
• Substantial OCF growth
• Tight cost controls
• Reward points
• Lower gross additions and upgrades = lower transactional expenses
6
Strategic priorities for 2016
• Drive customer growth
• Grow revenues through customer growth, smartphone adoption and
data monetization
• Reduce unit costs
• Manage investments
7
Drive customer growth
• Increase gross additions with
• “best value in wireless”
• high-network quality
• strong device portfolio
• continued expansion of equipment offerings
• win-back programs
• SMB/local government focus
• targeted promotions
• Maintain low churn
8
Drive revenue growth
• Grow customer base
• Increase smartphone penetration
• Monetization of growing data usage
• Continue penetration of Shared Connect plans
• Connected devices; increase number of devices per account
• High margin revenue streams
• Device protection plans
• Accessory sales
• Competitive pricing environment is a headwind to revenue growth
9
Margin and investments
• Trade-off between customer acquisition and margin
• Manage Loss on Equipment
• Longer upgrade cycle
• Reduce unit costs
• Capital expenditures lower with completion of 4G LTE deployment
10
Customer results
Q4 ̕15 Q4 ̕14
Postpaid gross additions 240,000 302,000
Postpaid churn 1.3% 1.6%
Postpaid net additions 68,000 98,000
Prepaid net additions (losses) 7,000 (2,000)
Retail net additions 75,000 96,000
Total retail customers 4,796,000 4,646,000
Feature
Phones Smartphones
Connected
Devices
Postpaid gross additions 10,000 132,000 98,000
Postpaid net additions (25,000) 23,000 70,000
11
Postpaid churn rate
12
Smartphone sales and penetration
13
Data usage (In MB)
(In Millions)
14
Postpaid revenue
Q4’15 Q4’14
%
Change
Average Revenue Per User $51.46 $56.51 (9%)
Add: EIP billings 7.11 2.62 >100%
Average Billings Per User $58.57 $59.13 (1%)
Average Revenue Per Account $131.96 $136.13 (3%)
Add: EIP billings 18.23 6.31 >100%
Average Billings Per Account $150.19 $142.44 5%
15
Total operating revenues
($ in millions)
Q4 ̕15 Q4 ̕14 % Change
Service revenues $ 802 $ 850 (6%)
Retail service 716 758 (6%)
Roaming 43 50 (13%)
Tower rentals (1) 14 15 (9%)
Other 29 27 8%
Equipment sales revenues 185 159 16%
Total operating revenues $ 987 $1,009 (2%)
(1) On a comparable basis excluding divested towers, tower rentals increased 12%
16
Operating cash flow and income
($ in millions)
Q4 ̕15 Q4 ̕14
%
Change
Total operating revenues $ 987 $1,009 (2%)
System operations expense 189 202 (7%)
Cost of equipment sold 274 342 (20%)
SG&A expenses 387 395 (2%)
Total cash expenses 850 939 (10%)
Operating cash flow(1) 137 69 98%
Depreciation, amortization and accretion 156 141 11%
Operating income (loss) (excluding gains, losses)(1) $(19) $(72) 73%
(1) Operating cash flow and operating income (excluding gains, losses) are non-GAAP financial measures that are defined in
the non-GAAP reconciliation at the end of the presentation
17
Adjusted EBITDA
($ in millions) Q4 ̕15 Q4 ̕14 % Change
Operating cash flow(1) $137 $ 69 98%
Equity in earnings of
unconsolidated entities
30 24 29%
Interest and dividend income 11 6 72%
Adjusted EBITDA(1) $178 $ 99 80%
(1) Operating cash flow and Adjusted EBITDA are non-GAAP financial measures that are defined in the non-
GAAP reconciliation at the end of the presentation
18
Full Year Results
($ in millions) 2015 2014 % Change
Total operating revenues $3,997 $3,893 3%
Operating cash flow(1) 675 338 100%
Operating income (loss)(excluding gains, losses)(1) 69 (268) >100%
Adjusted EBITDA(1) $852 $480 77%
(1) Operating cash flow, Operating income (excluding gains, losses) and Adjusted EBITDA are non-GAAP financial
measures that are defined in the non-GAAP reconciliation at the end of the presentation
19
2016 guidance(1)
(as of 2/19/16)
(in millions) 2015 Estimates(2)
2015 As
Reported
(2)
2015
(Excluding
rewards
impact)(3)
2016 Estimates
(Current)
Total operating
revenues
Approx. $4,000 $3,997 $3,939 $3,900 - $4,100
Operating cash flow(4) $540 - $620 $675 $617 $525 - $650
Adjusted EBITDA(4) $710 - $790 $852 $794 $725 - $850
Capital expenditures Approx. $600 $533 $533 Approx. $500
(1) There can be no assurance that final results will not differ materially from estimated results.
(2) Includes $58 million related to termination of the rewards program
(3) Total operating revenues, Operating cash flow and Adjusted EBITDA (Excluding Rewards Impact), are non-GAAP
financial measures and represent Total operating revenues, Operating cash flow and Adjusted EBITDA,
respectively, less the $58 million impact of the termination of the rewards program in 2015. U.S. Cellular
believes that such measures are useful to show such the impact of the termination of the rewards program on
such measures.
(4) Operating cash flow and Adjusted EBITDA are non-GAAP financial measures that are defined in the non-GAAP
reconciliation at the end of the presentation.
20
21
2015: Positioning for success
• Wireline
• Strong Fiber/IPTV results; TDS TV in 27 markets covering 23% of
service addresses
• Strong ARPUs
• Legacy voice lines – losses moderating
• Cable
• Total residential connections growth of 6%
• Broadband penetration increasing
• Product quality improvements at former Baja markets; rebranded
as TDS
• HMS
• Strong equipment revenue growth
• Recurring service revenue growth still below expectations
• Productivity and cost control initiatives
22
2016 strategic priorities
• Wireline
• Complete targeted fiber deployment; increase broadband and
IPTV penetration in existing markets
• Potential for CAF II funding
• Capital intensity declines
• Cable
• Increase residential and commercial broadband customer
connections
• Leverage Wireline capabilities to create additional synergies
• Continue to evaluate potential acquisitions
• Hosted and Managed Services
• Focus on growth of recurring service revenues
• Sell across entire portfolio
• Utilize new data center capacity
23
TDS Telecom operating performance
($ in millions) Q4 ̕15 Q4 ̕14 % Change
Wireline $174 $180 (4%)
Cable 43 43 ---
HMS 69 60 14%
Total operating revenues(1) 284 282 1%
Expenses(1)(2) 214 206 4%
Adjusted EBITDA(3) $71 $77 (8%)
(1) Reflects intercompany eliminations.
(2) Represents cost of products and services and selling, general and administrative expenses.
(3) Adjusted EBITDA is a non-GAAP financial measure that is defined in the non-GAAP reconciliation at the end of
the presentation.
24
Wireline operating performance
($ in millions) Q4 ̕15 Q4 ̕14 % Change
Residential $73 $74 (1%)
Commercial 54 57 (4%)
Wholesale 46 49 (6%)
Total service revenues 173 180 (4%)
Expenses(1) 116 114 2%
Adjusted EBITDA(2) $59 $67 (13%)
(1) Represents cost of products and services and selling, general and administrative expenses.
(2) Adjusted EBITDA is a non-GAAP financial measure that is defined in the non-GAAP reconciliation at the end of
the presentation.
25
Broadband speeds, IPTV and managedIP
contributing revenue growth
12/31/15 12/31/14
> 5 Mb 86% 83%
> 10 Mb 47% 41%
> 25 Mb 16% 11%
12/31/15
(As reported)*
12/31/14
$41.24 $41.56
Wireline Residential Average Revenue Per Connection
ILEC Residential Customers by Broadband Speeds
12/31/15 12/31/14
IPTV 34,400 23,400
IPTV Connections
12/31/15 12/31/14
$52.93 $52.57
Wireline Commercial
ARPU per Connection
* Excluding one-time items, ARPU was $43.15
26
Cable snapshot
12/31/15 12/31/14
%
Change
Video 106,800 110,300 (3%)
Broadband 117,100 110,900 6%
Voice 56,400 46,000 23%
Total cable
connections
280,300 267,300 5%
Industry
9/30/15
TDS Cable
12/31/15
Video 40% 33%
Broadband 44% 36%
Voice 22% 17%
(1) Represents cost of products and services and selling, general and administrative expenses.
(2) Adjusted EBITDA is a non-GAAP financial measure that is defined in the non-GAAP reconciliation at the end of
the presentation.
($ in millions) Q4 ̕15 Q4 ̕14
%
Change
Total operating revenues $43 $43 --
Expenses(1) 32 33 (1%)
Adjusted EBITDA(2) $10 $11 --
Connections Operating Performance
Penetration
27
Hosted and Managed Services
operating performance
($ in millions) Q4 ̕15 Q4 ̕14 % Change
Service revenues $29 $27 6%
Equipment revenues 40 33 21%
Total operating revenues 69 60 14%
Expenses(1) 67 61 10%
Adjusted EBITDA(2) $1 $(1) >100%
(1) Represents cost of products and services and selling, general and administrative expenses.
(2) Adjusted EBITDA is a non-GAAP financial measure that is defined in the non-GAAP reconciliation at the end
of the presentation.
28
Full Year Results
($ in millions) 2015 2014 % Change
Wireline $ 701 $ 716 (2%)
Cable 175 117 50%
HMS 287 259 11%
Total operating revenues(1) 1,158 1,088 6%
Adjusted EBITDA(2) 306 298 3%
Capital Expenditures $ 219 $ 208 5%
(1) Reflects intercompany eliminations
(2) Adjusted EBITDA is a non-GAAP financial measure that is defined in the non-GAAP reconciliation at the end of
the presentation
29
2016 TDS Telecom guidance(1)
(as of 2/19/16)
($ in millions)
2015 Estimate 2015
Actual
2016 Estimates
(Current)
Total operating revenues $1,130 - $1,180 $1,158 $1,130 - $1,180
Operating cash flow(2) $280 - $310 $304 $270 - $310
Adjusted EBITDA(2) $280 - $310 $306 $270 - $310
Capital expenditures Approx. $220 $219 Approx. $180
(1) There can be no assurance that final results will not differ materially from such estimated results.
(2) Operating cash flow and Adjusted EBITDA are non-GAAP financial measures that are defined in the non-
GAAP reconciliation at the end of the presentation.
30
Appendix
31
Operating Cash Flow and Adjusted EBITDA
Reconciliation – Q4 2015 and Q4 2014 Actual Results
Actual Results
Three months ended Dec. 31, 2015 Three months ended Dec. 31, 2014
U.S.
Cellular Wireline Cable HMS
Total
TDS
Telecom TDS (2)
U.S.
Cellular Wireline Cable HMS
Total
TDS
Telecom TDS (2)
($ in millions)
Net income (loss) (GAAP) (3) 12 (1) (4) 8 (2) (22) 5 1 6 12 (21)
Add back:
Income tax expense (benefit) (5) 10 1 (3) 8 (7) (13) 19 --- (14) 5 (12)
Income (loss) before income taxes
(GAAP) ($8) $22 --- ($7) $16 ($9) ($35) $24 $1 ($8) $17 ($33)
Add back:
Interest expense 25 --- --- 1 --- 39 15 (1) --- --- --- 28
Depreciation, amortization and
accretion expense 156 41 9 7 58 216 141 43 9 7 58 202
EBITDA $174 $64 $9 $1 $74 $246 $121 $68 $9 ($1) $76 $196
Add back:
Loss on impairment of assets --- --- --- --- --- --- --- --- --- --- --- 4
(Gain) loss on assets disposals,
net 4 2 1 --- 3 7 5 1 1 --- 2 7
(Gain) loss on sale of business and
other exit costs, net --- (6) --- --- (6) (6) (5) --- --- --- --- (7)
(Gain) loss on license sales and
exchanges, net --- --- --- --- --- --- (22) --- --- --- --- (22)
Adjusted EBITDA (3) $178 $59 $10 $1 $71 $247 $99 $68 $11 ($1) $78 $179
Deduct:
Equity in earnings of
unconsolidated entities 30 --- --- --- --- 30 24 --- --- --- --- 24
Interest and dividend income 11 1 --- --- --- 11 6 1 --- --- --- 7
Operating cash flow (3)(4) $137 $59 $10 $1 $71 $206 $69 $67 $11 ($1) $77 $148
Deduct:
Depreciation,
amortization and
accretion expense 156 141
Operating income (loss) (excluding
gains, losses) ($19) ($72)
(2) (3) (4) – see notes at the end of this presentation
32
Operating Cash Flow and Adjusted EBITDA Reconciliation –
2016 Estimated, 2015 and 2014 Full Year Actual Results
($ in millions)
(1) (2) (3) (4) (5) – see notes at the end of this presentation
2016
Estimate (1)
2015
Estimate (1)
2015
Actual
2014
Actual
2016
Estimate (1)
2015
Estimate (1)
2015
Actual 2014 Actual
Net Income (loss) (GAAP) N/A N/A 247 (47) N/A N/A 46 (24)
Add back:
Income tax expense (benefit) N/A N/A 156 (12) N/A N/A 35 18
Income (loss) before income taxes (loss) (GAAP) $0 - $125 $275-$355 $404 ($59) $40- $80 $45-$75 $81 ($7)
Add back:
Interest expense 105 80 86 57 -- -- 1 (1)
Depreciation, amortization and accretion 600 600 606 606 230 235 228 220
EBITDA $705-$830 $955-$1,035 $1,096 $605 $270 - $310 $280-$310 $310 $212
Add back:
Loss on impairment of assets --- --- --- --- -- --- --- 84
(Gain) loss on sale of business and other exit costs, net --- (115) (114) (33) -- (5) (10) (2)
(Gain) loss on license sales and exchanges (5) --- (145) (147) (113) -- --- --- ---
(Gain) loss on asset disposals, net 20 15 16 21 -- 5 6 5
Adjusted EBITDA (2) $725-$850 $710-$790 $852 $480 $270 -$310 $280-$310 $306 $298
Deduct:
Equity in earnings of unconsolidated entities (140) (135) (140) (130) -- -- --- ---
Interest and dividend income (60) (35) (37) (12) -- -- (2) (2)
Operating cash flow (2) (3) (4) $525-$650 $540--$620 $675 $338 $270 - $310 $280-$310 $304 $296
Dediuct:
Total Depreciation, Amortization and Accretion (606) (606)
Operating Income (loss) (excluding gains, losses) $69 ($268)
U.S. Cellular TDS Telecom
33
(1) In providing 2016 and 2015 Estimated Results, TDS has not completed the above reconciliation to net income
because it does not provide guidance for income taxes. TDS believes that the impact of income taxes cannot be
reasonably predicted; therefore, the company is unable to provide such guidance.
(2) The TDS column includes U.S. Cellular, TDS Telecom and also the impacts of consolidating eliminations, corporate
operations and non-reportable segments, all of which are not presented above.
(3) Operating cash flow is defined as net income, adjusted for the items set forth in the reconciliation above. Adjusted
EBITDA (earnings before interest, taxes, depreciation, amortization and accretion), is defined as net income,
adjusted for the items set forth in the reconciliation above. Operating income (loss) (excluding gains and losses), is
defined as net income, adjusted for the items set forth in the reconciliation above. Operating cash flow, Adjusted
EBITDA and Operating income (loss) (excluding gains and losses) exclude these items in order to show operating
results on a more comparable basis from period to period. From time to time, TDS may exclude other items from
Operating cash flow and/or Adjusted EBITDA and/or Operating income (loss) (excluding gains and losses) if such
items help reflect operating results on a more comparable basis. TDS does not intend to imply that any such items
that are excluded are non-recurring, infrequent or unusual; such items may occur in the future. Operating cash
flow, Adjusted EBITDA and Operating income (loss) (excluding gains and losses) are not measures of financial
performance under Generally Accepted Accounting Principles in the United States (“GAAP”) and should not be
considered as alternatives to net income as indicators of the company’s operating performance or as alternatives to
cash flows from operating activities, determined in accordance with GAAP, as indicators of cash flows or as
measures of liquidity. TDS believes Operating cash flow, Adjusted EBITDA and Operating income (loss) (excluding
gains and losses) are useful measures of TDS’ operating results before significant recurring non-cash charges, gains
and losses, and other items as indicated above.
(4) A reconciliation of Operating cash flow (Non-GAAP) and Operating income (excluding gains and losses) (Non-GAAP)
to operating income (GAAP) for Dec. 31, 2015 actual results can be found on the company's website at
investors.tdsinc.com.
(5) In February 2016, U.S. Cellular entered into multiple agreements to exchange licenses. Agreements are subject to
regulatory approval and other customary closing conditions, and are expected to close in 2016. Upon closing of the
transactions, U.S. Cellular expects to record a gain. A reasonable estimate of the gains is unavailable at the time of
this filing.
34
TDS Q4 2015 Earnings Presentation

More Related Content

What's hot

2Q16 Investor Factbook
2Q16 Investor Factbook2Q16 Investor Factbook
2Q16 Investor FactbookCristal Dunkin
 
Evine earnings presentation f17 q2
Evine earnings presentation f17 q2Evine earnings presentation f17 q2
Evine earnings presentation f17 q2evine2015
 
Dlr company overview june updated final
Dlr company overview june updated   finalDlr company overview june updated   final
Dlr company overview june updated finalir_digitalrealty
 
Level 3 communications bof aml 2015 leveraged finance conference final
Level 3 communications bof aml 2015 leveraged finance conference finalLevel 3 communications bof aml 2015 leveraged finance conference final
Level 3 communications bof aml 2015 leveraged finance conference finalLevel3_Communications
 
Sprint Fiscal 2Q15 Results Presentation
Sprint Fiscal 2Q15 Results PresentationSprint Fiscal 2Q15 Results Presentation
Sprint Fiscal 2Q15 Results PresentationSprint_IR
 
2 q16 investor_factbook_final
2 q16 investor_factbook_final2 q16 investor_factbook_final
2 q16 investor_factbook_finalCristal Dunkin
 
1 q16 investor_factbook_final
1 q16 investor_factbook_final1 q16 investor_factbook_final
1 q16 investor_factbook_finalCristal Dunkin
 
Deutsche Bank 23rd Annual Leveraged Finance Conference
Deutsche Bank 23rd Annual Leveraged Finance ConferenceDeutsche Bank 23rd Annual Leveraged Finance Conference
Deutsche Bank 23rd Annual Leveraged Finance ConferenceLevel3_Communications
 
Telecom Italia 1H 2013 Results - Franco Bernabè
Telecom Italia 1H 2013 Results - Franco BernabèTelecom Italia 1H 2013 Results - Franco Bernabè
Telecom Italia 1H 2013 Results - Franco BernabèGruppo TIM
 
Q2 2014 Quarterly Presentation Final
Q2 2014 Quarterly Presentation FinalQ2 2014 Quarterly Presentation Final
Q2 2014 Quarterly Presentation FinalTelephoneDataSystems
 
sprint nextel Quarterly Results 2008 2nd
sprint nextel Quarterly Results 2008 2ndsprint nextel Quarterly Results 2008 2nd
sprint nextel Quarterly Results 2008 2ndfinance6
 
Tds and us cellular q1 2014 earnings presentation
Tds and us cellular q1 2014 earnings presentationTds and us cellular q1 2014 earnings presentation
Tds and us cellular q1 2014 earnings presentationUSCellular
 
Verifone Q4 2016 Earnings
Verifone Q4 2016 EarningsVerifone Q4 2016 Earnings
Verifone Q4 2016 EarningsVerifone
 
Q1 fy16 earnings-slides
Q1 fy16 earnings-slidesQ1 fy16 earnings-slides
Q1 fy16 earnings-slidesir_cisco
 

What's hot (16)

2Q16 Investor Factbook
2Q16 Investor Factbook2Q16 Investor Factbook
2Q16 Investor Factbook
 
Evine earnings presentation f17 q2
Evine earnings presentation f17 q2Evine earnings presentation f17 q2
Evine earnings presentation f17 q2
 
3 q 2017 operating results final
3 q 2017 operating results final3 q 2017 operating results final
3 q 2017 operating results final
 
2 q15 earnings presentation
2 q15 earnings presentation2 q15 earnings presentation
2 q15 earnings presentation
 
Dlr company overview june updated final
Dlr company overview june updated   finalDlr company overview june updated   final
Dlr company overview june updated final
 
Level 3 communications bof aml 2015 leveraged finance conference final
Level 3 communications bof aml 2015 leveraged finance conference finalLevel 3 communications bof aml 2015 leveraged finance conference final
Level 3 communications bof aml 2015 leveraged finance conference final
 
Sprint Fiscal 2Q15 Results Presentation
Sprint Fiscal 2Q15 Results PresentationSprint Fiscal 2Q15 Results Presentation
Sprint Fiscal 2Q15 Results Presentation
 
2 q16 investor_factbook_final
2 q16 investor_factbook_final2 q16 investor_factbook_final
2 q16 investor_factbook_final
 
1 q16 investor_factbook_final
1 q16 investor_factbook_final1 q16 investor_factbook_final
1 q16 investor_factbook_final
 
Deutsche Bank 23rd Annual Leveraged Finance Conference
Deutsche Bank 23rd Annual Leveraged Finance ConferenceDeutsche Bank 23rd Annual Leveraged Finance Conference
Deutsche Bank 23rd Annual Leveraged Finance Conference
 
Telecom Italia 1H 2013 Results - Franco Bernabè
Telecom Italia 1H 2013 Results - Franco BernabèTelecom Italia 1H 2013 Results - Franco Bernabè
Telecom Italia 1H 2013 Results - Franco Bernabè
 
Q2 2014 Quarterly Presentation Final
Q2 2014 Quarterly Presentation FinalQ2 2014 Quarterly Presentation Final
Q2 2014 Quarterly Presentation Final
 
sprint nextel Quarterly Results 2008 2nd
sprint nextel Quarterly Results 2008 2ndsprint nextel Quarterly Results 2008 2nd
sprint nextel Quarterly Results 2008 2nd
 
Tds and us cellular q1 2014 earnings presentation
Tds and us cellular q1 2014 earnings presentationTds and us cellular q1 2014 earnings presentation
Tds and us cellular q1 2014 earnings presentation
 
Verifone Q4 2016 Earnings
Verifone Q4 2016 EarningsVerifone Q4 2016 Earnings
Verifone Q4 2016 Earnings
 
Q1 fy16 earnings-slides
Q1 fy16 earnings-slidesQ1 fy16 earnings-slides
Q1 fy16 earnings-slides
 

Viewers also liked

35 2016 quando muore una persona estranea al cantiere
35   2016    quando muore una persona estranea al cantiere35   2016    quando muore una persona estranea al cantiere
35 2016 quando muore una persona estranea al cantierehttp://www.studioingvolpi.it
 
TDS Second Quarter 2016 Results
TDS Second Quarter 2016 ResultsTDS Second Quarter 2016 Results
TDS Second Quarter 2016 ResultsUSCellular
 
Letter of Recommendation Christina Eva Reif 1
Letter of Recommendation Christina Eva Reif 1Letter of Recommendation Christina Eva Reif 1
Letter of Recommendation Christina Eva Reif 1Christina Eva Reif
 
ตัวอย่างรูปเล่มวิชาโครงงาน ม.3
ตัวอย่างรูปเล่มวิชาโครงงาน ม.3ตัวอย่างรูปเล่มวิชาโครงงาน ม.3
ตัวอย่างรูปเล่มวิชาโครงงาน ม.3Nattipong Siangyen
 
Final Population Counts (PCA) NCT of Delhi
Final Population Counts (PCA) NCT of DelhiFinal Population Counts (PCA) NCT of Delhi
Final Population Counts (PCA) NCT of DelhiVarsha Joshi
 
HPE Cyber Risk Report 2016 InfoGraphic
HPE Cyber Risk Report 2016 InfoGraphicHPE Cyber Risk Report 2016 InfoGraphic
HPE Cyber Risk Report 2016 InfoGraphicTim Grieveson
 
School Health & Wellbeing Platfrom for Pupils, Teachers & Parents
School Health & Wellbeing Platfrom for Pupils, Teachers & ParentsSchool Health & Wellbeing Platfrom for Pupils, Teachers & Parents
School Health & Wellbeing Platfrom for Pupils, Teachers & ParentsGiverny Porter
 

Viewers also liked (12)

35 2016 quando muore una persona estranea al cantiere
35   2016    quando muore una persona estranea al cantiere35   2016    quando muore una persona estranea al cantiere
35 2016 quando muore una persona estranea al cantiere
 
TDS Second Quarter 2016 Results
TDS Second Quarter 2016 ResultsTDS Second Quarter 2016 Results
TDS Second Quarter 2016 Results
 
Medidas estadísticas
Medidas estadísticasMedidas estadísticas
Medidas estadísticas
 
Інформаційний бюлетень "ГРИП та ГРВІ" за 46 тиждень в Україні
Інформаційний бюлетень "ГРИП та ГРВІ" за 46 тиждень в УкраїніІнформаційний бюлетень "ГРИП та ГРВІ" за 46 тиждень в Україні
Інформаційний бюлетень "ГРИП та ГРВІ" за 46 тиждень в Україні
 
Letter of Recommendation Christina Eva Reif 1
Letter of Recommendation Christina Eva Reif 1Letter of Recommendation Christina Eva Reif 1
Letter of Recommendation Christina Eva Reif 1
 
ตัวอย่างรูปเล่มวิชาโครงงาน ม.3
ตัวอย่างรูปเล่มวิชาโครงงาน ม.3ตัวอย่างรูปเล่มวิชาโครงงาน ม.3
ตัวอย่างรูปเล่มวิชาโครงงาน ม.3
 
Final Population Counts (PCA) NCT of Delhi
Final Population Counts (PCA) NCT of DelhiFinal Population Counts (PCA) NCT of Delhi
Final Population Counts (PCA) NCT of Delhi
 
Global AIDS Response Progress Reporting
Global AIDS Response Progress ReportingGlobal AIDS Response Progress Reporting
Global AIDS Response Progress Reporting
 
Revista tematica.
Revista tematica.Revista tematica.
Revista tematica.
 
HPE Cyber Risk Report 2016 InfoGraphic
HPE Cyber Risk Report 2016 InfoGraphicHPE Cyber Risk Report 2016 InfoGraphic
HPE Cyber Risk Report 2016 InfoGraphic
 
презентація туберкульоз
презентація туберкульозпрезентація туберкульоз
презентація туберкульоз
 
School Health & Wellbeing Platfrom for Pupils, Teachers & Parents
School Health & Wellbeing Platfrom for Pupils, Teachers & ParentsSchool Health & Wellbeing Platfrom for Pupils, Teachers & Parents
School Health & Wellbeing Platfrom for Pupils, Teachers & Parents
 

Similar to TDS Q4 2015 Earnings Presentation

TDS - USC Q4 2016 operating results final
TDS - USC Q4 2016 operating results finalTDS - USC Q4 2016 operating results final
TDS - USC Q4 2016 operating results finalTelephoneDataSystems
 
2018 tds annual meeting of shareholders final
2018 tds annual meeting of shareholders final2018 tds annual meeting of shareholders final
2018 tds annual meeting of shareholders finalTelephoneDataSystems
 
Tds q4 2013 earnings presentation
Tds q4 2013 earnings presentationTds q4 2013 earnings presentation
Tds q4 2013 earnings presentationUSCellular
 
Q2 2014 quarterly presentation final
Q2 2014 quarterly presentation finalQ2 2014 quarterly presentation final
Q2 2014 quarterly presentation finalUSCellular
 
TDS Fourth Quarter 2014 Presentation
TDS Fourth Quarter 2014 PresentationTDS Fourth Quarter 2014 Presentation
TDS Fourth Quarter 2014 PresentationTelephoneDataSystems
 
Q4 2014 earnings presentation
Q4 2014 earnings presentationQ4 2014 earnings presentation
Q4 2014 earnings presentationUSCellular
 
3 q 2016 operating results final
3 q 2016 operating results final3 q 2016 operating results final
3 q 2016 operating results finalUSCellular
 
2 q 2018 final
2 q 2018 final2 q 2018 final
2 q 2018 finalUSCellular
 
TDS/USC Q1 2016 Earnings Presentation
TDS/USC Q1 2016 Earnings PresentationTDS/USC Q1 2016 Earnings Presentation
TDS/USC Q1 2016 Earnings PresentationUSCellular
 
3 q 2017 operating results final
3 q 2017 operating results final3 q 2017 operating results final
3 q 2017 operating results finalUSCellular
 
Q1 2014 quarterly presentation final
Q1 2014 quarterly presentation finalQ1 2014 quarterly presentation final
Q1 2014 quarterly presentation finalTelephoneDataSystems
 
Q2 2013 Quarterly Presentation Final
Q2 2013 Quarterly Presentation FinalQ2 2013 Quarterly Presentation Final
Q2 2013 Quarterly Presentation FinalTelephoneDataSystems
 
Raymond James 37th Annual Institutional Conference
Raymond James 37th Annual Institutional ConferenceRaymond James 37th Annual Institutional Conference
Raymond James 37th Annual Institutional ConferenceTelephoneDataSystems
 
Q1 2013 Earnings Conference Call Slides
Q1 2013 Earnings Conference Call SlidesQ1 2013 Earnings Conference Call Slides
Q1 2013 Earnings Conference Call SlidesIRJuniperNetworks
 

Similar to TDS Q4 2015 Earnings Presentation (20)

TDS - USC Q4 2016 operating results final
TDS - USC Q4 2016 operating results finalTDS - USC Q4 2016 operating results final
TDS - USC Q4 2016 operating results final
 
2018 tds annual meeting of shareholders final
2018 tds annual meeting of shareholders final2018 tds annual meeting of shareholders final
2018 tds annual meeting of shareholders final
 
Tds q4 2013 earnings presentation
Tds q4 2013 earnings presentationTds q4 2013 earnings presentation
Tds q4 2013 earnings presentation
 
Tds q4 2013 earnings presentation
Tds q4 2013 earnings presentationTds q4 2013 earnings presentation
Tds q4 2013 earnings presentation
 
Q2 2014 quarterly presentation final
Q2 2014 quarterly presentation finalQ2 2014 quarterly presentation final
Q2 2014 quarterly presentation final
 
Q4 2014 earnings presentation
Q4 2014 earnings presentationQ4 2014 earnings presentation
Q4 2014 earnings presentation
 
TDS Fourth Quarter 2014 Presentation
TDS Fourth Quarter 2014 PresentationTDS Fourth Quarter 2014 Presentation
TDS Fourth Quarter 2014 Presentation
 
Q4 2014 earnings presentation
Q4 2014 earnings presentationQ4 2014 earnings presentation
Q4 2014 earnings presentation
 
4 q 2017 operating results final
4 q 2017 operating results final4 q 2017 operating results final
4 q 2017 operating results final
 
3 q 2016 operating results final
3 q 2016 operating results final3 q 2016 operating results final
3 q 2016 operating results final
 
2 q 2018 final
2 q 2018 final2 q 2018 final
2 q 2018 final
 
TDS/USC Q1 2016 Earnings Presentation
TDS/USC Q1 2016 Earnings PresentationTDS/USC Q1 2016 Earnings Presentation
TDS/USC Q1 2016 Earnings Presentation
 
3 q 2017 operating results final
3 q 2017 operating results final3 q 2017 operating results final
3 q 2017 operating results final
 
Q1 2014 quarterly presentation final
Q1 2014 quarterly presentation finalQ1 2014 quarterly presentation final
Q1 2014 quarterly presentation final
 
Tds usc q1 2017 presentation
Tds usc q1 2017 presentationTds usc q1 2017 presentation
Tds usc q1 2017 presentation
 
1 q 2018 final
1 q 2018 final1 q 2018 final
1 q 2018 final
 
2 q 2017 operating results final
2 q 2017 operating results final2 q 2017 operating results final
2 q 2017 operating results final
 
Q2 2013 Quarterly Presentation Final
Q2 2013 Quarterly Presentation FinalQ2 2013 Quarterly Presentation Final
Q2 2013 Quarterly Presentation Final
 
Raymond James 37th Annual Institutional Conference
Raymond James 37th Annual Institutional ConferenceRaymond James 37th Annual Institutional Conference
Raymond James 37th Annual Institutional Conference
 
Q1 2013 Earnings Conference Call Slides
Q1 2013 Earnings Conference Call SlidesQ1 2013 Earnings Conference Call Slides
Q1 2013 Earnings Conference Call Slides
 

More from USCellular

Us cellular 2018 annual meeting final draft
Us cellular 2018 annual meeting final draftUs cellular 2018 annual meeting final draft
Us cellular 2018 annual meeting final draftUSCellular
 
Annual Meeting of Shareholders 2016
Annual Meeting of Shareholders 2016Annual Meeting of Shareholders 2016
Annual Meeting of Shareholders 2016USCellular
 
Q2 2015 earnings presentation
Q2 2015 earnings presentationQ2 2015 earnings presentation
Q2 2015 earnings presentationUSCellular
 
Q1 2015 earnings presentation final
Q1 2015 earnings presentation finalQ1 2015 earnings presentation final
Q1 2015 earnings presentation finalUSCellular
 
Q3 2014 earnings presentation
Q3 2014 earnings presentationQ3 2014 earnings presentation
Q3 2014 earnings presentationUSCellular
 
Q3 2013 Telephone and Data Systems and U.S. Cellular Earnings Conference Call
Q3 2013 Telephone and Data Systems and U.S. Cellular Earnings Conference CallQ3 2013 Telephone and Data Systems and U.S. Cellular Earnings Conference Call
Q3 2013 Telephone and Data Systems and U.S. Cellular Earnings Conference CallUSCellular
 

More from USCellular (6)

Us cellular 2018 annual meeting final draft
Us cellular 2018 annual meeting final draftUs cellular 2018 annual meeting final draft
Us cellular 2018 annual meeting final draft
 
Annual Meeting of Shareholders 2016
Annual Meeting of Shareholders 2016Annual Meeting of Shareholders 2016
Annual Meeting of Shareholders 2016
 
Q2 2015 earnings presentation
Q2 2015 earnings presentationQ2 2015 earnings presentation
Q2 2015 earnings presentation
 
Q1 2015 earnings presentation final
Q1 2015 earnings presentation finalQ1 2015 earnings presentation final
Q1 2015 earnings presentation final
 
Q3 2014 earnings presentation
Q3 2014 earnings presentationQ3 2014 earnings presentation
Q3 2014 earnings presentation
 
Q3 2013 Telephone and Data Systems and U.S. Cellular Earnings Conference Call
Q3 2013 Telephone and Data Systems and U.S. Cellular Earnings Conference CallQ3 2013 Telephone and Data Systems and U.S. Cellular Earnings Conference Call
Q3 2013 Telephone and Data Systems and U.S. Cellular Earnings Conference Call
 

Recently uploaded

CALL ON ➥8923113531 🔝Call Girls Fazullaganj Lucknow best sexual service
CALL ON ➥8923113531 🔝Call Girls Fazullaganj Lucknow best sexual serviceCALL ON ➥8923113531 🔝Call Girls Fazullaganj Lucknow best sexual service
CALL ON ➥8923113531 🔝Call Girls Fazullaganj Lucknow best sexual serviceanilsa9823
 
Teck Investor Presentation, April 24, 2024
Teck Investor Presentation, April 24, 2024Teck Investor Presentation, April 24, 2024
Teck Investor Presentation, April 24, 2024TeckResourcesLtd
 
Call Girls In Amritsar 💯Call Us 🔝 76967 34778🔝 💃 Independent Escort In Amritsar
Call Girls In Amritsar 💯Call Us 🔝 76967 34778🔝 💃 Independent Escort In AmritsarCall Girls In Amritsar 💯Call Us 🔝 76967 34778🔝 💃 Independent Escort In Amritsar
Call Girls In Amritsar 💯Call Us 🔝 76967 34778🔝 💃 Independent Escort In Amritsaronly4webmaster01
 
VIP Kolkata Call Girls Bidhannagar 8250192130 Available With Room
VIP Kolkata Call Girls Bidhannagar 8250192130 Available With RoomVIP Kolkata Call Girls Bidhannagar 8250192130 Available With Room
VIP Kolkata Call Girls Bidhannagar 8250192130 Available With Roomrran7532
 
VIP 7001035870 Find & Meet Hyderabad Call Girls Shamshabad high-profile Call ...
VIP 7001035870 Find & Meet Hyderabad Call Girls Shamshabad high-profile Call ...VIP 7001035870 Find & Meet Hyderabad Call Girls Shamshabad high-profile Call ...
VIP 7001035870 Find & Meet Hyderabad Call Girls Shamshabad high-profile Call ...aditipandeya
 
Collective Mining | Corporate Presentation - April 2024
Collective Mining | Corporate Presentation - April 2024Collective Mining | Corporate Presentation - April 2024
Collective Mining | Corporate Presentation - April 2024CollectiveMining1
 
Osisko Gold Royalties Ltd - Corporate Presentation, April 23, 2024
Osisko Gold Royalties Ltd - Corporate Presentation, April 23, 2024Osisko Gold Royalties Ltd - Corporate Presentation, April 23, 2024
Osisko Gold Royalties Ltd - Corporate Presentation, April 23, 2024Osisko Gold Royalties Ltd
 
如何办理(UTS毕业证书)悉尼科技大学毕业证学位证书
如何办理(UTS毕业证书)悉尼科技大学毕业证学位证书如何办理(UTS毕业证书)悉尼科技大学毕业证学位证书
如何办理(UTS毕业证书)悉尼科技大学毕业证学位证书Fis s
 
Nicola Mining Inc. Corporate Presentation April 2024
Nicola Mining Inc. Corporate Presentation April 2024Nicola Mining Inc. Corporate Presentation April 2024
Nicola Mining Inc. Corporate Presentation April 2024nicola_mining
 
VIP Kolkata Call Girl Rishra 👉 8250192130 Available With Room
VIP Kolkata Call Girl Rishra 👉 8250192130  Available With RoomVIP Kolkata Call Girl Rishra 👉 8250192130  Available With Room
VIP Kolkata Call Girl Rishra 👉 8250192130 Available With Roomdivyansh0kumar0
 
VIP Call Girl Amritsar 7001035870 Enjoy Call Girls With Our Escorts
VIP Call Girl Amritsar 7001035870 Enjoy Call Girls With Our EscortsVIP Call Girl Amritsar 7001035870 Enjoy Call Girls With Our Escorts
VIP Call Girl Amritsar 7001035870 Enjoy Call Girls With Our Escortssonatiwari757
 
Cyberagent_For New Investors_EN_240424.pdf
Cyberagent_For New Investors_EN_240424.pdfCyberagent_For New Investors_EN_240424.pdf
Cyberagent_For New Investors_EN_240424.pdfCyberAgent, Inc.
 
Sustainability Leadership, April 26 2024
Sustainability Leadership, April 26 2024Sustainability Leadership, April 26 2024
Sustainability Leadership, April 26 2024TeckResourcesLtd
 

Recently uploaded (20)

Escort Service Call Girls In Shalimar Bagh, 99530°56974 Delhi NCR
Escort Service Call Girls In Shalimar Bagh, 99530°56974 Delhi NCREscort Service Call Girls In Shalimar Bagh, 99530°56974 Delhi NCR
Escort Service Call Girls In Shalimar Bagh, 99530°56974 Delhi NCR
 
CALL ON ➥8923113531 🔝Call Girls Fazullaganj Lucknow best sexual service
CALL ON ➥8923113531 🔝Call Girls Fazullaganj Lucknow best sexual serviceCALL ON ➥8923113531 🔝Call Girls Fazullaganj Lucknow best sexual service
CALL ON ➥8923113531 🔝Call Girls Fazullaganj Lucknow best sexual service
 
Teck Investor Presentation, April 24, 2024
Teck Investor Presentation, April 24, 2024Teck Investor Presentation, April 24, 2024
Teck Investor Presentation, April 24, 2024
 
Call Girls 🫤 Mukherjee Nagar ➡️ 9999965857 ➡️ Delhi 🫦 Russian Escorts FULL ...
Call Girls 🫤 Mukherjee Nagar ➡️ 9999965857  ➡️ Delhi 🫦  Russian Escorts FULL ...Call Girls 🫤 Mukherjee Nagar ➡️ 9999965857  ➡️ Delhi 🫦  Russian Escorts FULL ...
Call Girls 🫤 Mukherjee Nagar ➡️ 9999965857 ➡️ Delhi 🫦 Russian Escorts FULL ...
 
Call Girls In Amritsar 💯Call Us 🔝 76967 34778🔝 💃 Independent Escort In Amritsar
Call Girls In Amritsar 💯Call Us 🔝 76967 34778🔝 💃 Independent Escort In AmritsarCall Girls In Amritsar 💯Call Us 🔝 76967 34778🔝 💃 Independent Escort In Amritsar
Call Girls In Amritsar 💯Call Us 🔝 76967 34778🔝 💃 Independent Escort In Amritsar
 
VIP Kolkata Call Girls Bidhannagar 8250192130 Available With Room
VIP Kolkata Call Girls Bidhannagar 8250192130 Available With RoomVIP Kolkata Call Girls Bidhannagar 8250192130 Available With Room
VIP Kolkata Call Girls Bidhannagar 8250192130 Available With Room
 
VIP 7001035870 Find & Meet Hyderabad Call Girls Shamshabad high-profile Call ...
VIP 7001035870 Find & Meet Hyderabad Call Girls Shamshabad high-profile Call ...VIP 7001035870 Find & Meet Hyderabad Call Girls Shamshabad high-profile Call ...
VIP 7001035870 Find & Meet Hyderabad Call Girls Shamshabad high-profile Call ...
 
Vip Call Girls Vasant Kunj ➡️ Delhi ➡️ 9999965857 No Advance 24HRS Live
Vip Call Girls Vasant Kunj ➡️ Delhi ➡️ 9999965857 No Advance 24HRS LiveVip Call Girls Vasant Kunj ➡️ Delhi ➡️ 9999965857 No Advance 24HRS Live
Vip Call Girls Vasant Kunj ➡️ Delhi ➡️ 9999965857 No Advance 24HRS Live
 
Collective Mining | Corporate Presentation - April 2024
Collective Mining | Corporate Presentation - April 2024Collective Mining | Corporate Presentation - April 2024
Collective Mining | Corporate Presentation - April 2024
 
Osisko Gold Royalties Ltd - Corporate Presentation, April 23, 2024
Osisko Gold Royalties Ltd - Corporate Presentation, April 23, 2024Osisko Gold Royalties Ltd - Corporate Presentation, April 23, 2024
Osisko Gold Royalties Ltd - Corporate Presentation, April 23, 2024
 
Call Girls 🫤 Hauz Khas ➡️ 9999965857 ➡️ Delhi 🫦 Russian Escorts FULL ENJOY
Call Girls 🫤 Hauz Khas ➡️ 9999965857  ➡️ Delhi 🫦  Russian Escorts FULL ENJOYCall Girls 🫤 Hauz Khas ➡️ 9999965857  ➡️ Delhi 🫦  Russian Escorts FULL ENJOY
Call Girls 🫤 Hauz Khas ➡️ 9999965857 ➡️ Delhi 🫦 Russian Escorts FULL ENJOY
 
如何办理(UTS毕业证书)悉尼科技大学毕业证学位证书
如何办理(UTS毕业证书)悉尼科技大学毕业证学位证书如何办理(UTS毕业证书)悉尼科技大学毕业证学位证书
如何办理(UTS毕业证书)悉尼科技大学毕业证学位证书
 
Nicola Mining Inc. Corporate Presentation April 2024
Nicola Mining Inc. Corporate Presentation April 2024Nicola Mining Inc. Corporate Presentation April 2024
Nicola Mining Inc. Corporate Presentation April 2024
 
Preet Vihar (Delhi) 9953330565 Escorts, Call Girls Services
Preet Vihar (Delhi) 9953330565 Escorts, Call Girls ServicesPreet Vihar (Delhi) 9953330565 Escorts, Call Girls Services
Preet Vihar (Delhi) 9953330565 Escorts, Call Girls Services
 
VIP Kolkata Call Girl Rishra 👉 8250192130 Available With Room
VIP Kolkata Call Girl Rishra 👉 8250192130  Available With RoomVIP Kolkata Call Girl Rishra 👉 8250192130  Available With Room
VIP Kolkata Call Girl Rishra 👉 8250192130 Available With Room
 
Model Call Girl in Uttam Nagar Delhi reach out to us at 🔝9953056974🔝
Model Call Girl in Uttam Nagar Delhi reach out to us at 🔝9953056974🔝Model Call Girl in Uttam Nagar Delhi reach out to us at 🔝9953056974🔝
Model Call Girl in Uttam Nagar Delhi reach out to us at 🔝9953056974🔝
 
VIP Call Girl Amritsar 7001035870 Enjoy Call Girls With Our Escorts
VIP Call Girl Amritsar 7001035870 Enjoy Call Girls With Our EscortsVIP Call Girl Amritsar 7001035870 Enjoy Call Girls With Our Escorts
VIP Call Girl Amritsar 7001035870 Enjoy Call Girls With Our Escorts
 
Cyberagent_For New Investors_EN_240424.pdf
Cyberagent_For New Investors_EN_240424.pdfCyberagent_For New Investors_EN_240424.pdf
Cyberagent_For New Investors_EN_240424.pdf
 
Call Girls 🫤 Mahipalpur ➡️ 9999965857 ➡️ Delhi 🫦 Russian Escorts FULL ENJOY
Call Girls 🫤 Mahipalpur ➡️ 9999965857  ➡️ Delhi 🫦  Russian Escorts FULL ENJOYCall Girls 🫤 Mahipalpur ➡️ 9999965857  ➡️ Delhi 🫦  Russian Escorts FULL ENJOY
Call Girls 🫤 Mahipalpur ➡️ 9999965857 ➡️ Delhi 🫦 Russian Escorts FULL ENJOY
 
Sustainability Leadership, April 26 2024
Sustainability Leadership, April 26 2024Sustainability Leadership, April 26 2024
Sustainability Leadership, April 26 2024
 

TDS Q4 2015 Earnings Presentation

  • 1. February 19, 2016 Fourth Quarter 2015 Results, 2015 Accomplishments and 2016 Strategic Priorities and Guidance
  • 2. Safe Harbor Statement Under the Private Securities Litigation Reform Act of 1995 All information set forth in this presentation, except historical and factual information, represents forward-looking statements. This includes all statements about the company’s plans, beliefs, estimates, and expectations. These statements are based on current estimates, projections, and assumptions, which involve certain risks and uncertainties that could cause actual results to differ materially from those in the forward-looking statements. Important factors that may affect these forward-looking statements include, but are not limited to: intense competition; the ability to execute TDS’ business strategy; uncertainties in TDS’ future cash flows and liquidity and access to the capital markets; the ability to make payments on TDS and U.S. Cellular indebtedness or comply with the terms of debt covenants; impacts of any pending acquisitions/divestures/exchanges of properties and/or licenses, including, but not limited to, the ability to obtain regulatory approvals, successfully complete the transactions and the financial impacts of such transactions; the ability of the company to successfully manage and grow its markets; the overall economy; the access to and pricing of unbundled network elements; the ability to obtain or maintain roaming arrangements with other carriers on acceptable terms; the state and federal telecommunications regulatory environment; the value of assets and investments; adverse changes in the ratings afforded TDS and U.S. Cellular debt securities by accredited ratings organizations; industry consolidation; advances in telecommunications technology; pending and future litigation; changes in income tax rates, laws, regulations or rulings; changes in customer growth rates, average monthly revenue per user, churn rates, roaming revenue and terms, the availability of wireless devices, or the mix of products and services offered by U.S. Cellular and TDS Telecom. Investors are encouraged to consider these and other risks and uncertainties that are discussed in documents furnished to the Securities and Exchange Commission (“SEC”). 2
  • 3. Upcoming conferences • 3/2/16 – Morgan Stanley Technology, Media and Telecom Conference (San Francisco) • 3/7/16 – Deutsche Bank 2016 Media, Internet & Telecom Conference (Palm Beach, Florida) • 3/8/16 – Raymond James 2016 Institutional Investors Conference (Orlando) 3
  • 4. TDS – Executing on Strategic Imperatives • Executing strategies to build long-term shareholder value: • Invest in our business to improve returns • Network and IT investments improving competitive position • Disciplined buyer of cable assets – no acquisitions identified in 2015 that met our investment criteria • Return value to shareholders • Increased 2016 dividend 5% -- 42nd year of dividend increases • No TDS share repurchase in 2015 • Since capital allocation ratio was announced mid-2013, $581 million invested, $196 million returned to shareholders • Support growth initiatives through sound and disciplined financing strategies • USM debt shelf will be replenished back to $500 million • Bonus depreciation aids cash flow 4
  • 5.
  • 6. 2015: Positioning for success • Customer growth • Decline in switching activity drives fewer gross additions • Significant improvement in churn evidence of high customer satisfaction • Strong Network • Completed roll-out of 4G LTE network, covering 99% of our customer base; 83% of our data traffic on this network • Ongoing VoLTE user trials • Multiple 4G LTE roaming agreements signed and customer rollout underway • Competitive product and service offerings • Strong device portfolio • Successful EIP offerings • Substantial OCF growth • Tight cost controls • Reward points • Lower gross additions and upgrades = lower transactional expenses 6
  • 7. Strategic priorities for 2016 • Drive customer growth • Grow revenues through customer growth, smartphone adoption and data monetization • Reduce unit costs • Manage investments 7
  • 8. Drive customer growth • Increase gross additions with • “best value in wireless” • high-network quality • strong device portfolio • continued expansion of equipment offerings • win-back programs • SMB/local government focus • targeted promotions • Maintain low churn 8
  • 9. Drive revenue growth • Grow customer base • Increase smartphone penetration • Monetization of growing data usage • Continue penetration of Shared Connect plans • Connected devices; increase number of devices per account • High margin revenue streams • Device protection plans • Accessory sales • Competitive pricing environment is a headwind to revenue growth 9
  • 10. Margin and investments • Trade-off between customer acquisition and margin • Manage Loss on Equipment • Longer upgrade cycle • Reduce unit costs • Capital expenditures lower with completion of 4G LTE deployment 10
  • 11. Customer results Q4 ̕15 Q4 ̕14 Postpaid gross additions 240,000 302,000 Postpaid churn 1.3% 1.6% Postpaid net additions 68,000 98,000 Prepaid net additions (losses) 7,000 (2,000) Retail net additions 75,000 96,000 Total retail customers 4,796,000 4,646,000 Feature Phones Smartphones Connected Devices Postpaid gross additions 10,000 132,000 98,000 Postpaid net additions (25,000) 23,000 70,000 11
  • 13. Smartphone sales and penetration 13
  • 14. Data usage (In MB) (In Millions) 14
  • 15. Postpaid revenue Q4’15 Q4’14 % Change Average Revenue Per User $51.46 $56.51 (9%) Add: EIP billings 7.11 2.62 >100% Average Billings Per User $58.57 $59.13 (1%) Average Revenue Per Account $131.96 $136.13 (3%) Add: EIP billings 18.23 6.31 >100% Average Billings Per Account $150.19 $142.44 5% 15
  • 16. Total operating revenues ($ in millions) Q4 ̕15 Q4 ̕14 % Change Service revenues $ 802 $ 850 (6%) Retail service 716 758 (6%) Roaming 43 50 (13%) Tower rentals (1) 14 15 (9%) Other 29 27 8% Equipment sales revenues 185 159 16% Total operating revenues $ 987 $1,009 (2%) (1) On a comparable basis excluding divested towers, tower rentals increased 12% 16
  • 17. Operating cash flow and income ($ in millions) Q4 ̕15 Q4 ̕14 % Change Total operating revenues $ 987 $1,009 (2%) System operations expense 189 202 (7%) Cost of equipment sold 274 342 (20%) SG&A expenses 387 395 (2%) Total cash expenses 850 939 (10%) Operating cash flow(1) 137 69 98% Depreciation, amortization and accretion 156 141 11% Operating income (loss) (excluding gains, losses)(1) $(19) $(72) 73% (1) Operating cash flow and operating income (excluding gains, losses) are non-GAAP financial measures that are defined in the non-GAAP reconciliation at the end of the presentation 17
  • 18. Adjusted EBITDA ($ in millions) Q4 ̕15 Q4 ̕14 % Change Operating cash flow(1) $137 $ 69 98% Equity in earnings of unconsolidated entities 30 24 29% Interest and dividend income 11 6 72% Adjusted EBITDA(1) $178 $ 99 80% (1) Operating cash flow and Adjusted EBITDA are non-GAAP financial measures that are defined in the non- GAAP reconciliation at the end of the presentation 18
  • 19. Full Year Results ($ in millions) 2015 2014 % Change Total operating revenues $3,997 $3,893 3% Operating cash flow(1) 675 338 100% Operating income (loss)(excluding gains, losses)(1) 69 (268) >100% Adjusted EBITDA(1) $852 $480 77% (1) Operating cash flow, Operating income (excluding gains, losses) and Adjusted EBITDA are non-GAAP financial measures that are defined in the non-GAAP reconciliation at the end of the presentation 19
  • 20. 2016 guidance(1) (as of 2/19/16) (in millions) 2015 Estimates(2) 2015 As Reported (2) 2015 (Excluding rewards impact)(3) 2016 Estimates (Current) Total operating revenues Approx. $4,000 $3,997 $3,939 $3,900 - $4,100 Operating cash flow(4) $540 - $620 $675 $617 $525 - $650 Adjusted EBITDA(4) $710 - $790 $852 $794 $725 - $850 Capital expenditures Approx. $600 $533 $533 Approx. $500 (1) There can be no assurance that final results will not differ materially from estimated results. (2) Includes $58 million related to termination of the rewards program (3) Total operating revenues, Operating cash flow and Adjusted EBITDA (Excluding Rewards Impact), are non-GAAP financial measures and represent Total operating revenues, Operating cash flow and Adjusted EBITDA, respectively, less the $58 million impact of the termination of the rewards program in 2015. U.S. Cellular believes that such measures are useful to show such the impact of the termination of the rewards program on such measures. (4) Operating cash flow and Adjusted EBITDA are non-GAAP financial measures that are defined in the non-GAAP reconciliation at the end of the presentation. 20
  • 21. 21
  • 22. 2015: Positioning for success • Wireline • Strong Fiber/IPTV results; TDS TV in 27 markets covering 23% of service addresses • Strong ARPUs • Legacy voice lines – losses moderating • Cable • Total residential connections growth of 6% • Broadband penetration increasing • Product quality improvements at former Baja markets; rebranded as TDS • HMS • Strong equipment revenue growth • Recurring service revenue growth still below expectations • Productivity and cost control initiatives 22
  • 23. 2016 strategic priorities • Wireline • Complete targeted fiber deployment; increase broadband and IPTV penetration in existing markets • Potential for CAF II funding • Capital intensity declines • Cable • Increase residential and commercial broadband customer connections • Leverage Wireline capabilities to create additional synergies • Continue to evaluate potential acquisitions • Hosted and Managed Services • Focus on growth of recurring service revenues • Sell across entire portfolio • Utilize new data center capacity 23
  • 24. TDS Telecom operating performance ($ in millions) Q4 ̕15 Q4 ̕14 % Change Wireline $174 $180 (4%) Cable 43 43 --- HMS 69 60 14% Total operating revenues(1) 284 282 1% Expenses(1)(2) 214 206 4% Adjusted EBITDA(3) $71 $77 (8%) (1) Reflects intercompany eliminations. (2) Represents cost of products and services and selling, general and administrative expenses. (3) Adjusted EBITDA is a non-GAAP financial measure that is defined in the non-GAAP reconciliation at the end of the presentation. 24
  • 25. Wireline operating performance ($ in millions) Q4 ̕15 Q4 ̕14 % Change Residential $73 $74 (1%) Commercial 54 57 (4%) Wholesale 46 49 (6%) Total service revenues 173 180 (4%) Expenses(1) 116 114 2% Adjusted EBITDA(2) $59 $67 (13%) (1) Represents cost of products and services and selling, general and administrative expenses. (2) Adjusted EBITDA is a non-GAAP financial measure that is defined in the non-GAAP reconciliation at the end of the presentation. 25
  • 26. Broadband speeds, IPTV and managedIP contributing revenue growth 12/31/15 12/31/14 > 5 Mb 86% 83% > 10 Mb 47% 41% > 25 Mb 16% 11% 12/31/15 (As reported)* 12/31/14 $41.24 $41.56 Wireline Residential Average Revenue Per Connection ILEC Residential Customers by Broadband Speeds 12/31/15 12/31/14 IPTV 34,400 23,400 IPTV Connections 12/31/15 12/31/14 $52.93 $52.57 Wireline Commercial ARPU per Connection * Excluding one-time items, ARPU was $43.15 26
  • 27. Cable snapshot 12/31/15 12/31/14 % Change Video 106,800 110,300 (3%) Broadband 117,100 110,900 6% Voice 56,400 46,000 23% Total cable connections 280,300 267,300 5% Industry 9/30/15 TDS Cable 12/31/15 Video 40% 33% Broadband 44% 36% Voice 22% 17% (1) Represents cost of products and services and selling, general and administrative expenses. (2) Adjusted EBITDA is a non-GAAP financial measure that is defined in the non-GAAP reconciliation at the end of the presentation. ($ in millions) Q4 ̕15 Q4 ̕14 % Change Total operating revenues $43 $43 -- Expenses(1) 32 33 (1%) Adjusted EBITDA(2) $10 $11 -- Connections Operating Performance Penetration 27
  • 28. Hosted and Managed Services operating performance ($ in millions) Q4 ̕15 Q4 ̕14 % Change Service revenues $29 $27 6% Equipment revenues 40 33 21% Total operating revenues 69 60 14% Expenses(1) 67 61 10% Adjusted EBITDA(2) $1 $(1) >100% (1) Represents cost of products and services and selling, general and administrative expenses. (2) Adjusted EBITDA is a non-GAAP financial measure that is defined in the non-GAAP reconciliation at the end of the presentation. 28
  • 29. Full Year Results ($ in millions) 2015 2014 % Change Wireline $ 701 $ 716 (2%) Cable 175 117 50% HMS 287 259 11% Total operating revenues(1) 1,158 1,088 6% Adjusted EBITDA(2) 306 298 3% Capital Expenditures $ 219 $ 208 5% (1) Reflects intercompany eliminations (2) Adjusted EBITDA is a non-GAAP financial measure that is defined in the non-GAAP reconciliation at the end of the presentation 29
  • 30. 2016 TDS Telecom guidance(1) (as of 2/19/16) ($ in millions) 2015 Estimate 2015 Actual 2016 Estimates (Current) Total operating revenues $1,130 - $1,180 $1,158 $1,130 - $1,180 Operating cash flow(2) $280 - $310 $304 $270 - $310 Adjusted EBITDA(2) $280 - $310 $306 $270 - $310 Capital expenditures Approx. $220 $219 Approx. $180 (1) There can be no assurance that final results will not differ materially from such estimated results. (2) Operating cash flow and Adjusted EBITDA are non-GAAP financial measures that are defined in the non- GAAP reconciliation at the end of the presentation. 30
  • 32. Operating Cash Flow and Adjusted EBITDA Reconciliation – Q4 2015 and Q4 2014 Actual Results Actual Results Three months ended Dec. 31, 2015 Three months ended Dec. 31, 2014 U.S. Cellular Wireline Cable HMS Total TDS Telecom TDS (2) U.S. Cellular Wireline Cable HMS Total TDS Telecom TDS (2) ($ in millions) Net income (loss) (GAAP) (3) 12 (1) (4) 8 (2) (22) 5 1 6 12 (21) Add back: Income tax expense (benefit) (5) 10 1 (3) 8 (7) (13) 19 --- (14) 5 (12) Income (loss) before income taxes (GAAP) ($8) $22 --- ($7) $16 ($9) ($35) $24 $1 ($8) $17 ($33) Add back: Interest expense 25 --- --- 1 --- 39 15 (1) --- --- --- 28 Depreciation, amortization and accretion expense 156 41 9 7 58 216 141 43 9 7 58 202 EBITDA $174 $64 $9 $1 $74 $246 $121 $68 $9 ($1) $76 $196 Add back: Loss on impairment of assets --- --- --- --- --- --- --- --- --- --- --- 4 (Gain) loss on assets disposals, net 4 2 1 --- 3 7 5 1 1 --- 2 7 (Gain) loss on sale of business and other exit costs, net --- (6) --- --- (6) (6) (5) --- --- --- --- (7) (Gain) loss on license sales and exchanges, net --- --- --- --- --- --- (22) --- --- --- --- (22) Adjusted EBITDA (3) $178 $59 $10 $1 $71 $247 $99 $68 $11 ($1) $78 $179 Deduct: Equity in earnings of unconsolidated entities 30 --- --- --- --- 30 24 --- --- --- --- 24 Interest and dividend income 11 1 --- --- --- 11 6 1 --- --- --- 7 Operating cash flow (3)(4) $137 $59 $10 $1 $71 $206 $69 $67 $11 ($1) $77 $148 Deduct: Depreciation, amortization and accretion expense 156 141 Operating income (loss) (excluding gains, losses) ($19) ($72) (2) (3) (4) – see notes at the end of this presentation 32
  • 33. Operating Cash Flow and Adjusted EBITDA Reconciliation – 2016 Estimated, 2015 and 2014 Full Year Actual Results ($ in millions) (1) (2) (3) (4) (5) – see notes at the end of this presentation 2016 Estimate (1) 2015 Estimate (1) 2015 Actual 2014 Actual 2016 Estimate (1) 2015 Estimate (1) 2015 Actual 2014 Actual Net Income (loss) (GAAP) N/A N/A 247 (47) N/A N/A 46 (24) Add back: Income tax expense (benefit) N/A N/A 156 (12) N/A N/A 35 18 Income (loss) before income taxes (loss) (GAAP) $0 - $125 $275-$355 $404 ($59) $40- $80 $45-$75 $81 ($7) Add back: Interest expense 105 80 86 57 -- -- 1 (1) Depreciation, amortization and accretion 600 600 606 606 230 235 228 220 EBITDA $705-$830 $955-$1,035 $1,096 $605 $270 - $310 $280-$310 $310 $212 Add back: Loss on impairment of assets --- --- --- --- -- --- --- 84 (Gain) loss on sale of business and other exit costs, net --- (115) (114) (33) -- (5) (10) (2) (Gain) loss on license sales and exchanges (5) --- (145) (147) (113) -- --- --- --- (Gain) loss on asset disposals, net 20 15 16 21 -- 5 6 5 Adjusted EBITDA (2) $725-$850 $710-$790 $852 $480 $270 -$310 $280-$310 $306 $298 Deduct: Equity in earnings of unconsolidated entities (140) (135) (140) (130) -- -- --- --- Interest and dividend income (60) (35) (37) (12) -- -- (2) (2) Operating cash flow (2) (3) (4) $525-$650 $540--$620 $675 $338 $270 - $310 $280-$310 $304 $296 Dediuct: Total Depreciation, Amortization and Accretion (606) (606) Operating Income (loss) (excluding gains, losses) $69 ($268) U.S. Cellular TDS Telecom 33
  • 34. (1) In providing 2016 and 2015 Estimated Results, TDS has not completed the above reconciliation to net income because it does not provide guidance for income taxes. TDS believes that the impact of income taxes cannot be reasonably predicted; therefore, the company is unable to provide such guidance. (2) The TDS column includes U.S. Cellular, TDS Telecom and also the impacts of consolidating eliminations, corporate operations and non-reportable segments, all of which are not presented above. (3) Operating cash flow is defined as net income, adjusted for the items set forth in the reconciliation above. Adjusted EBITDA (earnings before interest, taxes, depreciation, amortization and accretion), is defined as net income, adjusted for the items set forth in the reconciliation above. Operating income (loss) (excluding gains and losses), is defined as net income, adjusted for the items set forth in the reconciliation above. Operating cash flow, Adjusted EBITDA and Operating income (loss) (excluding gains and losses) exclude these items in order to show operating results on a more comparable basis from period to period. From time to time, TDS may exclude other items from Operating cash flow and/or Adjusted EBITDA and/or Operating income (loss) (excluding gains and losses) if such items help reflect operating results on a more comparable basis. TDS does not intend to imply that any such items that are excluded are non-recurring, infrequent or unusual; such items may occur in the future. Operating cash flow, Adjusted EBITDA and Operating income (loss) (excluding gains and losses) are not measures of financial performance under Generally Accepted Accounting Principles in the United States (“GAAP”) and should not be considered as alternatives to net income as indicators of the company’s operating performance or as alternatives to cash flows from operating activities, determined in accordance with GAAP, as indicators of cash flows or as measures of liquidity. TDS believes Operating cash flow, Adjusted EBITDA and Operating income (loss) (excluding gains and losses) are useful measures of TDS’ operating results before significant recurring non-cash charges, gains and losses, and other items as indicated above. (4) A reconciliation of Operating cash flow (Non-GAAP) and Operating income (excluding gains and losses) (Non-GAAP) to operating income (GAAP) for Dec. 31, 2015 actual results can be found on the company's website at investors.tdsinc.com. (5) In February 2016, U.S. Cellular entered into multiple agreements to exchange licenses. Agreements are subject to regulatory approval and other customary closing conditions, and are expected to close in 2016. Upon closing of the transactions, U.S. Cellular expects to record a gain. A reasonable estimate of the gains is unavailable at the time of this filing. 34