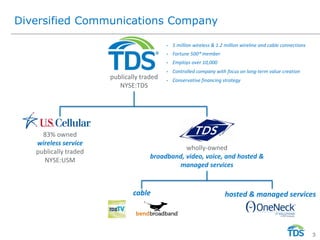
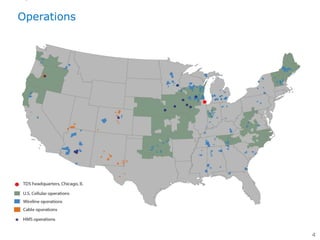
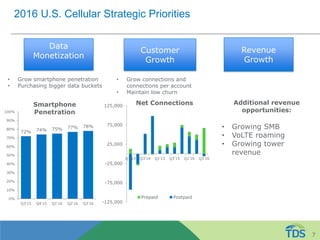
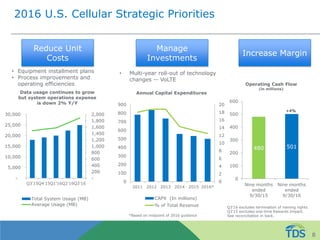
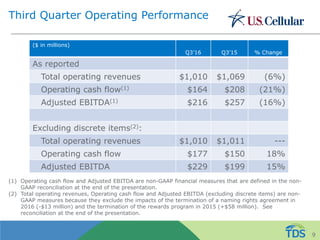
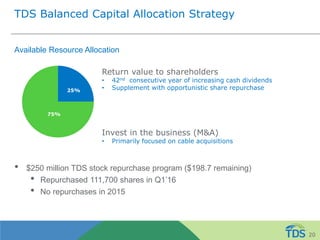
2016 Southwest IDEAS Investor Conference
Dallas
November 16, 2016
Safe Harbor Statement
All information set forth in this presentation, except historical and factual information,
represents forward-looking statements. This includes all statements about the company’s plans,
beliefs, estimates, and expectations. These statements are based on current estimates,
projections, and assumptions, which involve certain risks and uncertainties that could cause
actual results to differ materially from those in the forward-looking statements. Important
factors that may affect these forward-looking statements include, but are not limited to:
intense competition; the ability to execute TDS’ business strategy; uncertainties in TDS’ future
cash flows and liquidity and access to the capital markets; the ability to make payments on TDS
and U.S. Cellular indebtedness or comply with the terms of debt covenants; impacts of any
pending acquisitions/divestitures/exchanges of properties and/or licenses, including, but not
limited to, the ability to obtain regulatory approvals, successfully complete the transactions and
the financial impacts of such transactions; the ability of the company to successfully manage
and grow its markets; the overall economy; the access to and pricing of unbundled network
elements; the ability to obtain or maintain roaming arrangements with other carriers on
acceptable terms; the state and federal telecommunications regulatory environment; the value
of assets and investments; adverse changes in the ratings afforded TDS and U.S. Cellular debt
securities by accredited ratings organizations; industry consolidation; advances in
telecommunications technology; pending and future litigation; changes in income tax rates,
laws, regulations or rulings; changes in customer growth rates, average monthly revenue per
user, churn rates, roaming revenue and terms, the availability of wireless devices, or the mix of
products and services offered by U.S. Cellular and TDS Telecom. Investors are encouraged to
consider these and other risks and uncertainties that are discussed in documents furnished to
the Securities and Exchange Commission.
2
Diversified Communications Company
publically traded
NYSE:TDS
83% owned
wireless service
publically traded
NYSE:USM
wholly-owned
broadband, video, voice, and hosted &
managed services
• 5 million wireless & 1.2 million wireline and cable connections
• Fortune 500® member
• Employs over 10,000
• Controlled company with focus on long-term value creation
• Conservative financing strategy
cable hosted & managed services
3
Operations
4
5
Differentiating U.S. Cellular
Provide an exceptional customer experience
• Award-winning network quality and high speed LTE network
• Competitive products and services priced to offer the best value in the
industry
• Outstanding service in every customer interaction
• Targeting key postpaid customer segments, such as families and small-
medium sized businesses
• Local focus – serving rural and suburban markets
6
2016 U.S. Cellular Strategic Priorities
Customer
Growth
Revenue
Growth
Data
Monetization
• Grow connections and
connections per account
• Maintain low churn
• Grow smartphone penetration
• Purchasing bigger data buckets
-125,000
-75,000
-25,000
25,000
75,000
125,000
Q1'14 Q3'14 Q1'15 Q3'15 Q1'16 Q3'16
Net Connections
Prepaid Postpaid
72% 74% 75% 77% 78%
0%
10%
20%
30%
40%
50%
60%
70%
80%
90%
100%
Q3'15 Q4'15 Q1'16 Q2'16 Q3'16
Smartphone
Penetration
Additional revenue
opportunities:
• Growing SMB
• VoLTE roaming
• Growing tower
revenue
7
2016 U.S. Cellular Strategic Priorities
Reduce Unit
Costs
Manage
Investments
Increase Margin
• Equipment installment plans
• Process improvements and
operating efficiencies
• Multi-year roll-out of technology
changes -- VoLTE
-
200
400
600
800
1,000
1,200
1,400
1,600
1,800
2,000
-
5,000
10,000
15,000
20,000
25,000
30,000
Q3'15Q4'15Q1'16Q2'16Q3'16
Data usage continues to grow
but system operations expense
is down 2% Y/Y
Total System Usage (MB)
Average Usage (MB)
0
2
4
6
8
10
12
14
16
18
20
0
100
200
300
400
500
600
700
800
900
2011 2012 2013 2014 2015 2016*
Annual Capital Expenditures
CAPX (In millions)
% of Total Revenue
*Based on midpoint of 2016 guidance
Q3’16 excludes termination of naming rights.
Q3’15 excludes one-time Rewards Impact.
See reconciliation in back.
480 501
0
100
200
300
400
500
600
Nine months
ended
9/30/15
Nine months
ended
9/30/16
Operating Cash Flow
(in millions)
+4%
8
Third Quarter Operating Performance
($ in millions)
Q3’16 Q3’15 % Change
As reported
Total operating revenues $1,010 $1,069 (6%)
Operating cash flow(1) $164 $208 (21%)
Adjusted EBITDA(1) $216 $257 (16%)
Excluding discrete items(2):
Total operating revenues $1,010 $1,011 ---
Operating cash flow $177 $150 18%
Adjusted EBITDA $229 $199 15%
(1) Operating cash flow and Adjusted EBITDA are non-GAAP financial measures that are defined in the non-
GAAP reconciliation at the end of the presentation.
(2) Total operating revenues, Operating cash flow and Adjusted EBITDA (excluding discrete items) are non-
GAAP measures because they exclude the impacts of the termination of a naming rights agreement in
2016 (-$13 million) and the termination of the rewards program in 2015 (+$58 million). See
reconciliation at the end of the presentation.
9
Investing in future
4G LTE expansion complete
VoLTE deployment will provide additional roaming opportunities
• Completed friendly user trials
• First commercial deployment in one market in the first quarter 2017
• Remaining markets will be deployed over multi-years
• VoLTE will provide additional opportunities to roam with new carriers
(GSM carriers)
Strong network
• U.S. Cellular’s significant low-band spectrum position provides a competitive
advantage in serving its suburban and rural customers.
• U.S. Cellular has filed to participate in the upcoming auction (Auction 1002)
for 600 MHz spectrum. FCC anti-collusion rules prohibit further disclosures.
10
Valuable Assets
Tower Strategy – 4,015 owned towers
• We still consider our towers to be strategic
• Advantages to owning towers:
• Ensures best location on tower and flexibility to move equipment
• Negotiating leverage with other carriers
• High margin revenues
• Important to have control of towers during technology change
Spectrum Holdings
Ownership in a number of partnerships
• Recorded in equity of unconsolidated entities on income statement
• 5.5% of Los Angeles SMSA Limited Partnership “LA Partnership” is biggest
contributor
11
Equity in unconsolidated entities 3Q’16 3Q’15
LA Partnership $17 $19
All other partnerships 21 21
Total $38 $40
12
TDS Telecom
• Residential Wireline – focus
on broadband offerings,
including voice and video;
bundled services
• Commercial Wireline –
focused on small & medium
business (SMB) customers
• Cable – expand broadband
offerings while leveraging
TDS Telecom expertise
• HMS – grow recurring
revenue by targeting
medium sized businesses
and provide a wide-range of
services
TDS Telecom is a wholly-owned subsidiary of TDS
13
2016 strategic priorities
•Complete planned targeted fiber deployment; increase
broadband and IPTV penetration in existing markets
•Capital intensity declines driving higher free cash flow
Wireline
•Increase residential and commercial broadband
customer connections
•Continue to evaluate potential acquisitions
Cable
•Focus on growth of recurring service revenues
•Sell across entire portfolio
•Utilize new data center capacity
Hosted and
Managed
Services
14
Wireline focused on delivering
Broadband
Wireline Strategy:
• Fiber Strategy in most attractive markets (~25% IPTV-capable service addresses)
• Complete targeted fiber deployment
• Increase broadband and IPTV connections
• Capital intensity declines as program completes
• Strategy in lower density markets
• Deploy copper bonding to ~20% of service addresses to provide up to 50Mbps
• Evaluating the USF Reform Order funding options in areas with no competition
(~ up to 30% of service addresses)
Q3’15 Q3’16
%
Change
(Y/Y)
IPTV connections 30,300 43,600 44%
Residential revenue per connection $42.83 $44.25 3%
managedIP connections 145,900 151,500 4%
Q3’15 Q3’16
Take rate % at 10 MB or higher 45% 52%
Take rate % at 25 MB or higher 14% 21%
15
Cable Acquisitions Support Profitable
Growth
• Natural extension to existing businesses
• ARPU growth potential in bundling, high-margin data, add-on services
• Operating synergies through existing platform, technologies, and expertise
• Significant SMB commercial growth potential in underserved markets
• Provides high-capacity pipe into the home
• Attractive competitive landscape and market demographics
Baja Broadband (now rebranded TDS) Bend Broadband
16
17
TDS Telecom operating performance
($ in millions)
Q3’16 Q3’15
%
Change
Wireline $175 $175 ---
Cable 46 44 5%
HMS 68 82 (17%)
Total operating revenues (1) 287 299 (4%)
Expenses (1)(2) 217 224 (3%)
Adjusted EBITDA (3) $ 71 $ 76 (7%)
(1) Reflects intercompany eliminations
(2) Represents cost of products and services and selling, general and administrative expenses
(3) Adjusted EBITDA is a non-GAAP financial measure that is defined in the non-GAAP
reconciliation at the end of the presentation.
18
19
TDS Balanced Capital Allocation Strategy
Available Resource Allocation
• $250 million TDS stock repurchase program ($198.7 remaining)
• Repurchased 111,700 shares in Q1’16
• No repurchases in 2015
25%
75%
Return value to shareholders
• 42nd consecutive year of increasing cash dividends
• Supplement with opportunistic share repurchase
Invest in the business (M&A)
• Primarily focused on cable acquisitions
20
Delivering Value to Shareholders
Annual Dividends
Per TDS Share
Shares Repurchased
* Retroactively adjusted for the effect of 2005 stock dividend.
• TDS - 42 years of consecutive dividend increases
• June 25, 2013 - U.S. Cellular paid $5.75 per share special cash dividend
Repurchased $994 M
0
1
2
3
4
5
6
7
8
2007 2008 2009 2010 2011 2012 2013 2014 2015 2016
TDS USM
Inmillions
$0.00
$0.10
$0.20
$0.30
$0.40
$0.50
$0.60
$0.70
21
Conservative Financial Foundation
Aligning debt maturities with long lived assets
Call options on most company debt securities give the company
the flexibility to repay or refinance its debt as conditions warrant.
22
Appendix
23
Operating Cash Flow and Adjusted EBITDA Reconciliation –
Q3 2016 and Q3 2015
($ in millions)
U.S.
Cellular
(as
reported)
U.S.
Cellular
(excluding
termination
of naming
rights) Wireline Cable HMS
Total
TDS
Telecom TDS (1)
U.S.
Cellular
(as
reported)
U.S.
Cellular
(excluding
rewards
impact) Wireline Cable HMS
Total
TDS
Telecom TDS (1)
Net income (loss) (GAAP) $18 N/A N/A N/A N/A $7 $16 $65 N/A N/A N/A N/A $9 $62
Add back:
Income tax expense (benefit) 15 N/A N/A N/A N/A 4 14 41 N/A N/A N/A N/A 8 46
Income (loss) before income taxes (GAAP) $33 $46 $17 -- $(6) $11 $30 $106 $48 $19 $1 $(2) $17 $108
Add back:
Interest expense 28 28 -- -- 1 1 42 21 21 -- -- 1 -- 35
Depreciation, amortization and accretion expense 155 155 41 9 7 57 214 152 152 41 9 7 57 211
EBITDA (non-GAAP) $216 $229 $57 $9 $3 $69 $286 $279 $221 $60 $10 $5 $74 $354
Add back:
(Gain) loss on assets disposals, net 7 7 1 1 -- 2 8 3 3 2 -- -- 2 5
(Gain) loss on sale of business and other exit costs, net --- --- -- -- -- -- -- (1) (1) -- -- -- -- (1)
(Gain) loss on license sales and exchanges, net (7) (7) -- -- -- -- (7) (24) (24) -- -- -- -- (24)
Adjusted EBITDA (2) (non-GAAP) $216 $229 $58 $10 $3 $71 $287 $257 $199 $61 $10 $5 $76 $334
Deduct:
Equity in earnings of unconsolidated entities 38 38 -- -- -- -- 38 40 40 -- -- -- -- 40
Interest and dividend income 14 14 1 -- -- 1 15 9 9 1 -- -- 1 10
Other, net -- --- -- -- -- -- (1) --- --- -- -- -- -- --
Operating cash flow (2) (3) (non-GAAP) $164 $177 $57 $10 $3 $70 $235 $208 $150 $61 $10 $5 $76 $284
Three months ended Sept. 30, 2016 Three months ended Sept. 30, 2015
In providing 2016 and 2015 Estimated Results, TDS has not completed the below reconciliation to net
income because it does not provide guidance for income taxes. TDS believes that the impact of income
taxes cannot be reasonably predicted; therefore, the company is unable to provide such guidance.
24
Operating Cash Flow and Adjusted EBITDA Reconciliation –
($ in millions)
U.S. Cellular (as reported)
U.S. Cellular (excluding
termination of naming rights) U.S. Cellular (as reported)
U.S. Cellular (excluding
rewards impact)
Net income (loss) (GAAP) $54 N/A $250 N/A
Add back:
Income tax expense (benefit) 39 N/A 161 N/A
Income (loss) before income taxes (GAAP) $93 $106 $411 $353
Add back:
Interest expense 84 84 61 61
Depreciation, amortization and accretion expense 462 462 450 450
EBITDA (non-GAAP) $639 $652 $922 $864
Add back:
(Gain) loss on assets disposals, net 16 16 12 12
(Gain) loss on sale of business and other exit costs, net --- --- (114) (114)
(Gain) loss on license sales and exchanges, net (16) (16) (147) (147)
Adjusted EBITDA (1) (non-GAAP) $639 $652 $673 $615
Deduct:
Equity in earnings of unconsolidated entities 110 110 110 110
Interest and dividend income 41 41 26 26
Other, net -- -- (1) (1)
Operating cash flow (1) (2) (non-GAAP) $488 $501 $538 $480
Nine months ended Sept. 30, 2016 Nine months ended Sept. 30, 2015
In providing 2016 and 2015 Estimated Results, TDS has not completed the below reconciliation to net
income because it does not provide guidance for income taxes. TDS believes that the impact of income
taxes cannot be reasonably predicted; therefore, the company is unable to provide such guidance.
25
Operating Cash Flow and Adjusted EBITDA Reconciliation –
2016 Estimated
2016 Estimated Results Actual Results Year ended December 31, 2015
(Dollars in millions)
U.S. Cellular TDS Telecom TDS(1) U.S. Cellular TDS Telecom TDS (1)
Net income (loss) (GAAP)
N/A N/A N/A $247 $46 $263
Add back:
Income tax expense (benefit)
N/A N/A N/A 156 35 172
Income (loss) before income taxes (GAAP)
$(5)-$120 40-80 $(25)-$140 $404 81 $435
Add back:
Interest expense
110 ― 165 86 1 142
Depreciation, amortization and accretion
615 230 855 606 228 844
EBITDA
$720-$845 270-310 $995-$1,160 $1,096 310 $1,421
Add back:
(Gain) loss on sale of business and other exit costs, net
― ― ― (114) (10) (136)
(Gain) loss on license sales and exchanges (4)
(15) ― (15) (147) — (147)
(Gain) loss on assets disposals, net
20 ― 20 16 6 22
Adjusted EBITDA (2)
$725-$850 270-310 $1,000-$1,165 $852 306 $1,160
Deduct:
Equity in earnings of unconsolidated entities
140 ― 140 140 — 140
Interest and dividend income
60 ― 60 37 2 39
Operating cash flow (2)(3)
$525-$650 270-310 $800-$965 $675 304 $981
26
Three months
ended 9/30/15
Three months
ended 9/30/15
Three months
ended 9/30/15
Full Year-end
12/31/15
Full Year-end
12/31/15
Full Year-end
12/31/15
(in millions)
As reported
(GAAP) Rewards Impact
Excluding rewards
impact (non-GAAP)
As reported
(GAAP)
Rewards
Impact
Excluding
rewards impact
(non-GAAP)
Service revenues $ 896 $(58) $ 838 $3,350 $(58) $3,292
Retail service 797 (58) 739 2,994 (58) 2,936
Roaming 59 --- 59 192 --- 192
Tower rentals 13 --- 13 53 --- 53
Other 27 --- 27 111 --- 111
Equipment sales revenue 173 --- 173 647 --- 647
Total operating revenues $1,069 $(58) $1,011 $3,997 $(58) $3,939
System operation expense 199 --- 199 775 --- 775
Cost of equipment sold 287 --- 287 1,053 --- 1,053
SG&A 375 --- 375 1,494 --- 1,494
Total cash expenses 861 --- 861 3,322 --- 3,322
Operating cash flow (non-GAAP) $208 $(58) $150 675 $(58) $617
Equity in earnings of
unconsolidated entities
40 --- 40 140 --- 140
Interest and dividend income 9 --- 9 37 --- 37
Adjusted EBITDA (non-GAAP) $257 $(58) $199 $852 $(58) $794
U.S. Cellular Rewards Impact Reconciliation
As previously described, this table reconciles GAAP measures to non-GAAP measures showing the impact of $58 million related to the
termination of the rewards program. 27
(1) The TDS column includes U.S. Cellular, TDS Telecom and also the impacts of consolidating eliminations, corporate
operations and non-reportable segments, all of which are not presented above.
(2) Adjusted EBITDA (earnings before interest, taxes, depreciation, amortization and accretion) is defined as net income
adjusted for the items set forth in the reconciliation above. Operating cash flow is defined as net income adjusted for
the items set forth in the reconciliation above. Adjusted EBITDA and Operating cash flow are not measures of
financial performance under Generally Accepted Accounting Principles in the United States (“GAAP”) and should not be
considered as alternatives to Net income or Cash flows from operating activities, as indicators of cash flows or as
measures of liquidity. TDS does not intend to imply that any such items set forth in the reconciliation above are non-
recurring, infrequent or unusual; such items may occur in the future. Management uses Adjusted EBITDA and
Operating cash flow as measurements of profitability, and therefore reconciliations to applicable GAAP income
measures are deemed most appropriate. Management believes Adjusted EBITDA and Operating cash flow are useful
measures of TDS’ operating results before significant recurring non-cash charges, gains and losses, and other items
as presented above as they provide additional relevant and useful information to investors and other users of TDS’
financial data in evaluating the effectiveness of its operations and underlying business trends in a manner that is
consistent with management’s evaluation of business performance. Adjusted EBITDA shows adjusted earnings before
interest, taxes, depreciation, amortization and accretion and gains and losses, while Operating cash flow reduces this
measure further to exclude Equity in earnings of unconsolidated entities and Interest and dividend income in order to
more effectively show the performance of operating activities excluding investment activities. The table above
reconciles Adjusted EBITDA and Operating cash flow to the corresponding GAAP measure, Net income or Income
(loss) before income taxes.
(3) A reconciliation of Operating cash flow (Non-GAAP) and Operating income (excluding gains and losses) (Non-GAAP) to
operating income (GAAP) for September 30, 2016 actual results can be found on the company's website at
investors.tdsinc.com.
(4) In 2016, U.S. Cellular entered into multiple agreements to exchange licenses. Agreements are subject to regulatory
approval and other customary closing conditions, and are expected to close in the fourth quarter of 2016. Upon
closing of the transactions, U.S. Cellular expects to record a gain. As of September 30, 2016 two license closings
occurred and U.S. Cellular recorded a gain of $16 million. For the remainder of the licenses a reasonable estimate of
the gains is unavailable at the time of this filing.
28
TDS’ mission is to provide outstanding
communications services to our customers and
meet the needs of our shareholders, our people
and our communities.
29

Ideas conference dallas final

  • 1.
    2016 Southwest IDEASInvestor Conference Dallas November 16, 2016
  • 2.
    Safe Harbor Statement Allinformation set forth in this presentation, except historical and factual information, represents forward-looking statements. This includes all statements about the company’s plans, beliefs, estimates, and expectations. These statements are based on current estimates, projections, and assumptions, which involve certain risks and uncertainties that could cause actual results to differ materially from those in the forward-looking statements. Important factors that may affect these forward-looking statements include, but are not limited to: intense competition; the ability to execute TDS’ business strategy; uncertainties in TDS’ future cash flows and liquidity and access to the capital markets; the ability to make payments on TDS and U.S. Cellular indebtedness or comply with the terms of debt covenants; impacts of any pending acquisitions/divestitures/exchanges of properties and/or licenses, including, but not limited to, the ability to obtain regulatory approvals, successfully complete the transactions and the financial impacts of such transactions; the ability of the company to successfully manage and grow its markets; the overall economy; the access to and pricing of unbundled network elements; the ability to obtain or maintain roaming arrangements with other carriers on acceptable terms; the state and federal telecommunications regulatory environment; the value of assets and investments; adverse changes in the ratings afforded TDS and U.S. Cellular debt securities by accredited ratings organizations; industry consolidation; advances in telecommunications technology; pending and future litigation; changes in income tax rates, laws, regulations or rulings; changes in customer growth rates, average monthly revenue per user, churn rates, roaming revenue and terms, the availability of wireless devices, or the mix of products and services offered by U.S. Cellular and TDS Telecom. Investors are encouraged to consider these and other risks and uncertainties that are discussed in documents furnished to the Securities and Exchange Commission. 2
  • 3.
    Diversified Communications Company publicallytraded NYSE:TDS 83% owned wireless service publically traded NYSE:USM wholly-owned broadband, video, voice, and hosted & managed services • 5 million wireless & 1.2 million wireline and cable connections • Fortune 500® member • Employs over 10,000 • Controlled company with focus on long-term value creation • Conservative financing strategy cable hosted & managed services 3
  • 4.
  • 5.
  • 6.
    Differentiating U.S. Cellular Providean exceptional customer experience • Award-winning network quality and high speed LTE network • Competitive products and services priced to offer the best value in the industry • Outstanding service in every customer interaction • Targeting key postpaid customer segments, such as families and small- medium sized businesses • Local focus – serving rural and suburban markets 6
  • 7.
    2016 U.S. CellularStrategic Priorities Customer Growth Revenue Growth Data Monetization • Grow connections and connections per account • Maintain low churn • Grow smartphone penetration • Purchasing bigger data buckets -125,000 -75,000 -25,000 25,000 75,000 125,000 Q1'14 Q3'14 Q1'15 Q3'15 Q1'16 Q3'16 Net Connections Prepaid Postpaid 72% 74% 75% 77% 78% 0% 10% 20% 30% 40% 50% 60% 70% 80% 90% 100% Q3'15 Q4'15 Q1'16 Q2'16 Q3'16 Smartphone Penetration Additional revenue opportunities: • Growing SMB • VoLTE roaming • Growing tower revenue 7
  • 8.
    2016 U.S. CellularStrategic Priorities Reduce Unit Costs Manage Investments Increase Margin • Equipment installment plans • Process improvements and operating efficiencies • Multi-year roll-out of technology changes -- VoLTE - 200 400 600 800 1,000 1,200 1,400 1,600 1,800 2,000 - 5,000 10,000 15,000 20,000 25,000 30,000 Q3'15Q4'15Q1'16Q2'16Q3'16 Data usage continues to grow but system operations expense is down 2% Y/Y Total System Usage (MB) Average Usage (MB) 0 2 4 6 8 10 12 14 16 18 20 0 100 200 300 400 500 600 700 800 900 2011 2012 2013 2014 2015 2016* Annual Capital Expenditures CAPX (In millions) % of Total Revenue *Based on midpoint of 2016 guidance Q3’16 excludes termination of naming rights. Q3’15 excludes one-time Rewards Impact. See reconciliation in back. 480 501 0 100 200 300 400 500 600 Nine months ended 9/30/15 Nine months ended 9/30/16 Operating Cash Flow (in millions) +4% 8
  • 9.
    Third Quarter OperatingPerformance ($ in millions) Q3’16 Q3’15 % Change As reported Total operating revenues $1,010 $1,069 (6%) Operating cash flow(1) $164 $208 (21%) Adjusted EBITDA(1) $216 $257 (16%) Excluding discrete items(2): Total operating revenues $1,010 $1,011 --- Operating cash flow $177 $150 18% Adjusted EBITDA $229 $199 15% (1) Operating cash flow and Adjusted EBITDA are non-GAAP financial measures that are defined in the non- GAAP reconciliation at the end of the presentation. (2) Total operating revenues, Operating cash flow and Adjusted EBITDA (excluding discrete items) are non- GAAP measures because they exclude the impacts of the termination of a naming rights agreement in 2016 (-$13 million) and the termination of the rewards program in 2015 (+$58 million). See reconciliation at the end of the presentation. 9
  • 10.
    Investing in future 4GLTE expansion complete VoLTE deployment will provide additional roaming opportunities • Completed friendly user trials • First commercial deployment in one market in the first quarter 2017 • Remaining markets will be deployed over multi-years • VoLTE will provide additional opportunities to roam with new carriers (GSM carriers) Strong network • U.S. Cellular’s significant low-band spectrum position provides a competitive advantage in serving its suburban and rural customers. • U.S. Cellular has filed to participate in the upcoming auction (Auction 1002) for 600 MHz spectrum. FCC anti-collusion rules prohibit further disclosures. 10
  • 11.
    Valuable Assets Tower Strategy– 4,015 owned towers • We still consider our towers to be strategic • Advantages to owning towers: • Ensures best location on tower and flexibility to move equipment • Negotiating leverage with other carriers • High margin revenues • Important to have control of towers during technology change Spectrum Holdings Ownership in a number of partnerships • Recorded in equity of unconsolidated entities on income statement • 5.5% of Los Angeles SMSA Limited Partnership “LA Partnership” is biggest contributor 11 Equity in unconsolidated entities 3Q’16 3Q’15 LA Partnership $17 $19 All other partnerships 21 21 Total $38 $40
  • 12.
  • 13.
    TDS Telecom • ResidentialWireline – focus on broadband offerings, including voice and video; bundled services • Commercial Wireline – focused on small & medium business (SMB) customers • Cable – expand broadband offerings while leveraging TDS Telecom expertise • HMS – grow recurring revenue by targeting medium sized businesses and provide a wide-range of services TDS Telecom is a wholly-owned subsidiary of TDS 13
  • 14.
    2016 strategic priorities •Completeplanned targeted fiber deployment; increase broadband and IPTV penetration in existing markets •Capital intensity declines driving higher free cash flow Wireline •Increase residential and commercial broadband customer connections •Continue to evaluate potential acquisitions Cable •Focus on growth of recurring service revenues •Sell across entire portfolio •Utilize new data center capacity Hosted and Managed Services 14
  • 15.
    Wireline focused ondelivering Broadband Wireline Strategy: • Fiber Strategy in most attractive markets (~25% IPTV-capable service addresses) • Complete targeted fiber deployment • Increase broadband and IPTV connections • Capital intensity declines as program completes • Strategy in lower density markets • Deploy copper bonding to ~20% of service addresses to provide up to 50Mbps • Evaluating the USF Reform Order funding options in areas with no competition (~ up to 30% of service addresses) Q3’15 Q3’16 % Change (Y/Y) IPTV connections 30,300 43,600 44% Residential revenue per connection $42.83 $44.25 3% managedIP connections 145,900 151,500 4% Q3’15 Q3’16 Take rate % at 10 MB or higher 45% 52% Take rate % at 25 MB or higher 14% 21% 15
  • 16.
    Cable Acquisitions SupportProfitable Growth • Natural extension to existing businesses • ARPU growth potential in bundling, high-margin data, add-on services • Operating synergies through existing platform, technologies, and expertise • Significant SMB commercial growth potential in underserved markets • Provides high-capacity pipe into the home • Attractive competitive landscape and market demographics Baja Broadband (now rebranded TDS) Bend Broadband 16
  • 17.
  • 18.
    TDS Telecom operatingperformance ($ in millions) Q3’16 Q3’15 % Change Wireline $175 $175 --- Cable 46 44 5% HMS 68 82 (17%) Total operating revenues (1) 287 299 (4%) Expenses (1)(2) 217 224 (3%) Adjusted EBITDA (3) $ 71 $ 76 (7%) (1) Reflects intercompany eliminations (2) Represents cost of products and services and selling, general and administrative expenses (3) Adjusted EBITDA is a non-GAAP financial measure that is defined in the non-GAAP reconciliation at the end of the presentation. 18
  • 19.
  • 20.
    TDS Balanced CapitalAllocation Strategy Available Resource Allocation • $250 million TDS stock repurchase program ($198.7 remaining) • Repurchased 111,700 shares in Q1’16 • No repurchases in 2015 25% 75% Return value to shareholders • 42nd consecutive year of increasing cash dividends • Supplement with opportunistic share repurchase Invest in the business (M&A) • Primarily focused on cable acquisitions 20
  • 21.
    Delivering Value toShareholders Annual Dividends Per TDS Share Shares Repurchased * Retroactively adjusted for the effect of 2005 stock dividend. • TDS - 42 years of consecutive dividend increases • June 25, 2013 - U.S. Cellular paid $5.75 per share special cash dividend Repurchased $994 M 0 1 2 3 4 5 6 7 8 2007 2008 2009 2010 2011 2012 2013 2014 2015 2016 TDS USM Inmillions $0.00 $0.10 $0.20 $0.30 $0.40 $0.50 $0.60 $0.70 21
  • 22.
    Conservative Financial Foundation Aligningdebt maturities with long lived assets Call options on most company debt securities give the company the flexibility to repay or refinance its debt as conditions warrant. 22
  • 23.
  • 24.
    Operating Cash Flowand Adjusted EBITDA Reconciliation – Q3 2016 and Q3 2015 ($ in millions) U.S. Cellular (as reported) U.S. Cellular (excluding termination of naming rights) Wireline Cable HMS Total TDS Telecom TDS (1) U.S. Cellular (as reported) U.S. Cellular (excluding rewards impact) Wireline Cable HMS Total TDS Telecom TDS (1) Net income (loss) (GAAP) $18 N/A N/A N/A N/A $7 $16 $65 N/A N/A N/A N/A $9 $62 Add back: Income tax expense (benefit) 15 N/A N/A N/A N/A 4 14 41 N/A N/A N/A N/A 8 46 Income (loss) before income taxes (GAAP) $33 $46 $17 -- $(6) $11 $30 $106 $48 $19 $1 $(2) $17 $108 Add back: Interest expense 28 28 -- -- 1 1 42 21 21 -- -- 1 -- 35 Depreciation, amortization and accretion expense 155 155 41 9 7 57 214 152 152 41 9 7 57 211 EBITDA (non-GAAP) $216 $229 $57 $9 $3 $69 $286 $279 $221 $60 $10 $5 $74 $354 Add back: (Gain) loss on assets disposals, net 7 7 1 1 -- 2 8 3 3 2 -- -- 2 5 (Gain) loss on sale of business and other exit costs, net --- --- -- -- -- -- -- (1) (1) -- -- -- -- (1) (Gain) loss on license sales and exchanges, net (7) (7) -- -- -- -- (7) (24) (24) -- -- -- -- (24) Adjusted EBITDA (2) (non-GAAP) $216 $229 $58 $10 $3 $71 $287 $257 $199 $61 $10 $5 $76 $334 Deduct: Equity in earnings of unconsolidated entities 38 38 -- -- -- -- 38 40 40 -- -- -- -- 40 Interest and dividend income 14 14 1 -- -- 1 15 9 9 1 -- -- 1 10 Other, net -- --- -- -- -- -- (1) --- --- -- -- -- -- -- Operating cash flow (2) (3) (non-GAAP) $164 $177 $57 $10 $3 $70 $235 $208 $150 $61 $10 $5 $76 $284 Three months ended Sept. 30, 2016 Three months ended Sept. 30, 2015 In providing 2016 and 2015 Estimated Results, TDS has not completed the below reconciliation to net income because it does not provide guidance for income taxes. TDS believes that the impact of income taxes cannot be reasonably predicted; therefore, the company is unable to provide such guidance. 24
  • 25.
    Operating Cash Flowand Adjusted EBITDA Reconciliation – ($ in millions) U.S. Cellular (as reported) U.S. Cellular (excluding termination of naming rights) U.S. Cellular (as reported) U.S. Cellular (excluding rewards impact) Net income (loss) (GAAP) $54 N/A $250 N/A Add back: Income tax expense (benefit) 39 N/A 161 N/A Income (loss) before income taxes (GAAP) $93 $106 $411 $353 Add back: Interest expense 84 84 61 61 Depreciation, amortization and accretion expense 462 462 450 450 EBITDA (non-GAAP) $639 $652 $922 $864 Add back: (Gain) loss on assets disposals, net 16 16 12 12 (Gain) loss on sale of business and other exit costs, net --- --- (114) (114) (Gain) loss on license sales and exchanges, net (16) (16) (147) (147) Adjusted EBITDA (1) (non-GAAP) $639 $652 $673 $615 Deduct: Equity in earnings of unconsolidated entities 110 110 110 110 Interest and dividend income 41 41 26 26 Other, net -- -- (1) (1) Operating cash flow (1) (2) (non-GAAP) $488 $501 $538 $480 Nine months ended Sept. 30, 2016 Nine months ended Sept. 30, 2015 In providing 2016 and 2015 Estimated Results, TDS has not completed the below reconciliation to net income because it does not provide guidance for income taxes. TDS believes that the impact of income taxes cannot be reasonably predicted; therefore, the company is unable to provide such guidance. 25
  • 26.
    Operating Cash Flowand Adjusted EBITDA Reconciliation – 2016 Estimated 2016 Estimated Results Actual Results Year ended December 31, 2015 (Dollars in millions) U.S. Cellular TDS Telecom TDS(1) U.S. Cellular TDS Telecom TDS (1) Net income (loss) (GAAP) N/A N/A N/A $247 $46 $263 Add back: Income tax expense (benefit) N/A N/A N/A 156 35 172 Income (loss) before income taxes (GAAP) $(5)-$120 40-80 $(25)-$140 $404 81 $435 Add back: Interest expense 110 ― 165 86 1 142 Depreciation, amortization and accretion 615 230 855 606 228 844 EBITDA $720-$845 270-310 $995-$1,160 $1,096 310 $1,421 Add back: (Gain) loss on sale of business and other exit costs, net ― ― ― (114) (10) (136) (Gain) loss on license sales and exchanges (4) (15) ― (15) (147) — (147) (Gain) loss on assets disposals, net 20 ― 20 16 6 22 Adjusted EBITDA (2) $725-$850 270-310 $1,000-$1,165 $852 306 $1,160 Deduct: Equity in earnings of unconsolidated entities 140 ― 140 140 — 140 Interest and dividend income 60 ― 60 37 2 39 Operating cash flow (2)(3) $525-$650 270-310 $800-$965 $675 304 $981 26
  • 27.
    Three months ended 9/30/15 Threemonths ended 9/30/15 Three months ended 9/30/15 Full Year-end 12/31/15 Full Year-end 12/31/15 Full Year-end 12/31/15 (in millions) As reported (GAAP) Rewards Impact Excluding rewards impact (non-GAAP) As reported (GAAP) Rewards Impact Excluding rewards impact (non-GAAP) Service revenues $ 896 $(58) $ 838 $3,350 $(58) $3,292 Retail service 797 (58) 739 2,994 (58) 2,936 Roaming 59 --- 59 192 --- 192 Tower rentals 13 --- 13 53 --- 53 Other 27 --- 27 111 --- 111 Equipment sales revenue 173 --- 173 647 --- 647 Total operating revenues $1,069 $(58) $1,011 $3,997 $(58) $3,939 System operation expense 199 --- 199 775 --- 775 Cost of equipment sold 287 --- 287 1,053 --- 1,053 SG&A 375 --- 375 1,494 --- 1,494 Total cash expenses 861 --- 861 3,322 --- 3,322 Operating cash flow (non-GAAP) $208 $(58) $150 675 $(58) $617 Equity in earnings of unconsolidated entities 40 --- 40 140 --- 140 Interest and dividend income 9 --- 9 37 --- 37 Adjusted EBITDA (non-GAAP) $257 $(58) $199 $852 $(58) $794 U.S. Cellular Rewards Impact Reconciliation As previously described, this table reconciles GAAP measures to non-GAAP measures showing the impact of $58 million related to the termination of the rewards program. 27
  • 28.
    (1) The TDScolumn includes U.S. Cellular, TDS Telecom and also the impacts of consolidating eliminations, corporate operations and non-reportable segments, all of which are not presented above. (2) Adjusted EBITDA (earnings before interest, taxes, depreciation, amortization and accretion) is defined as net income adjusted for the items set forth in the reconciliation above. Operating cash flow is defined as net income adjusted for the items set forth in the reconciliation above. Adjusted EBITDA and Operating cash flow are not measures of financial performance under Generally Accepted Accounting Principles in the United States (“GAAP”) and should not be considered as alternatives to Net income or Cash flows from operating activities, as indicators of cash flows or as measures of liquidity. TDS does not intend to imply that any such items set forth in the reconciliation above are non- recurring, infrequent or unusual; such items may occur in the future. Management uses Adjusted EBITDA and Operating cash flow as measurements of profitability, and therefore reconciliations to applicable GAAP income measures are deemed most appropriate. Management believes Adjusted EBITDA and Operating cash flow are useful measures of TDS’ operating results before significant recurring non-cash charges, gains and losses, and other items as presented above as they provide additional relevant and useful information to investors and other users of TDS’ financial data in evaluating the effectiveness of its operations and underlying business trends in a manner that is consistent with management’s evaluation of business performance. Adjusted EBITDA shows adjusted earnings before interest, taxes, depreciation, amortization and accretion and gains and losses, while Operating cash flow reduces this measure further to exclude Equity in earnings of unconsolidated entities and Interest and dividend income in order to more effectively show the performance of operating activities excluding investment activities. The table above reconciles Adjusted EBITDA and Operating cash flow to the corresponding GAAP measure, Net income or Income (loss) before income taxes. (3) A reconciliation of Operating cash flow (Non-GAAP) and Operating income (excluding gains and losses) (Non-GAAP) to operating income (GAAP) for September 30, 2016 actual results can be found on the company's website at investors.tdsinc.com. (4) In 2016, U.S. Cellular entered into multiple agreements to exchange licenses. Agreements are subject to regulatory approval and other customary closing conditions, and are expected to close in the fourth quarter of 2016. Upon closing of the transactions, U.S. Cellular expects to record a gain. As of September 30, 2016 two license closings occurred and U.S. Cellular recorded a gain of $16 million. For the remainder of the licenses a reasonable estimate of the gains is unavailable at the time of this filing. 28
  • 29.
    TDS’ mission isto provide outstanding communications services to our customers and meet the needs of our shareholders, our people and our communities. 29