
Download to read offline


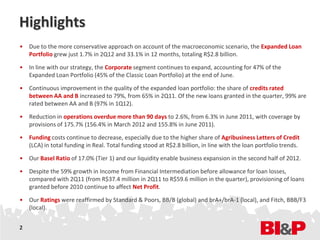
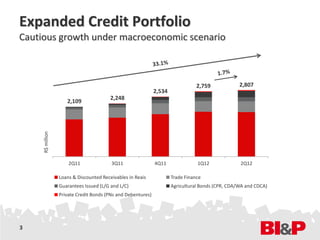
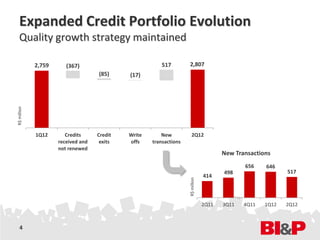

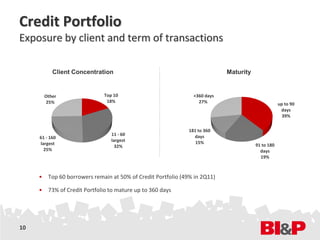
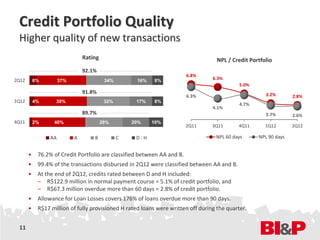
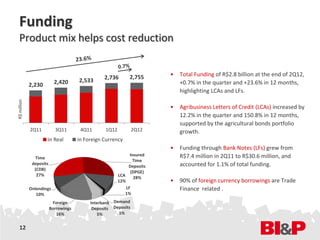
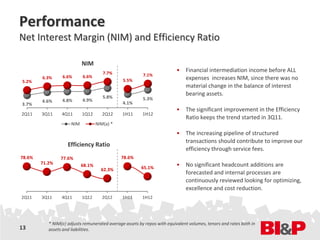
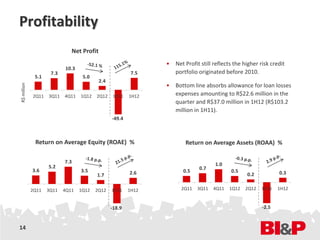
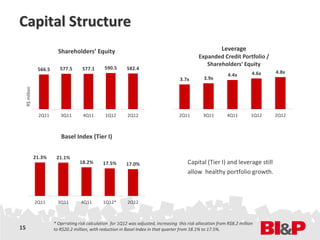

This document provides a summary of BI&P's results for the 2nd quarter of 2012. Key highlights include: - Loan portfolio grew 1.7% in the quarter and 33.1% over 12 months, reaching R$2.8 billion, with continued focus on corporate clients. - Credit quality improved, with higher rated loans increasing to 79% of the portfolio. Non-performing loans fell to 2.6% of the portfolio. - Net interest margin increased to 5.3% and efficiency ratio improved to 65.1%, though net profits were still impacted by legacy loans. - Capital and liquidity remained strong with a Tier 1 Basel ratio of 17% and leverage of 4.


