Download as PDF, PPTX


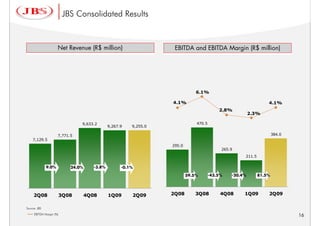
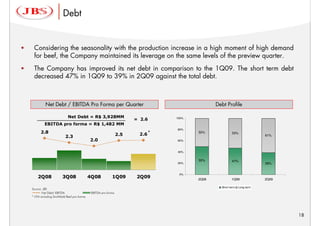


JBS reported financial results for the 2nd quarter of 2009. Net revenue increased 29.8% compared to the prior year quarter. Consolidated EBITDA increased 32.1% year-over-year and 81.5% compared to the previous quarter. The company gained market share in Brazil and expanded production capacity. JBS also applied to list shares on the IPO and BDR programs to access international capital markets for financing growth. Overall results showed improved profitability and margins across business units.


![[Challenge:Future] New Future: Food For Thought](https://cdn.slidesharecdn.com/ss_thumbnails/challengefuture-new-future-food-for-thought4711-130228015736-phpapp01-thumbnail.jpg?width=640&height=640&fit=bounds)


