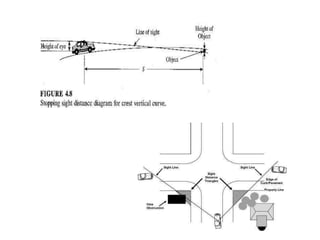
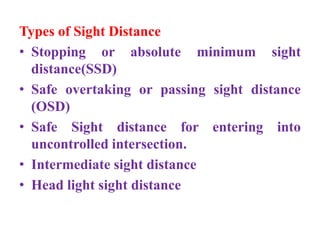
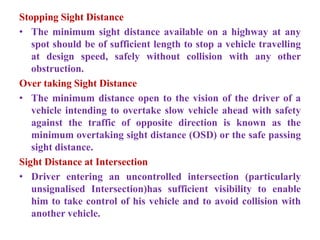
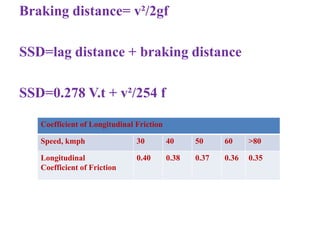
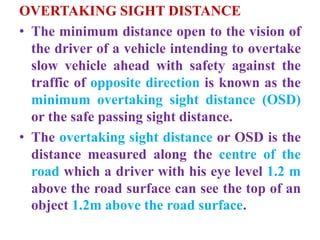
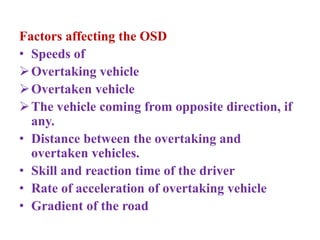
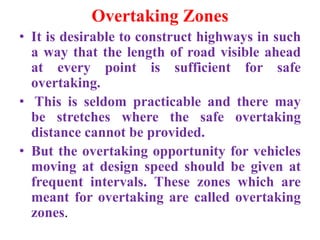
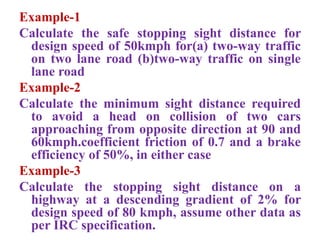
SIGHT DISTANCE
Sight distance available from a
point is the actual distance along
the road surface, which a driver
from a specified height above the
carriageway has visibility of
stationary or moving objects.
OR
It is the length of road visible
ahead to the driver at any
instance.
Types of Sight Distance
• Stopping or absolute minimum sight
distance(SSD)
• Safe overtaking or passing sight distance
(OSD)
• Safe Sight distance for entering into
uncontrolled intersection.
• Intermediate sight distance
• Head light sight distance
Stopping Sight Distance
• The minimum sight distance available on a highway at any
spot should be of sufficient length to stop a vehicle travelling
at design speed, safely without collision with any other
obstruction.
Over taking Sight Distance
• The minimum distance open to the vision of the driver of a
vehicle intending to overtake slow vehicle ahead with safety
against the traffic of opposite direction is known as the
minimum overtaking sight distance (OSD) or the safe passing
sight distance.
Sight Distance at Intersection
• Driver entering an uncontrolled intersection (particularly
unsignalised Intersection)has sufficient visibility to enable
him to take control of his vehicle and to avoid collision with
another vehicle.
Intermediate sight distance
• This is defined as twice the stopping sight
distance. When overtaking sight distance can
not be provided, intermediate sight distance is
provided to give limited overtaking
opportunities to fast vehicles.
Headlight sight distance
• This is the distance visible to a driver during
night driving under the illumination of the
vehicle head lights. This sight distance is
critical at up-gradients and at the ascending
stretch of the valley curves.
Stopping Sight Distance
• SSD is the minimum sight distance available on
a highway at any spot having sufficient length
to enable the driver to stop a vehicle traveling
at design speed, safely without collision with
any other obstruction.
It depends on
• Feature of road ahead
• Height of driver’s eye above the road
surface(1.2m)
• Height of the object above the road
surface(0.15m)
Factors affecting the SSD
• Total reaction time of driver
• Speed of vehicle
• Efficiency of brakes
• Frictional resistance between road and tyre
• Gradient of road
Total reaction time of driver:
• It is the time taken from the instant the object is
visible to the driver to the instant the brake is
effectively applied, it divide into types
1.Perception time
2.Brake reaction time
Perception time
• It is the time from the instant the object comes
on the line of sight of the driver to the instant
he realizes that the vehicle needs to be stopped.
Brake reaction time
• The brake reaction also depends on several
factor including the skill of the driver, the type
of the problems and various other environment
factor.
• Total reaction time of driver can be calculated
by “PIEV” theory
“PIEV” Theory
Total reaction time of driver is split into four
parts:
• P- Perception
• I- Intellection
• E- Emotion
• V- Volition
PERCEPTION
• It is the time required for the sensation received by the eyes or
ears to be transmitted to the brain through the nervous system
and spinal chord.
INTELLECTION:
• It is the time required for understanding the situation.
EMOTION
• It is the time elapsed during emotional sensation and
disturbance such as fear, anger or any other emotional feeling
such as superstition etc, with reference to the situation.
VOLITION
• It is the time taken for the final action
• Total reaction time of driver may be vary from 0.5 sec to 4 sec
Analysis of SSD
• The stopping sight distance is the sum of lag
distance and the braking distance.
Lag distance
• It is the distance, the vehicle traveled during
the reaction time
• If ‘V’ is the design speed in m/sec and ‘t’ is
the total reaction time of the driver in
seconds,
Lag distance=0.278 V.t meters
Where “v” in Kmph,
T= time in sec=2.5 Sec
Braking Distance
• It is the distance traveled by the vehicle
after the application of brake.
• For a level road this is obtained by equating
the work done in stopping the vehicle and
the kinetic energy of the vehicle.
• Work done against friction force in stopping
the vehicle is F x l = f W l, where W is the
total weight of the vehicle.
• The kinetic energy at the design speed of
v m/sec will be ½ m. v²
Braking distance= v²/2gf
SSD=lag distance + braking distance
SSD=0.278 V.t + v²/254 f
Coefficient of Longitudinal Friction
Speed, kmph 30 40 50 60 >80
Longitudinal
Coefficient of Friction
0.40 0.38 0.37 0.36 0.35
OVERTAKING SIGHT DISTANCE
• The minimum distance open to the vision of
the driver of a vehicle intending to overtake
slow vehicle ahead with safety against the
traffic of opposite direction is known as the
minimum overtaking sight distance (OSD)
or the safe passing sight distance.
• The overtaking sight distance or OSD is the
distance measured along the centre of the
road which a driver with his eye level 1.2 m
above the road surface can see the top of an
object 1.2m above the road surface.
Factors affecting the OSD
• Speeds of
Overtaking vehicle
Overtaken vehicle
The vehicle coming from opposite direction, if
any.
• Distance between the overtaking and
overtaken vehicles.
• Skill and reaction time of the driver
• Rate of acceleration of overtaking vehicle
• Gradient of the road
Overtaking Zones
• It is desirable to construct highways in such
a way that the length of road visible ahead
at every point is sufficient for safe
overtaking.
• This is seldom practicable and there may
be stretches where the safe overtaking
distance cannot be provided.
• But the overtaking opportunity for vehicles
moving at design speed should be given at
frequent intervals. These zones which are
meant for overtaking are called overtaking
zones.
• The minimum length of overtaking
zone should be three time the safe
overtaking distance i.e.,3(d1+d2)for
one-way roads and 3(d1+d2+d3)for
two-way roads.
• Desirable length of overtaking zones is
kept five times the overtaking sight
distance.i.e.,5(d1+d2)for one-way
roads and 5(d1+d2+d3) for two-way
roads.
Example-1
Calculate the safe stopping sight distance for
design speed of 50kmph for(a) two-way traffic
on two lane road (b)two-way traffic on single
lane road
Example-2
Calculate the minimum sight distance required
to avoid a head on collision of two cars
approaching from opposite direction at 90 and
60kmph.coefficient friction of 0.7 and a brake
efficiency of 50%, in either case
Example-3
Calculate the stopping sight distance on a
highway at a descending gradient of 2% for
design speed of 80 kmph, assume other data as
per IRC specification.
DESIGN OF HORIZONTALALIGNMENT
Horizontal
Curves
Horizontal Curves
• A horizontal highway curve is a curve in plan to
provide change in direction to the central line of a
road. When a vehicle traverses a horizontal curve,
the centrifugal force acts horizontally outwards
through the centre of gravity of the vehicle.
P = W v²∕gR
Where,
P=centrifuge force,kg
W=weight of the vehicle, kg
R=radius of the circular curve, m
v=speed of vehicle/sec
g=acceleration due to gravity=9.8m/sec
P=mv2/gR
b
h
W F
• P/W is known as the centrifugal ratio or the
impact factor. The centrifuge ratio is thus
equal to v²∕gR
• The centrifugal force acting on a vehicle
negotiating a horizontal curve has two
effects
Tendency to overturn the vehicle outwards
about the outer wheels
Tendency to skid the vehicle laterally,
outwards

2415536_Unit-ISIGHTDISTNCE.pptx

  • 1.
    SIGHT DISTANCE Sight distanceavailable from a point is the actual distance along the road surface, which a driver from a specified height above the carriageway has visibility of stationary or moving objects. OR It is the length of road visible ahead to the driver at any instance.
  • 3.
    Types of SightDistance • Stopping or absolute minimum sight distance(SSD) • Safe overtaking or passing sight distance (OSD) • Safe Sight distance for entering into uncontrolled intersection. • Intermediate sight distance • Head light sight distance
  • 4.
    Stopping Sight Distance •The minimum sight distance available on a highway at any spot should be of sufficient length to stop a vehicle travelling at design speed, safely without collision with any other obstruction. Over taking Sight Distance • The minimum distance open to the vision of the driver of a vehicle intending to overtake slow vehicle ahead with safety against the traffic of opposite direction is known as the minimum overtaking sight distance (OSD) or the safe passing sight distance. Sight Distance at Intersection • Driver entering an uncontrolled intersection (particularly unsignalised Intersection)has sufficient visibility to enable him to take control of his vehicle and to avoid collision with another vehicle.
  • 5.
    Intermediate sight distance •This is defined as twice the stopping sight distance. When overtaking sight distance can not be provided, intermediate sight distance is provided to give limited overtaking opportunities to fast vehicles. Headlight sight distance • This is the distance visible to a driver during night driving under the illumination of the vehicle head lights. This sight distance is critical at up-gradients and at the ascending stretch of the valley curves.
  • 6.
    Stopping Sight Distance •SSD is the minimum sight distance available on a highway at any spot having sufficient length to enable the driver to stop a vehicle traveling at design speed, safely without collision with any other obstruction. It depends on • Feature of road ahead • Height of driver’s eye above the road surface(1.2m) • Height of the object above the road surface(0.15m)
  • 7.
    Factors affecting theSSD • Total reaction time of driver • Speed of vehicle • Efficiency of brakes • Frictional resistance between road and tyre • Gradient of road Total reaction time of driver: • It is the time taken from the instant the object is visible to the driver to the instant the brake is effectively applied, it divide into types 1.Perception time 2.Brake reaction time
  • 8.
    Perception time • Itis the time from the instant the object comes on the line of sight of the driver to the instant he realizes that the vehicle needs to be stopped. Brake reaction time • The brake reaction also depends on several factor including the skill of the driver, the type of the problems and various other environment factor. • Total reaction time of driver can be calculated by “PIEV” theory
  • 9.
    “PIEV” Theory Total reactiontime of driver is split into four parts: • P- Perception • I- Intellection • E- Emotion • V- Volition
  • 10.
    PERCEPTION • It isthe time required for the sensation received by the eyes or ears to be transmitted to the brain through the nervous system and spinal chord. INTELLECTION: • It is the time required for understanding the situation. EMOTION • It is the time elapsed during emotional sensation and disturbance such as fear, anger or any other emotional feeling such as superstition etc, with reference to the situation. VOLITION • It is the time taken for the final action • Total reaction time of driver may be vary from 0.5 sec to 4 sec
  • 11.
    Analysis of SSD •The stopping sight distance is the sum of lag distance and the braking distance. Lag distance • It is the distance, the vehicle traveled during the reaction time • If ‘V’ is the design speed in m/sec and ‘t’ is the total reaction time of the driver in seconds, Lag distance=0.278 V.t meters Where “v” in Kmph, T= time in sec=2.5 Sec
  • 12.
    Braking Distance • Itis the distance traveled by the vehicle after the application of brake. • For a level road this is obtained by equating the work done in stopping the vehicle and the kinetic energy of the vehicle. • Work done against friction force in stopping the vehicle is F x l = f W l, where W is the total weight of the vehicle. • The kinetic energy at the design speed of v m/sec will be ½ m. v²
  • 13.
    Braking distance= v²/2gf SSD=lagdistance + braking distance SSD=0.278 V.t + v²/254 f Coefficient of Longitudinal Friction Speed, kmph 30 40 50 60 >80 Longitudinal Coefficient of Friction 0.40 0.38 0.37 0.36 0.35
  • 14.
    OVERTAKING SIGHT DISTANCE •The minimum distance open to the vision of the driver of a vehicle intending to overtake slow vehicle ahead with safety against the traffic of opposite direction is known as the minimum overtaking sight distance (OSD) or the safe passing sight distance. • The overtaking sight distance or OSD is the distance measured along the centre of the road which a driver with his eye level 1.2 m above the road surface can see the top of an object 1.2m above the road surface.
  • 15.
    Factors affecting theOSD • Speeds of Overtaking vehicle Overtaken vehicle The vehicle coming from opposite direction, if any. • Distance between the overtaking and overtaken vehicles. • Skill and reaction time of the driver • Rate of acceleration of overtaking vehicle • Gradient of the road
  • 16.
    Overtaking Zones • Itis desirable to construct highways in such a way that the length of road visible ahead at every point is sufficient for safe overtaking. • This is seldom practicable and there may be stretches where the safe overtaking distance cannot be provided. • But the overtaking opportunity for vehicles moving at design speed should be given at frequent intervals. These zones which are meant for overtaking are called overtaking zones.
  • 17.
    • The minimumlength of overtaking zone should be three time the safe overtaking distance i.e.,3(d1+d2)for one-way roads and 3(d1+d2+d3)for two-way roads. • Desirable length of overtaking zones is kept five times the overtaking sight distance.i.e.,5(d1+d2)for one-way roads and 5(d1+d2+d3) for two-way roads.
  • 18.
    Example-1 Calculate the safestopping sight distance for design speed of 50kmph for(a) two-way traffic on two lane road (b)two-way traffic on single lane road Example-2 Calculate the minimum sight distance required to avoid a head on collision of two cars approaching from opposite direction at 90 and 60kmph.coefficient friction of 0.7 and a brake efficiency of 50%, in either case Example-3 Calculate the stopping sight distance on a highway at a descending gradient of 2% for design speed of 80 kmph, assume other data as per IRC specification.
  • 19.
  • 20.
    Horizontal Curves • Ahorizontal highway curve is a curve in plan to provide change in direction to the central line of a road. When a vehicle traverses a horizontal curve, the centrifugal force acts horizontally outwards through the centre of gravity of the vehicle. P = W v²∕gR Where, P=centrifuge force,kg W=weight of the vehicle, kg R=radius of the circular curve, m v=speed of vehicle/sec g=acceleration due to gravity=9.8m/sec
  • 21.
  • 22.
    • P/W isknown as the centrifugal ratio or the impact factor. The centrifuge ratio is thus equal to v²∕gR • The centrifugal force acting on a vehicle negotiating a horizontal curve has two effects Tendency to overturn the vehicle outwards about the outer wheels Tendency to skid the vehicle laterally, outwards