1. ISSN: 2277-3754
ISO 9001:2008 Certified
International Journal of Engineering and Innovative Technology (IJEIT)
Volume 4, Issue 9, March 2015
123
Abstract— The effective design and the construction of
earthquake resistant structures have much greater importance in
all over the world. In this paper, the earthquake response of
symmetric multistoried building is studied by manual calculation
and with the help of ETABS 9.7.1 software. The method includes
seismic coefficient method as recommended by IS 1893:2002. The
responses obtained by manual analysis as well as by soft
computing are compared. This paper provides complete guide line
for manual as well s software analysis of seismic coefficient
method.
Index Terms—earthquake, manual calculation, ETABS 9.7.1,
IS 1893:2002
I. INTRODUCTION
ETABS is the present day leading design software in the
market. Many design company’s use this software for their
project design purpose. So, this paper mainly deals with the
comparative analysis of the results obtained from the analysis
of a multi storey building structure when analyzed manually
and using ETABS software separately. In this case, a 22.5m x
22.5m, 8 storey structure is modeled using ETABS software.
The height of each storey is taken as 3meter making the total
height of the structure 24 meter. Analysis of the structure is
done and then the results generated by this software are
compared with manual analysis of the structure using IS
1893:2002.
II. PROBLEM DEFINATION
A. Case
A 22.5m x 22.5 m, 8 storey multi storey regular structure is
considered for the study. Storey height is 3m. Modeling and
analysis of the structure is done on ETABS software.
B. Preliminary Data
Length x Width 22.5m x 22.5m
No. of Storey’s 8 (G+7)
Beam 250 mm x 400 mm
Columns 400 mm x 500 mm
Slab thickness 150 mm
Support Condition Fixed
Thickness External Wall 120mm
Grade of Concrete and steel M20 and Fe415
Length of each bay 7.5m
C. Loading Consideration
Loads acting on the structure are dead load (DL), Live
Load (IL) and Earthquake Load (EL) DL: Self weight of the
structure, Floor load and Wall loads
LL: Live load 3KN/m2
is considered
Seismic: Zone: III
Zone Factor: 0.16
Soil type: II
Response reduction factor: R=3
Importance factor: 1
Damping: 5%
Time period: 0.427 sec (calculated as per IS 1893:
2002)
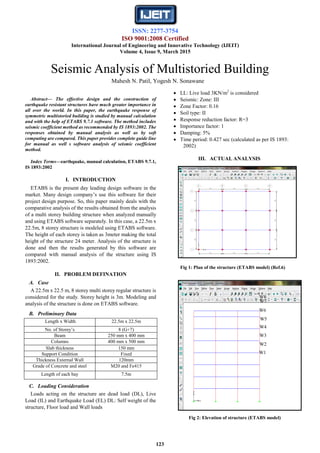
III. ACTUAL ANALYSIS
Fig 1: Plan of the structure (ETABS model) (Ref.6)
Fig 2: Elevation of structure (ETABS model)
Seismic Analysis of Multistoried Building
Mahesh N. Patil, Yogesh N. Sonawane
W1
W2
W3
W4
W5
W6
W7
W8
2. ISSN: 2277-3754
ISO 9001:2008 Certified
International Journal of Engineering and Innovative Technology (IJEIT)
Volume 4, Issue 9, March 2015
124
A. Dead Load (D. L.) per floor
Items SIZE(LBH) m3 No. Density(kN/
m3)
Dead
Load
(kN)
Beam 0.25×0.4×7.5 24 24 432
Column 0.5×0.4×3 16 24 230.4
Slab 22.5×22.5×
0.15
1 24 1822.5
Wall 22.5×0.12×3 4 20 648
SUM 3132.9
Fig 3: Procedure to model beam and columns. (ETABS model)
(Ref.6)
Fig 4: Procedure to model slab (ETABS model)
B. UDL due to wall:
Wall is not modulated only UDL is due to wall on beam is
considered.
Fig 5: Procedure to assign UDL to beam (ETABS model) (Ref.6)
UDL OF WALL = 0.12(thickness) × 3(height of wall) ×20
(brick density) = 7.2 kN/m
C. Live load on floor area
As mentioned in II.C, Live load is considered 3kN/m2
on each
floor. Each floor has dimension 22.5m x 22.5m.
Live load on each floor is
3x22.5x22.5 = 1518.75 KN
As per IS 1893:2002 (pg no. 24) Clause no. 7.3.1, Table no.8,
only 25% live load is considered in seismic weight
calculations.
3. ISSN: 2277-3754
ISO 9001:2008 Certified
International Journal of Engineering and Innovative Technology (IJEIT)
Volume 4, Issue 9, March 2015
125
25% of live load = 0.25x 1518.75 = 379.6875 KN.
Fig 6: 7.2kN/m UDL applied to beam on each floor
Fig 7: Procedure to assign live load on floor
Fig 8: Applied live load on each floor (3 kN/m2
)
Fig 9: Live load reduction clause as per IS 1893:2000
(Ref.5)
D. Load combination
As per IS 1893:2000, the load combination Dead load +
Live Load becomes,
DL + 25% LL.
DL = 3132.9, 25% LL = 379.687
DL+ 25% LL = 3572.5875 kN per each floor.
This live load reduction is defined by a command mass
source in ETABS 7.1.
Fig 10: Procedure to define Mass Source (ETABS
model) (Ref.6)
4. ISSN: 2277-3754
ISO 9001:2008 Certified
International Journal of Engineering and Innovative Technology (IJEIT)
Volume 4, Issue 9, March 2015
126
Fig 11: Actual Mass Source window in ETABS (Ref.6)
E. Seismic weight calculation of building
As per III, C
W1=W2=W3=W4=W5=W6=W7= 3512.5875 kN.
Lumped mass at roof floor.
In the calculation of seismic weight, for the terrace floor 50%
of the weight is considered for walls and columns.
W8 = 432 + (230.4 / 2) + 1822.5 + (648 / 2)
= 2693.7 kN.
Total weight (W) = (3512.587 x 7) + 2693.7
= 27281.8125 kN.
Now the seismic weight obtain in ETABS software is as
shown below.
Fig 12: Procedure to display axial loads in columns (ETABS
model) (Ref.6)
Fig 13: Axial load in each column of first floor(W1) (ETABS
model) (Ref.6)
Now the algebraic sum of all the axial forces gives seismic
weight of the complete building. The same values can be
obtained in the table form and facility of exporting these
values in excel is available in ETABS that algebraic sum and
other any mathematical calculations can be simplified in
excel. The procedure of exporting these values in ETABS is
explained as below in four steps.
Step 1
5. ISSN: 2277-3754
ISO 9001:2008 Certified
International Journal of Engineering and Innovative Technology (IJEIT)
Volume 4, Issue 9, March 2015
127
Step 2
Step 3
Step 4
Fig 14: Procedure to export axial force of column in excel
Seismic weight obtained from ETABS = 27281.8 kN.
IV. ANALYSIS FOR BASE SHEAR
A. Design Seismic Base Shear
As per IS 1893:2002, Page No. 24, The total design lateral
force or design seismic base Shear (VB) along any principal
direction shall be determined by the following expression:
VB = Ah x w
Where, ……(Ref.5)
Ah = Design horizontal acceleration spectrum Value as per
Clause 6.4.2, using the fundamental natural period T, as per
Clause 7.6 in the considered direction of vibration, and
w = Seismic weight of the building as per Clause 7.4.2.
As per IS 1893:2002, Clause 6.4.2, Page No. 14,
Where, ……(Ref.5)
Z =0.16, As per IS 1893:2002, Table No.2 and ANNEX E,
Zone Factor for IIIrd
zone.
I= 1, As per IS 1893:2002, Table No.6, Importance factor, It
is depends on the functional use of the structure.
R= 3, As per IS 1893:2002, Table No.7, Response reduction
factor.
Sa/g = Average response acceleration coefficient.
The value of average response acceleration coefficient is
determined from the graph given on page no.16 of IS
1893:2002.
Fig 15: Graph Sa/g Vs. Time period. (Ref.5)
6. ISSN: 2277-3754
ISO 9001:2008 Certified
International Journal of Engineering and Innovative Technology (IJEIT)
Volume 4, Issue 9, March 2015
128
For determination of average response acceleration
coefficient, it is required to calculate time period.
As per IS 1893:2002, Page No.7, time period T is given by
Where, …..(Ref.5)
H= Height of the building in meter. = 24 m
Note: As per IS 1893:2002 for the terrace floor, half of the
total load is considered for walls and columns. So while
modeling in ETABS, top story height is modeled 1.5m while
height of other stories is 3m. So in ETABS model H = 22.5m
d=Base dimension of the building in meter = 22.4 m
Ta = 0.455 sec.
Ta = 0.427 sec.(In case of ETABS)
From the graph as shown in Fig. 12.
Sa/g = 2.5.
Now Design horizontal acceleration spectrum Value can be
calculated.
Now base shear
VB = Ah x w = 0.0667 x 27281.8125
VB = 1819.696 kN.
Fig 16: Window of ETABS showing IS 1893:2000 inputs Time
Period, Zone factor, Soil factor, response reduction factor.
(Ref.6)
Fig 17: Window of ETABS base shear value Vb (1797.28
kN) in ETABS. (Ref.6)
B. Vertical Distribution of Base Shear to Different Floor
Levels:
The design base shear VB shall be distributed long the height
of the building as per following equation
….(Ref.5)
Where,
Qi = Design lateral force at floor i,
Wi = Seismic weight of floor i,
hi = Height of floor i measured from base, and
n = Number of storeys in the building is the number
of levels at which the masses are located.
Floor Height
(Meter)
Wi hi2
Q Base
Shear
W1 3 31613.29 9.624 1819.69
W2 6 126453.15 38.5 1810.07
W3 9 284519.59 86.62 1771.57
W4 12 505812.6 153.98 1684.95
W5 15 790332.19 240.6 1530.97
W6 18 1138078.3 346.46 1290.37
W7 21 1549051 471.57 943.91
W8 24 1551571.2 472.34 472.34
5977431.9
7. ISSN: 2277-3754
ISO 9001:2008 Certified
International Journal of Engineering and Innovative Technology (IJEIT)
Volume 4, Issue 9, March 2015
129
C. Vertical Distribution of Base Shear to Different Floor
Levels from ETABS
Fig 18: Vertical Distribution of Base Shear to Different Floor
Levels.
Fig 19: Procedure to display base shear of each story (ETABS
model) (Ref.6)
Fig 20: Vertical Distribution of Base Shear to Different Floor
Levels (Out put from ETABS) (Ref.6)
V. CONCLUSION
From the data revealed by the manual as well as software
analysis for the structures with seismic coefficient method
using various loading combinations tried following
conclusions are drawn:
1.Seismic analysis was done by using ETABS software and
successfully verified manually as per IS 1893-2002.
2.There is a gradual increase in the value of lateral forces
from bottom floor to top floor in both manual as well as
software analysis
3.Calculation of seismic weight by both manual analysis as
well as software analysis gives exactly same result.
4.There is slight variation in the values of base shear in
manual analysis as well as software analysis
5.Base shear values obtained by manual analysis are slightly
higher than software analysis.
6.Results as compared and approximately same mathematical
values are obtained for 8-story building.
7.Complete guideline for the use of ETABS 7.1 for seismic
coefficient analysis is made available by this paper.
8.To conclude a complete design involving several
parameters so as to result the earthquake has been done and
a 3D prospective is shown for easy understanding and use.
VI. FUTURE ENHANCEMENT
1. Any structural engineer can use this paper as a guide
line for seismic analysis of any multistoried building.
2. The results obtained by this method can be compared
with results of Response Spectrum Method and
Time History Method.
REFERENCES
[1] Agarwal Pankaj, Shrikhande Manish, “Earthquake resistant
design of structures”, PHI learning private limited, New Delhi,
2009.
[2] Arlekar Jaswant N, Jain Sudhir K. and Murty C.V.R, (1997),
“Seismic Response of RC Frame Buildings with Soft First
Storeys”. Proceedings of the CBRI Golden Jubilee Conference
on Natural Hazards in Urban Habitat, 1997, New Delhi.
[3] Awkar J. C. and Lui E.M, “Seismic analysis and response of
multi-storey semi rigid frames”, Journal of Engineering
Structures, Volume 21, Issue 5, Page no: 425-442, 1997.
[4] Kulkarni J.G., Kore P. N., S. B. Tanawade, “Analysis of
Multi-storey Building Frames Subjected to Gravity and
Seismic Loads with Varying Inertia”, International Journal of
Engineering and Innovative Technology (IJEIT), Volume 2,
Issue 10, April 2013.
[5] B. Srikanth, V.Ramesh, “Comparative Study of Seismic
Response for Seismic Coefficient and Response Spectrum
Methods”, Journal of Engineering Research and Applications,
ISSN: 2248-9622, Vol. 3, Issue 5, Sep-Oct 2013,
pp.1919-1924.
[6] IS: 1893:2000, Part 1, "Criteria for Earthquake Resistant
Design of Structures - General Provisions for Buildings",
Bureau of Indian Standards, New Delhi, 2002.
[7] ETABS Non linear version 9.7.1
8. ISSN: 2277-3754
ISO 9001:2008 Certified
International Journal of Engineering and Innovative Technology (IJEIT)
Volume 4, Issue 9, March 2015
130
AUTHOR BIOGRAPHY
Mahesh N. Patil
B. E. (Civil).
M. Tech. (STRUCTURE) SVNIT, Surat
MISTE.
Assistant Professor, RCPIT, Shirpur
Yogesh N. Sonawane
B. E. (Civil).
M. Tech. (STRUCTURE) SVNIT, Surat
MISTE.
Assistant Professor, RCPIT, Shirpur