SlideShare a Scribd company logo
1 of 27
228 Chapter 8 • Measurement
to collect more validation data more quickly. For example,
insurance companies can share data to obtain large amounts of
validation data on specific positions. Another alternative is that
it can be advantageous to use professionally developed
assessment tools and procedures for which documentation on
validity already exists. However, you must ensure that the
validity evidence obtained from an "outside" study can be
suitably "transported" to your particular situation. In fact, the
Uniform Guidelines require as much. To determine if a
particular measure is valid for your intended use, consult the
manual and available independent reviews such as those in
Buros Institute's Mental Measurements Yearbook29 and Test
Critiques.*0
When evaluating validity information purchased from a vendor,
you should consider the following:
· Available validation evidence supporting the use of the
measure for specific purposes. The manual should include a
thorough description of the procedures used in the validation
studies and the results of those studies. Also consider the
definition of job success used in the validation study.
· The possible valid uses of the measure. The purposes for
which the measure can legitimately be used should be described,
as well as the performance criteria that can validly be predicted.
· The similarity of the sample group(s) on which the measure
was developed with the group(s) with which you would like to
use the measure. For example, was the measure developed on a
sample of high school graduates, managers, or clerical workers?
What was the racial, ethnic, age, and gender mix of the sample?
· Job similarity. A job analysis should be performed to verify
that your job and the original job are substantially similar in
terms of ability requirements and work behavior.
· Adverse impact evidence. Consider the adverse impact reports
from outside studies for each protected group that is part of
your labor market. If this information is not available for an
otherwise qualified measure, conduct your own study of adverse
impact, if feasible.
In addition, if an organization would like to use a vendor's
assessment or other tool globally, it is important to thoroughly
evaluate this capability. Many vendors that claim to be global
are actually not capable of delivering a product globally.31
This chapter's Develop Your Skills feature provides some
advice on measuring the characteristics of job applicants.
DEVELOP YOUR SKILLS
Chapter 8 • Measurement 225
226 Chapter 8 • Measurement
Assessment Tips3
To effectively assess job candidates, employers must be aware
of the inherent limitations of any assessment procedure as well
as how to properly use their chosen assessment methods. Here
are 10 tips on conducting an effective assessment program:
1. The measures should be used in a purposeful manner— have
a clear understanding of what you want to measure and why you
want to measure it.
2. Use a variety of tools—because no single measurement tool
is 100 percent reliable or valid, use a variety of tools to
measure job-relevant characteristics.
3. Use measures that are unbiased and fair to all groups— this
will allow you to identify a qualified and diverse set of
finalists.
4. Use measures that are reliable and valid.
5. Use measures that are appropriate for the target population—
a measure developed for use with one group might not be valid
for other groups.
6. Ensure that your administration staff is properly trained— the
training should include how to administer the measure as well
as how to handle special situations with sensitivity—for
example, how and when to provide reasonable accommodations
for people with disabilities.
7. Ensure suitable and uniform assessment conditions—noise,
poor lighting, inaccurate timing, and damaged equipment can
adversely affect respondents.
8. Keep your assessment instruments secure—developers and
administrators should restrict access to the instrument's
questions, and the measures should be periodically revised.
9. Maintain the confidentiality of the results—the results should
be shared only with those who have a legitimate need to know.
Personal information should not be released to other
organizations or individuals without the informed consent of the
respondent.
10. Interpret the scores properly—the inferences made from the
results should be reasonable, well founded, and not based on
superficial interpretation; careful attention should be paid to
contamination and deficiency errors; the manual for the tools
should also provide instructions on how to properly interpret the
results.
Selection Errors
selection errors
not hiring someone who would have been successful at the job
or hiring someone who is not successful at the job
whole-person approach
the practice of using a variety of measures and procedures to
more fully assess people
standardization
the consistent administration and use of a measure
objectivity
the amount of judgment or bias involved in scoring an
assessment measure
Professionally developed measures and procedures that are used
as part of a planned assessment program can help you select and
hire more qualified and productive employees even if the
measures are not perfect. It is essential to understand that all
assessment tools are subject to errors. both in measuring a
characteristic, such as verbal ability, and in predicting job
success criteria, such as job performance. This is true for all
measures and procedures.
· Do not expect any measure or procedure to measure a personal
trait or ability with perfect accuracy for every single person.
· Do not expect any measure or procedure to be completely
accurate in terms of predicting a candidate's job success.
Certainly, selecting employees who are highly able is important.
However, there are many factors that affect a person's
performance. You also need a motivated employee who clearly
understands the job to be performed, for example. The employee
also needs the time and resources necessary to succeed in the
job. Several of these factors can be predicted using good
measurement tools. This is why selection procedures typically
involve three to five distinct selection measures (at a minimum)
that are combined in some fashion to make a final hiring
decision.
Despite these efforts, there always will be cases in which a
score or procedure will predict someone to be a good worker,
who, in fact, is not. There will also be cases in which an
individual receiving a low score will be rejected when he or she
would actually be a capable and good worker. In the staffing
profession, these errors are called selection errors. False
positives and false negatives are two types of selection errors.
False positives occur when you erroneously classify a weak
applicant as being a good hire. False negatives occur when you
erroneously classify a strong applicant as being a weak hire. As
you try to reduce one type of error you may increase the other
so there are trade-offs in how you make your hiring decision.
These issues will be covered more in the following chapters.
Selection errors cannot be completely avoided, but they can be
reduced, for example, by using a variety of measures. Using a
variety of measures and procedures to more fully assess people
is referred to as the whole-person approach to assessment. This
approach will help reduce the number of selection errors and
boost the effectiveness of your overall decision making.33
Standardization and Objectivity
Standardization is the consistent administration and use of a
measure. Standardization reflects the consistency and
uniformity of the conditions as well as the procedures for
administering an assessment method. Computerization helps to
ensure that all respondents receive the same instructions and the
same amount of time to complete the assessment. Because
maintaining standardized conditions is the responsibility of the
people administering the assessment, training all administrators
in proper procedures and control of conditions is critical. This
is true for interviewing as well as any other assessment
approach. In addition to being legally important, standardization
is also valuable because recruiters should consistently evaluate
candidates on their competencies, styles, and traits.
Norms reflect the distribution of scores of a large number of
people whose scores on an assessment method are to be
compared. The standardization sample is the group of
respondents whose scores are used to establish norms. These
norms become the comparison scores for determining the
relative performance of future respondents.
Objectivity refers to the amount of judgment or bias involved in
scoring an assessment measure. The scoring process for
objective measures is free of personal judgment or bias. The
number of words typed in a minute is an objective measure, as
is the amount of weight a firefighter candidate can lift.
Subjective measures, on the other hand, contain items (such as
essay or interview questions) for which the score can be
influenced by the attitudes, biases, and personal characteristics
of the person doing the scoring. Whenever hiring decisions are
subjective, it is also a good idea to involve multiple people in
the hiring process, preferably of diverse gender and race, to
generate a more defensible decision.34 Because they produce
the most accurate measurements, it is best to use standardized,
objective measures whenever possible.
CREATING AND VALIDATING AN ASSESSMENT SYSTEM
Creating an effective assessment and selection system for any
position in any organization begins with a job analysis. As you
learned in Chapter 4, after understanding the requirements of
job success, you identify the important knowledge, skills,
abilities, and other characteristics (KSAOs) and competencies
required of a successful employee. You then identify reliable
and valid methods of measuring these KSAOs and
competencies, and create a system for measuring and collecting
the resulting data. The integrity and usefulness of the data
generated by each measure needs to be considered when
deciding which measures to use. The data collected from each
measure is then examined to ensure that it has an appropriate
mean and standard deviation. Remember, a measure on which
everyone scores the same or nearly the same is not as useful as
a measure that produces a wide range of scores. Candidates'
scores on each assessment method are then correlated or entered
into a regression equation to evaluate any redundancies among
the measures and to assess how well the group of measures
predicts job success. Adverse impact and the cost of the
measures are also considered in evaluating each measure. After
the final set of measures is identified, selection rules are
developed to determine which scores are passing. The
usefulness and effectiveness of the system is then periodically
reevaluated to ensure that it is still predicting job success
without adverse impact.
Benchmarking
It is sometimes useful to compare an organization's staffing data
with those of other organizations to understand better whether
the organization is doing well or poorly on a particular
dimension. For example, is a voluntary turnover rate of 30
percent good or bad? In some positions, such as the positions
held by retail employees, this would be a good turnover level
compared to the industry average. In other positions, a 30
percent turnover rate would be unusually high. Benchmarking
other firms can give a company comparative information about
dimensions including the following:
· Application rates
· Average starting salaries
· Average time to fill
· Average cost per hire
There are numerous sources of relatively high-quality
benchmark information, but it can be expensive. Some sources
of benchmarking data include
· Corporate Leadership Council
· Watson Wyatt and other staffing consulting firms
· Hackett Group
· The Saratoga Institute (now part of PricewaterhouseCoopers)
· Staffing.org
· Many industry associations, such as the Society for Human
Resource Management, track benchmark information and make
it available to their members.
Evaluating Assessment Methods
The determinants of the effectiveness of any internally or
externally developed assessment method include
1. Validity-—whether the assessment method predicts the
relevant components of job success
2. Return on investment—whether the assessment method
generates a financial return that exceeds the cost associated
with using it
3. Applicant reactions—including the perceived job relatedness
and fairness of the assessment method
4. Usability—the willingness and ability of people in the
organization to use the method consistently and correctly
5. Adverse impact—whether the method can be used without
discriminating against members of a protected class
6. The selection ratio—whether the method has a low selection
ratio
The importance of a firm's selection ratio and base rate to the
effectiveness of an assessment method deserve further
elaboration. Taylor and Russell35 were among the first to
demonstrate that validity alone will not determine the
usefulness of an assessment. The tables they generated, taking
into account selection ratio and base rate, demonstrated that
oSSGSSIIlfifltS Willi
227
high validity may not prove useful if a high number of those
assessed are hired and that assess-
ments with relatively low validity can still have a substantial
impact on the improvement of job
success rates if only a few of those assessed are hired. This
work laid the foundation for utih:
analysis, which is discussed in a later chapter.
selection ratio A selection ratio is the number of people hired
divided by the number of applicants.
the number of people hired divided by Lower selection ratios
mean that a lower percentage of applicants are hired, and higher
selection
the number of applicants ratios mean that a greater percentage
of applicants are hired. Lower selection ratios mean that the
company is being more selective, and can reflect either hiring a
low number of people or receiv-
ing a large number of applications. For example, a selection
ratio of 75 percent means that the
company is hiring 75 of every 100 applicants, which doesn't
give the assessment method as good
of a chance to weed out the applicants who are less likely to do
the job well. Imagine if your se-
lection ratio is 1.00 (100%), in which case you are hiring
everyone who applies—no assessment
tool can be useful in that circumstance.
base rate The base rate is the percent of employees who are
defined as currently successful per-
the percent of employees who are formers. Clearly,
organizations desire a base rate of 100 percent as this reflects a
situation in
defined as currently successfulwhich all employees are
performing satisfactorily. The firm's system of HR practices,
including
performers staffing, training, compensation, and
performance management, work together to affect a firm's
base rate. If your base rate is 100 percent, then everyone who
gets hired is already successful, and using an additional
assessment tool will not improve your success rate.
The potential to improve the effectiveness of a new assessment
system in terms of improving the base rate of a firm depends on
the percent of its currently successful employees (the current
base rate), the selection ratio, and the new assessment method's
validity.36 If the current base rate is high, and most employees
are successful in their jobs, the potential impact of the new
assessment method will be lower than if the base rate is lower
and more of the firm's employees are performing poorly. A
high-performing system (as evidenced by a high base rate)
simply has less room for improvement than a lower-performing
system.
Lowering the selection ratio can also improve the impact of the
selection system. A selection ratio of 80 percent means that the
company is only screening out 20 percent of its applicants and
is possibly hiring many candidates who its assessment system
has identified as lower potential performers. Of course, if the
sourcing and recruiting processes resulted in a high-quality
candidate pool that contains many potential high performers, a
lower selection ratio might not improve the firm's selection
process as much.
The validity of a new assessment method can also affect the
impact of the selection system. As we have discussed,
assessment methods with higher validities are better able to
improve the selection process than those with low validities. If
the current base rate is high, the current selection ratio is high,
and the validity of the new assessment method is moderate or
low, it may not be worthwhile to use it.
Hiring The Best Call Center Workers at Xerox
Xerox wanted to use a data-driven approach to improve hiring
quality and reduce turnover in its call centers. To do this, Xerox
validated its current hiring system and discovered that its
current system of preferring applicants who had done the job
before was ineffective—call center experience didn't matter to
performance or retention. After collecting data on broader
characteristics related to performance and retention, Xerox
learned that personality mattered a lot in predicting who would
perform well and stay at least six months, long enough for the
company to recoup its $5,000 investment in training its new
hires. It learned that although inquisitive or empathetic people
tended to quit, creative personalities tended to stay longer and
performed better. Xerox also learned that living near the job and
having reliable transportation were important to retention.37
A half-year trial of a new assessment system focusing on
personality found that new hire attrition was reduced by 20
percent and performance improved. Xerox now uses software to
screen applicants for its 48,700 call center jobs. Applicants take
a 30-minute computerized test that asks them to respond to
scenarios they might encounter on the job and to choose
between statements including, "I ask more questions than most
people do" and "People tend to trust what I say." Applicants'
personality traits, including creativity, are evaluated
automatically and the program spits out a score: red for low
potential, yellow for medium potential, or green for high
potential. Xerox occasionally hires some yellows if it thinks it
can train them, but primarily hires greens.38
Chapter 8 • Measurement 207
5 Chapter 8 • Measurement 208
companies in the United States, states they were able to work
with PeopleAnswers to reduce turnover by 50 percent using
screening and assessment technologies developed using data
analytics. The cornerstone of using data effectively is collecting
high-quality information on the right predictors and outcomes.9
WHAT IS MEASUREMENT?
Chapter 8 • Measurement 207
206 Chapter 8 • Measurement
MEASUREMENT
the process of assigning numbers according to some rule or
convention to aspects of people, jobs, job success, or aspects of
the staffing system
DATA
the numerical outcomes of measurement
PREDICTIVE DATA
information about measures used to make projections about
outcomes
CRITERION DATA
information about important outcomes of the staffing process
Evaluating people, processes, or outcomes requires collecting
data, which requires measurement. In staffing, measurement is
the process of assigning numbers according to some rule or
convention to aspects of people, jobs, job success, or aspects of
the staffing system.10 These measures can be used to select
individual employees or to assess the staffing process in
general. Interview ratings, knowledge test scores, and
performance data are measures used to select employees.
Measures relevant to the staffing process in general assess the
following: (a) characteristics of the job (which enables the firm
to create job requirements and job rewards matrices), (b)
aspects of the staffing system (such as the number of days a job
posting is run. where it is run, and the nature of the recruiting
message), (c) characteristics of job candidates (such as
personality or ability), and (d) staffing outcomes (such as
performance or turnover). These types of measures enable the
firm to improve its staffing system by identifying important
patterns and relationships that can be used to make decisions or
to design assessments and interventions.
The numerical outcomes of measurement are data. Strategic
staffing centers around collecting and analyzing the relationship
between two types of data:11
1. Predictive data is information used to make projections about
outcomes. For example, what data might you collect to predict
turnover or job performance? Similarly, could you measure the
conscientiousness of job candidates to see if it predicts some
component of job success? This is predictive data. In terms of
the general staffing system, predictive data can come from any
part of the hiring process and can include information on
sourcing quality, the basic qualifications of applicants, and their
traits, competencies, and values.
2. Criterion data is information about important outcomes of the
staffing process. Traditionally, this data includes measuring the
job success of employees. More generally, criterion data should
also include all outcome information relevant to the evaluation
of the effectiveness of the staffing system against its goals. This
can include measuring a company's return on investment related
to its staffing measures, employee job success, time-to-hire,
time-to-productivity, promotion rates, turnover rates, and new
hire fit with company values.
In short, criterion data is information about outcomes of the
staffing or selection process. Predictive data gives you
information about the possible predictors of those outcomes.
Once you have collected data, you have to do something with it.
Next, we discuss basic tools and techniques for describing and
interpreting data, followed by a discussion of the characteristics
of useful measures. It is critical to note that it is nearly
pointless to analyze and interpret data that is of low quality.
The data must be accurate, dependable, and relevant to be worth
collecting and analyzing.
DESCRIBING AND INTERPRETING DATA
When a measure, such as an assessment test, is administered to
job candidates, the data needs to be interpreted before it can be
useful in making hiring decisions. Describing the scores within
a distribution is important for interpreting what they mean for
the entire group of candidates, as well as understanding the
significance of any one particular score.
Types of Measurement
The tools you can use to describe and interpret the data depend
on the level of measurement. The data can come from nominal,
ordinal, interval, or ratio measures.
NOMINAL In nominal measurement, numbers are assigned to
discrete labels or categories. No ordering is implied in the
assigned values. Gender, race, and college major are examples
of nominal measures. You could assign a "0" to males and a "1"
to females to create a nominal measure for gender.
ORDINAL In ordinal measurement, attributes are ranked by
assigning numbers in ascending or descending order. For
example, the first person finishing a work sample task might
receive a "1," the second person "2," and so on. Ordinal
measures don't tell you anything about the distance between the
scores, though—just their rank.
INTERVAL In interval measurement, the distance between
scores has meaning. The distance from 40 to 50 degrees in
Fahrenheit is the same as the distance from 80 to 90 degrees.
Thus, the interval is constant. However, the zero point on
interval measures is arbitrary, so ratios computed using two
different measures of the same attribute will not yield the same
result. For example, 100 degrees Fahrenheit is twice that of 50
degrees Fahrenheit but when converted to Celsius the 2:1 ratio
doesn't hold. Examples of interval measurement in selection
may include intelligence scores, personality assessment scores,
and scoring keys for interview questions.
RATIO Ratio measurement includes a true and meaningful zero
point. Thus, you can construct ratios from the measure. Salary,
weight, height, typing speed, and sales per month are examples
of ratio-level measures. If one person can lift 200 pounds and
another 100 pounds, then the first person can lift twice as much
as the second person whether the weight is in grams or pounds.
Thus, the ratio holds because there is a true zero point. In a
selection context, years of experience is a ratio measure because
ratios will hold whether time is measured in years, minutes, or
seconds.
The distinctions among the different types of measures are
important because they influence how you can describe and
interpret data. For example, it is generally not useful to
compute an average of ordinal scores.
Scores
The process of assigning numerical values during measurement
is scoring. In order to interpret scores properly, we need to
understand the scoring system used. Data is often presented in
terms of numerical scores, such as raw scores, standard scores,
and percentile scores, which we discuss next.
RAW SCORES Raw scores are the unadjusted scores on a
measure. On a job knowledge test, the raw score might represent
the number of items answered correctly. For measures such as
personality inventories that have no "right" or "wrong" answers,
the raw score may represent the number of positive responses
for a particular trait. Raw scores do not provide much useful
information by themselves. Consider your score on a midterm.
If you get 30 out of 50 questions correct, it is hard to know
whether this is a good or a poor score. You may believe 30 is a
poor score, but if you compare the results to the results of other
people who took the same test, you may discover that 30 is the
highest score. For criterion-referenced measures, or standards-
based assessments, the scores have meaning in and of
themselves. For example, candidates might be expected to
exceed a certain level on a criterion measure, such as typing at
least 90 words per minute, before they can advance to the next
stage of the hiring process.
On criterion-referenced measures it is easy to see what a
particular score indicates about proficiency or competence. In
general, scores on norm-referenced measures have meaning only
when compared to the scores of others. For example, candidates
who reach a certain norm-referenced measure—for example,
who score in the top third of their applicant group on a typing
test—would advance to the next stage of the hiring process.
Converting raw scores into standard scores (or percentiles), as
we describe next, provides you with the kind of comparative
information you need to use a norm-referenced measure.
NOMINAL MEASUREMENT
a measurement in which numbers are assigned to discrete labels
or categories
ORDINAL MEASUREMENT
a measurement in which attributes are ranked by assigning
numbers in ascending or descending order
INTERVAL MEASUREMENT
a measurement in which the distance between scores on an
attribute has meaning
RATIO MEASUREMENT
a measurement in which the distance between scores has
meaning; it includes a true and meaningful zero point
RAW SCORES
the unadjusted scores on a measure
CRITERION-REFERENCED MEASURES
measures in which the scores have meaning in and of
themselves
NORM-REFERENCED MEASURES
measures in which the scores have meaning only when
compared to the scores of others
NORMAL CURVE Many human characteristics, such as
height, weight, math ability, and normal curve
typing skill, are distributed in the population in a typical pattern
known as the normal a curve representing the bell-shaped
curve. In other words, the characteristics display a symmetrical
bell-shaped appearance like symmetrical distribution of some
factor
(
Percent of Sample
= .13
2.14
13.59
34.13
34.13
13.59 2.14
Percentiles
.13
2.28
15.87
50.00
84.13
97.72 99.87
Standardized Score
-3
-2
-1
0
+1
+2 +3
TestX
35
40
45
50
55
60 65
TestY
40
60
80
100
120
140 160
=.13
FIGURE 8-1
The Normal Curve Illustrating Standard Scores and Percentiles
)
NORMAL DISTRIBUTION
the distribution of scores under the normal curve
the one shown in Figure 8-1. The distribution of scores under
the normal curve is called the normal distribution. As you can
see, a large number of individual cases cluster in the middle of
the curve. The farther from the middle (or average) you go, the
fewer the cases. Many distributions of scores follow the same
normal curve pattern. Most individuals get scores in the middle
range, near average. As score extremes are approached, fewer
and fewer cases exist, indicating that progressively fewer
individuals get lower scores (represented by the left tail of the
curve) or higher scores (represented by the right tail of the
curve). Other distributions are possible but we will focus on the
normal distribution because it is one of the most commonly
used.
PERCENTILE SCORE
a raw score that has been converted into an expression of the
percentage of people who score at or below that score
PERCENTILE SCORE A percentile score is a raw score that has
been converted into an expression of the percentage of people
who score at or below that score. For example, in Figure 8-1, a
score of 55 on Test X or 120 on Test Y would place a person at
about the 84th percentile. This means that 84 percent of the
people taking the test scored at or below this individual's score.
The second horizontal line below the curve in Figure 8-1
labeled "Percentiles" represents the distribution of scores in
percentile units. By knowing the percentile score of an
individual, you already know how that individual compares with
others in the group. An individual at the 98th percentile scored
the same as or better than 98 percent of the individuals in the
group. This is approximately equivalent to getting a raw score
of 60 on Test X or 140 on Test Y.
Percentiles can yield useful information. Assume you want to
make highly competitive job offers. You can use data sources
such as the Bureau of Labor and Statistics (BLS), which
typically report the 10th, 25th, 50th, 75th, and 90th percentiles
in the distribution of salaries for a given occupation. If you
wish to pay salaries at the top 10 percent of the distribution,
then you can use the BLS's percentiles to figure out how much
you should pay.
You can also collect salary information from within your firm
to determine what might be a competitive job offer. Assume you
collected data from all your employees on their current salary
levels. How might you describe the data? We discuss this next.
CENTRAL TENDENCY
the midpoint, or center, of the data MEAN
a measure of central tendency reflecting the average score
MEDIAN
the middle score, or the point below which 50 percent of the
scores fall
MODE
the most commonly observed score
CENTRAL TENDENCY Central tendency describes the
midpoint, or center, of the data. Typical measures of central
tendency include the mean, median, and mode. The mean is a
measure of central tendency reflecting the average score. For
example, you could compute the average salary and then pay at
or above this level to be competitive. The median is the middle
score, or the 50th percentile, which is the point below which 50
percent of the scores fall below. The mode is the most
commonly observed score.
If scores are normally distributed, as they are in Figure 8-1,
then the mean, median, and mode are in the same position. This
is not always the case if scores are not normally distributed. In
the case of data on annual pay, a distribution could have most
employees at the left (lower end) of the range and relatively few
employees at the high end. This is not a normal distribution.
This is regularly observed in organizations, and it is called
positive skew. In this case, the mode would be to the left, near
the bulk of the distribution, because it is the most commonly
observed
score. The mean would be shifted to the right due to the high
annual pay for a limited number of employees. The median
would be somewhere in between. In this case, the firm might
extend different job offers depending on which measure it used
to describe the data. In labor disputes, it is not uncommon for
managers to use average pay as a reference point (indicating
higher pay across employees) whereas unions use the mode or
median as a reference point (indicating lower pay across
employees).
Alternatively, you might see a bimodal distribution, or a
distribution with two modes, for annual pay. The mean and
median would fall between the two modes but neither would be
representative of true compensation levels because there are
probably two separate employee groups represented in the data.
Perhaps the two modes represent some employees who are paid
on a salary basis and other employees who are paid on an hourly
basis. In this case, you might use one of the two modes to
determine your competitive offer for compensation, or you
could compute the mean, median, and mode separately for the
two groups.
VARIABILITY Variability describes the "spread" of the data
around the midpoint. If you were told that an applicant scored
76 out of 100 points on a work sample test, what would you
think? It's hard to know what to conclude without more
information. What if you were told the mean was 70? This
additional information helps because you can tell that the
applicant did better than average, but you are still missing
important information. How much better or worse did the
applicant actually fare? To answer this, you need to know the
variability of scores. What would you think if the lowest score
was 64 and the highest was 76? What if you were told the
lowest score was 40 and the highest 100? Knowing the
variability of a distribution changes your interpretation of
scores.
There are a number of alternative measures of variability but
typical measures include the range, variance, and standard
deviation. The range is the difference between the highest and
lowest observed scores. The range is highly influenced by any
single extreme score (an outlier) so it may not effectively
represent the true variability in the data. Other measures of
variability such as the variance and standard deviation are less
affected by outliers. The variance is a mathematical measure of
the spread based on squared deviations of scores from the mean.
You can find the formula for variance in the supplement at the
end of this chapter. The standard deviation is conceptually
similar to the average distance from the mean of a set of scores.
It is the positive square root of the variance. A data set with a
larger standard deviation has scores with more variance and a
larger range. For example, if the average score on a measure
was 70, and the standard deviation was 3, the scores would be
more tightly clustered around the mean than if the standard
deviation was 15. If all the scores were the same, the standard
deviation would be 0. If everyone scores the same on a measure,
the measure isn't useful in predicting job performance or
deciding who to hire. You can see in Figure 8-1 that the range
and standard deviation are smaller for Test X than they are for
Test Y.
STANDARD SCORES Standard scores are converted raw scores
that indicate where a person's score lies in comparison to a
referent group. A common standard score is a z score, which
measures the distance of a score from the mean in standard
deviation units. There are three determinants of a z score: the
raw score and the mean and standard deviation of the entire set
of scores.
Look at Figure 8-1. Test X and Test Y have different raw score
means. Notice that Test X has a mean of 50 and Test Y has a
mean of 100. If an individual got a score of 65 on Test X, that
person did very well. However, a score of 65 on Test Y would
be a poor score. Raw scores often carry limited information by
themselves.
Figure 8-1 shows the percent of cases 1, 2, and 3 standard
deviations above the mean and 1, 2, and 3 standard deviations
below the mean. As you can see, 34 percent of the cases lie
between the mean and +1 standard deviation, and 34 percent of
the cases lie between the mean and —1 standard deviation.
Thus, approximately 68 percent of the cases lie between —1 and
+1 standard deviations. Note that for Test X, the standard
deviation is 5, and 68 percent of the test takers scored between
45 and 55. For Test Y, the standard deviation is 20, and 68
percent of the test takers scored between 80 and 120.
A z score is calculated by subtracting the referent group's mean
from the target individual's raw score, and dividing the
difference by the measure's standard deviation in the referent
group. The resulting standard z score indicates how many
standard deviations the individual's
VARIABILITY
a measure that describes the "spread" of the data around the
midpoint
RANGE
the difference between the highest and lowest observed score
OUTLIER
a score that is much higher or lower than most of the scores in a
distribution
VARIANCE
a mathematical measure of the spread based on squared
deviations of scores from the mean
STANDARD DEVIATION
the positive square root of the variance; it is conceptually
similar to the average distance from the mean of a set of scores
STANDARD SCORES
converted raw scores that indicate where a person's score lies in
comparison to a referent group
ZSCORE
a standard score that indicates the distance of a score from the
mean in standard deviation units
score is above or below the mean of the referent group. It can
be seen in Figure 8-1 that approximately 84 percent of scores
fall below a z score of +1, whereas nearly 100 percent of people
fall below a z score of +3. The simple formula for a z score is
Zscore = (Individual's raw score - Referent group
mean)/Referent group standard deviation
A z score is negative when the target individual's raw score is
below the referent group's mean, and positive when the target
individual's raw score is above the referent group's mean.
To compare candidates, we often need a single overall score
that represents each candidate's combined performance on all of
the assessment methods used to evaluate them. Combining a
candidate's raw scores on two or more measures that use
different scoring systems is difficult. Imagine an assessment
system that evaluates candidates using an interview scored on a
l-to-10 scale and a job knowledge test that is scored on a 0-to-
100 scale. Simply averaging the two scores would give
disproportionate weight to one of the tests, depending on the
mean and standard deviation. Standardizing both scores by
converting them to z scores allows them to be easily combined,
as shown in Table 8-1.
In Table 8-1, the interview scores have a range of 15 to 22, a
mean of 18.25, and a standard deviation of 3. The job
knowledge test has a range of 69 to 87, a mean of 78.25, and a
standard deviation of 7.46. If you subtract the mean from each
raw score and divide by the standard deviation, you will obtain
the standard score. For Felix, the calculations would be (15 -
18.25)/3 = -1.1 and (87 - 78.25)/7.46 = 1.2 (after rounding).
Although meaningfully combining the raw scores would be
difficult, combining the z scores is easy and results in a single
number reflecting how each candidate did on both of the
assessment methods relative to the other candidates. In this
case, Sue's outstanding interview score allowed her to overcome
her slightly below-average job knowledge test score to be the
candidate with the highest overall score. If a company wants to
weight multiple assessment methods differently, each standard
score can be multiplied by the desired weighting percentage.
For example, the formula for weighting the interview score 60
percent and the job knowledge test score 40 percent would be
Overall score = (0.6 X ziwerview) + (0.4 X Zj0bknowiedgeteSt)
For Felix, this would be (0.6 X -1.1) + (0.4 X 1.2) = -0.18
rather than the 0.1 he received when the interview and
knowledge test were equally weighted.
Shifting the Normal Curve
(
Raw
Standard
Raw
Standard
Standard Units
Felix
15
-1.1
87
1.2
(-1.1 + 1.2) = 0.1
Sue
22
1.3
77
-0.2
(1.3 - 0.2) = 1.1
Lin
19
0.3
69
-1.2
(0.3 - 1.2) = -0.9
Pierre
17
-0.4
80
0.2
(-0.4 + 0.2) = -0.2
ByiBKHP
Converting Raw Scores to Standard Scores
Job Knowledge
Candidate
Interview Score
Test Score
Overall Score
)When making candidate selection decisions, it is often assumed
that the distribution of applicants' fit with the job reflects the
normal curve as depicted by the current talent pool shown in
Figure 8-2. If this is true, then a large burden is placed on the
selection system to accurately identify which candidates fall to
the far right of the curve (the best hires). In practice, however,
many of the most desirable people for a position are not in the
applicant pool at all. The most talented and competent people
are often successfully employed because they are usually being
promoted and rewarded for the work they do. As a result, most
of these people are semi-passive job seekers at best. Without an
effective sourcing and recruiting process, they will not apply to
your firm. For example, during the 2008 economic downturn, it
was difficult to get passive job seekers with deep experience
and a proven track record in advertising to apply for positions
at other companies.12

More Related Content

Similar to 228 Chapter 8 • Measurementto collect more validation data mor.docx

Contractor Safety Beyond Compliance
Contractor Safety Beyond ComplianceContractor Safety Beyond Compliance
Contractor Safety Beyond Compliancebrowzcompliance
 
Reliability and validity w3
Reliability and validity w3Reliability and validity w3
Reliability and validity w3Muhammad Ali
 
Reliability and validity
Reliability and validityReliability and validity
Reliability and validityMuhammad Ali
 
PRINCIPLES OF MARKETING MODULE 3.2.pptx
PRINCIPLES OF MARKETING MODULE 3.2.pptxPRINCIPLES OF MARKETING MODULE 3.2.pptx
PRINCIPLES OF MARKETING MODULE 3.2.pptxYatogami27
 
Organizational BehaviorEighteenth EditionChapter 17Human R.docx
Organizational BehaviorEighteenth EditionChapter 17Human R.docxOrganizational BehaviorEighteenth EditionChapter 17Human R.docx
Organizational BehaviorEighteenth EditionChapter 17Human R.docxvannagoforth
 
Performance appraisal measures
Performance appraisal measuresPerformance appraisal measures
Performance appraisal measuresdbell3034
 
Nurse performance appraisal
Nurse performance appraisalNurse performance appraisal
Nurse performance appraisalritahenry316
 
Sample of performance appraisal form
Sample of performance appraisal formSample of performance appraisal form
Sample of performance appraisal formzonaharper2
 
Organizational performance
Organizational performanceOrganizational performance
Organizational performanceMahmoud Shaqria
 
What the Department of Labor Says About the Assessments You Use
What the Department of Labor Says About the Assessments You UseWhat the Department of Labor Says About the Assessments You Use
What the Department of Labor Says About the Assessments You Usesceb
 
Performance-Appraisal.docx
Performance-Appraisal.docxPerformance-Appraisal.docx
Performance-Appraisal.docxAkshataBansode1
 
SUSL - Selection ( HRM )
SUSL - Selection ( HRM )SUSL - Selection ( HRM )
SUSL - Selection ( HRM )Undergraduate
 
Recruitment & selection ch# 15 & 16
Recruitment & selection ch# 15 & 16Recruitment & selection ch# 15 & 16
Recruitment & selection ch# 15 & 16Dreams Design
 
Performance appraisal.pptx
Performance appraisal.pptxPerformance appraisal.pptx
Performance appraisal.pptxSatyaM733268
 

Similar to 228 Chapter 8 • Measurementto collect more validation data mor.docx (20)

Hrm
HrmHrm
Hrm
 
Contractor Safety Beyond Compliance
Contractor Safety Beyond ComplianceContractor Safety Beyond Compliance
Contractor Safety Beyond Compliance
 
Data management (1)
Data management (1)Data management (1)
Data management (1)
 
Reliability and validity w3
Reliability and validity w3Reliability and validity w3
Reliability and validity w3
 
Reliability and validity
Reliability and validityReliability and validity
Reliability and validity
 
7 M's of Management
7 M's of Management7 M's of Management
7 M's of Management
 
PRINCIPLES OF MARKETING MODULE 3.2.pptx
PRINCIPLES OF MARKETING MODULE 3.2.pptxPRINCIPLES OF MARKETING MODULE 3.2.pptx
PRINCIPLES OF MARKETING MODULE 3.2.pptx
 
Organizational BehaviorEighteenth EditionChapter 17Human R.docx
Organizational BehaviorEighteenth EditionChapter 17Human R.docxOrganizational BehaviorEighteenth EditionChapter 17Human R.docx
Organizational BehaviorEighteenth EditionChapter 17Human R.docx
 
Performance appraisal measures
Performance appraisal measuresPerformance appraisal measures
Performance appraisal measures
 
Assessment centre methodology
Assessment centre methodology Assessment centre methodology
Assessment centre methodology
 
Nurse performance appraisal
Nurse performance appraisalNurse performance appraisal
Nurse performance appraisal
 
Sample of performance appraisal form
Sample of performance appraisal formSample of performance appraisal form
Sample of performance appraisal form
 
Organizational performance
Organizational performanceOrganizational performance
Organizational performance
 
What the Department of Labor Says About the Assessments You Use
What the Department of Labor Says About the Assessments You UseWhat the Department of Labor Says About the Assessments You Use
What the Department of Labor Says About the Assessments You Use
 
Performance-Appraisal.docx
Performance-Appraisal.docxPerformance-Appraisal.docx
Performance-Appraisal.docx
 
SUSL - Selection ( HRM )
SUSL - Selection ( HRM )SUSL - Selection ( HRM )
SUSL - Selection ( HRM )
 
Recruitment & selection ch# 15 & 16
Recruitment & selection ch# 15 & 16Recruitment & selection ch# 15 & 16
Recruitment & selection ch# 15 & 16
 
Mb0043
Mb0043Mb0043
Mb0043
 
Mb0043
Mb0043Mb0043
Mb0043
 
Performance appraisal.pptx
Performance appraisal.pptxPerformance appraisal.pptx
Performance appraisal.pptx
 

More from eugeniadean34240

I need a 7 pg research essay on the following   Select a real o.docx
I need a 7 pg research essay on the following   Select a real o.docxI need a 7 pg research essay on the following   Select a real o.docx
I need a 7 pg research essay on the following   Select a real o.docxeugeniadean34240
 
I need a 4-5 APA formatted paper with references that is clearly wri.docx
I need a 4-5 APA formatted paper with references that is clearly wri.docxI need a 4-5 APA formatted paper with references that is clearly wri.docx
I need a 4-5 APA formatted paper with references that is clearly wri.docxeugeniadean34240
 
I need a 3 page research paper on Title  Addictive being youn.docx
I need a 3 page research paper on Title  Addictive being youn.docxI need a 3 page research paper on Title  Addictive being youn.docx
I need a 3 page research paper on Title  Addictive being youn.docxeugeniadean34240
 
I need a 3 page double-spaced 12-point paper on Immunotherapy. the i.docx
I need a 3 page double-spaced 12-point paper on Immunotherapy. the i.docxI need a 3 page double-spaced 12-point paper on Immunotherapy. the i.docx
I need a 3 page double-spaced 12-point paper on Immunotherapy. the i.docxeugeniadean34240
 
I need a 2500 word essay on the 1st Battalion 7th Cavalry Regiment. .docx
I need a 2500 word essay on the 1st Battalion 7th Cavalry Regiment. .docxI need a 2500 word essay on the 1st Battalion 7th Cavalry Regiment. .docx
I need a 2500 word essay on the 1st Battalion 7th Cavalry Regiment. .docxeugeniadean34240
 
I need a 200-word paper that answers the following questions:D.docx
I need a 200-word paper that answers the following questions:D.docxI need a 200-word paper that answers the following questions:D.docx
I need a 200-word paper that answers the following questions:D.docxeugeniadean34240
 
i need a 2 page essay on LA crimes as it pertains to Rape you will h.docx
i need a 2 page essay on LA crimes as it pertains to Rape you will h.docxi need a 2 page essay on LA crimes as it pertains to Rape you will h.docx
i need a 2 page essay on LA crimes as it pertains to Rape you will h.docxeugeniadean34240
 
I need a 1 page professional bio. My cover letter and resume i.docx
I need a 1 page professional bio. My cover letter and resume i.docxI need a 1 page professional bio. My cover letter and resume i.docx
I need a 1 page professional bio. My cover letter and resume i.docxeugeniadean34240
 
I need 100 words response for this two discussion forum1 discu.docx
I need 100 words response for this two discussion forum1 discu.docxI need 100 words response for this two discussion forum1 discu.docx
I need 100 words response for this two discussion forum1 discu.docxeugeniadean34240
 
I need 200 words response for each discussion post.Guided Respon.docx
I need 200 words response for each discussion post.Guided Respon.docxI need 200 words response for each discussion post.Guided Respon.docx
I need 200 words response for each discussion post.Guided Respon.docxeugeniadean34240
 
I need 3 pages discussion for an intersection (Attached image).docx
I need 3 pages discussion for an intersection (Attached image).docxI need 3 pages discussion for an intersection (Attached image).docx
I need 3 pages discussion for an intersection (Attached image).docxeugeniadean34240
 
I need 1page write up on Hypothesis & Methods Proposal,Due on .docx
I need 1page write up on Hypothesis & Methods Proposal,Due on .docxI need 1page write up on Hypothesis & Methods Proposal,Due on .docx
I need 1page write up on Hypothesis & Methods Proposal,Due on .docxeugeniadean34240
 
I need 2-3 pages written about the sieve of Eratosthenes. Starti.docx
I need 2-3 pages written about the sieve of Eratosthenes. Starti.docxI need 2-3 pages written about the sieve of Eratosthenes. Starti.docx
I need 2-3 pages written about the sieve of Eratosthenes. Starti.docxeugeniadean34240
 
I need 120 words for each question. Please ensure to post individual.docx
I need 120 words for each question. Please ensure to post individual.docxI need 120 words for each question. Please ensure to post individual.docx
I need 120 words for each question. Please ensure to post individual.docxeugeniadean34240
 
I need 10-12 slides Presentation with detailed speaker notes. Instru.docx
I need 10-12 slides Presentation with detailed speaker notes. Instru.docxI need 10-12 slides Presentation with detailed speaker notes. Instru.docx
I need 10-12 slides Presentation with detailed speaker notes. Instru.docxeugeniadean34240
 
I N N O V A T I O N N E T W O R K , I N C . www.innone.docx
I N N O V A T I O N  N E T W O R K ,  I N C .   www.innone.docxI N N O V A T I O N  N E T W O R K ,  I N C .   www.innone.docx
I N N O V A T I O N N E T W O R K , I N C . www.innone.docxeugeniadean34240
 
I like to tie my learning to Biblical Principles. On Virtuous Le.docx
I like to tie my learning to Biblical Principles. On Virtuous Le.docxI like to tie my learning to Biblical Principles. On Virtuous Le.docx
I like to tie my learning to Biblical Principles. On Virtuous Le.docxeugeniadean34240
 
I just want one paragraph.!!C.W.Mills described ‘sociological im.docx
I just want one paragraph.!!C.W.Mills described ‘sociological im.docxI just want one paragraph.!!C.W.Mills described ‘sociological im.docx
I just want one paragraph.!!C.W.Mills described ‘sociological im.docxeugeniadean34240
 
i just need serious help answering the question. I have answered mos.docx
i just need serious help answering the question. I have answered mos.docxi just need serious help answering the question. I have answered mos.docx
i just need serious help answering the question. I have answered mos.docxeugeniadean34240
 
I Headnotes and indexes are copyrighted and may not be duplica.docx
I Headnotes and indexes are copyrighted and may not be duplica.docxI Headnotes and indexes are copyrighted and may not be duplica.docx
I Headnotes and indexes are copyrighted and may not be duplica.docxeugeniadean34240
 

More from eugeniadean34240 (20)

I need a 7 pg research essay on the following   Select a real o.docx
I need a 7 pg research essay on the following   Select a real o.docxI need a 7 pg research essay on the following   Select a real o.docx
I need a 7 pg research essay on the following   Select a real o.docx
 
I need a 4-5 APA formatted paper with references that is clearly wri.docx
I need a 4-5 APA formatted paper with references that is clearly wri.docxI need a 4-5 APA formatted paper with references that is clearly wri.docx
I need a 4-5 APA formatted paper with references that is clearly wri.docx
 
I need a 3 page research paper on Title  Addictive being youn.docx
I need a 3 page research paper on Title  Addictive being youn.docxI need a 3 page research paper on Title  Addictive being youn.docx
I need a 3 page research paper on Title  Addictive being youn.docx
 
I need a 3 page double-spaced 12-point paper on Immunotherapy. the i.docx
I need a 3 page double-spaced 12-point paper on Immunotherapy. the i.docxI need a 3 page double-spaced 12-point paper on Immunotherapy. the i.docx
I need a 3 page double-spaced 12-point paper on Immunotherapy. the i.docx
 
I need a 2500 word essay on the 1st Battalion 7th Cavalry Regiment. .docx
I need a 2500 word essay on the 1st Battalion 7th Cavalry Regiment. .docxI need a 2500 word essay on the 1st Battalion 7th Cavalry Regiment. .docx
I need a 2500 word essay on the 1st Battalion 7th Cavalry Regiment. .docx
 
I need a 200-word paper that answers the following questions:D.docx
I need a 200-word paper that answers the following questions:D.docxI need a 200-word paper that answers the following questions:D.docx
I need a 200-word paper that answers the following questions:D.docx
 
i need a 2 page essay on LA crimes as it pertains to Rape you will h.docx
i need a 2 page essay on LA crimes as it pertains to Rape you will h.docxi need a 2 page essay on LA crimes as it pertains to Rape you will h.docx
i need a 2 page essay on LA crimes as it pertains to Rape you will h.docx
 
I need a 1 page professional bio. My cover letter and resume i.docx
I need a 1 page professional bio. My cover letter and resume i.docxI need a 1 page professional bio. My cover letter and resume i.docx
I need a 1 page professional bio. My cover letter and resume i.docx
 
I need 100 words response for this two discussion forum1 discu.docx
I need 100 words response for this two discussion forum1 discu.docxI need 100 words response for this two discussion forum1 discu.docx
I need 100 words response for this two discussion forum1 discu.docx
 
I need 200 words response for each discussion post.Guided Respon.docx
I need 200 words response for each discussion post.Guided Respon.docxI need 200 words response for each discussion post.Guided Respon.docx
I need 200 words response for each discussion post.Guided Respon.docx
 
I need 3 pages discussion for an intersection (Attached image).docx
I need 3 pages discussion for an intersection (Attached image).docxI need 3 pages discussion for an intersection (Attached image).docx
I need 3 pages discussion for an intersection (Attached image).docx
 
I need 1page write up on Hypothesis & Methods Proposal,Due on .docx
I need 1page write up on Hypothesis & Methods Proposal,Due on .docxI need 1page write up on Hypothesis & Methods Proposal,Due on .docx
I need 1page write up on Hypothesis & Methods Proposal,Due on .docx
 
I need 2-3 pages written about the sieve of Eratosthenes. Starti.docx
I need 2-3 pages written about the sieve of Eratosthenes. Starti.docxI need 2-3 pages written about the sieve of Eratosthenes. Starti.docx
I need 2-3 pages written about the sieve of Eratosthenes. Starti.docx
 
I need 120 words for each question. Please ensure to post individual.docx
I need 120 words for each question. Please ensure to post individual.docxI need 120 words for each question. Please ensure to post individual.docx
I need 120 words for each question. Please ensure to post individual.docx
 
I need 10-12 slides Presentation with detailed speaker notes. Instru.docx
I need 10-12 slides Presentation with detailed speaker notes. Instru.docxI need 10-12 slides Presentation with detailed speaker notes. Instru.docx
I need 10-12 slides Presentation with detailed speaker notes. Instru.docx
 
I N N O V A T I O N N E T W O R K , I N C . www.innone.docx
I N N O V A T I O N  N E T W O R K ,  I N C .   www.innone.docxI N N O V A T I O N  N E T W O R K ,  I N C .   www.innone.docx
I N N O V A T I O N N E T W O R K , I N C . www.innone.docx
 
I like to tie my learning to Biblical Principles. On Virtuous Le.docx
I like to tie my learning to Biblical Principles. On Virtuous Le.docxI like to tie my learning to Biblical Principles. On Virtuous Le.docx
I like to tie my learning to Biblical Principles. On Virtuous Le.docx
 
I just want one paragraph.!!C.W.Mills described ‘sociological im.docx
I just want one paragraph.!!C.W.Mills described ‘sociological im.docxI just want one paragraph.!!C.W.Mills described ‘sociological im.docx
I just want one paragraph.!!C.W.Mills described ‘sociological im.docx
 
i just need serious help answering the question. I have answered mos.docx
i just need serious help answering the question. I have answered mos.docxi just need serious help answering the question. I have answered mos.docx
i just need serious help answering the question. I have answered mos.docx
 
I Headnotes and indexes are copyrighted and may not be duplica.docx
I Headnotes and indexes are copyrighted and may not be duplica.docxI Headnotes and indexes are copyrighted and may not be duplica.docx
I Headnotes and indexes are copyrighted and may not be duplica.docx
 

Recently uploaded

Biting mechanism of poisonous snakes.pdf
Biting mechanism of poisonous snakes.pdfBiting mechanism of poisonous snakes.pdf
Biting mechanism of poisonous snakes.pdfadityarao40181
 
DATA STRUCTURE AND ALGORITHM for beginners
DATA STRUCTURE AND ALGORITHM for beginnersDATA STRUCTURE AND ALGORITHM for beginners
DATA STRUCTURE AND ALGORITHM for beginnersSabitha Banu
 
Meghan Sutherland In Media Res Media Component
Meghan Sutherland In Media Res Media ComponentMeghan Sutherland In Media Res Media Component
Meghan Sutherland In Media Res Media ComponentInMediaRes1
 
History Class XII Ch. 3 Kinship, Caste and Class (1).pptx
History Class XII Ch. 3 Kinship, Caste and Class (1).pptxHistory Class XII Ch. 3 Kinship, Caste and Class (1).pptx
History Class XII Ch. 3 Kinship, Caste and Class (1).pptxsocialsciencegdgrohi
 
Software Engineering Methodologies (overview)
Software Engineering Methodologies (overview)Software Engineering Methodologies (overview)
Software Engineering Methodologies (overview)eniolaolutunde
 
internship ppt on smartinternz platform as salesforce developer
internship ppt on smartinternz platform as salesforce developerinternship ppt on smartinternz platform as salesforce developer
internship ppt on smartinternz platform as salesforce developerunnathinaik
 
Proudly South Africa powerpoint Thorisha.pptx
Proudly South Africa powerpoint Thorisha.pptxProudly South Africa powerpoint Thorisha.pptx
Proudly South Africa powerpoint Thorisha.pptxthorishapillay1
 
Pharmacognosy Flower 3. Compositae 2023.pdf
Pharmacognosy Flower 3. Compositae 2023.pdfPharmacognosy Flower 3. Compositae 2023.pdf
Pharmacognosy Flower 3. Compositae 2023.pdfMahmoud M. Sallam
 
Interactive Powerpoint_How to Master effective communication
Interactive Powerpoint_How to Master effective communicationInteractive Powerpoint_How to Master effective communication
Interactive Powerpoint_How to Master effective communicationnomboosow
 
Alper Gobel In Media Res Media Component
Alper Gobel In Media Res Media ComponentAlper Gobel In Media Res Media Component
Alper Gobel In Media Res Media ComponentInMediaRes1
 
How to Configure Email Server in Odoo 17
How to Configure Email Server in Odoo 17How to Configure Email Server in Odoo 17
How to Configure Email Server in Odoo 17Celine George
 
ECONOMIC CONTEXT - PAPER 1 Q3: NEWSPAPERS.pptx
ECONOMIC CONTEXT - PAPER 1 Q3: NEWSPAPERS.pptxECONOMIC CONTEXT - PAPER 1 Q3: NEWSPAPERS.pptx
ECONOMIC CONTEXT - PAPER 1 Q3: NEWSPAPERS.pptxiammrhaywood
 
Final demo Grade 9 for demo Plan dessert.pptx
Final demo Grade 9 for demo Plan dessert.pptxFinal demo Grade 9 for demo Plan dessert.pptx
Final demo Grade 9 for demo Plan dessert.pptxAvyJaneVismanos
 
POINT- BIOCHEMISTRY SEM 2 ENZYMES UNIT 5.pptx
POINT- BIOCHEMISTRY SEM 2 ENZYMES UNIT 5.pptxPOINT- BIOCHEMISTRY SEM 2 ENZYMES UNIT 5.pptx
POINT- BIOCHEMISTRY SEM 2 ENZYMES UNIT 5.pptxSayali Powar
 
Computed Fields and api Depends in the Odoo 17
Computed Fields and api Depends in the Odoo 17Computed Fields and api Depends in the Odoo 17
Computed Fields and api Depends in the Odoo 17Celine George
 
Capitol Tech U Doctoral Presentation - April 2024.pptx
Capitol Tech U Doctoral Presentation - April 2024.pptxCapitol Tech U Doctoral Presentation - April 2024.pptx
Capitol Tech U Doctoral Presentation - April 2024.pptxCapitolTechU
 
Historical philosophical, theoretical, and legal foundations of special and i...
Historical philosophical, theoretical, and legal foundations of special and i...Historical philosophical, theoretical, and legal foundations of special and i...
Historical philosophical, theoretical, and legal foundations of special and i...jaredbarbolino94
 
Crayon Activity Handout For the Crayon A
Crayon Activity Handout For the Crayon ACrayon Activity Handout For the Crayon A
Crayon Activity Handout For the Crayon AUnboundStockton
 
Presiding Officer Training module 2024 lok sabha elections
Presiding Officer Training module 2024 lok sabha electionsPresiding Officer Training module 2024 lok sabha elections
Presiding Officer Training module 2024 lok sabha electionsanshu789521
 
Earth Day Presentation wow hello nice great
Earth Day Presentation wow hello nice greatEarth Day Presentation wow hello nice great
Earth Day Presentation wow hello nice greatYousafMalik24
 

Recently uploaded (20)

Biting mechanism of poisonous snakes.pdf
Biting mechanism of poisonous snakes.pdfBiting mechanism of poisonous snakes.pdf
Biting mechanism of poisonous snakes.pdf
 
DATA STRUCTURE AND ALGORITHM for beginners
DATA STRUCTURE AND ALGORITHM for beginnersDATA STRUCTURE AND ALGORITHM for beginners
DATA STRUCTURE AND ALGORITHM for beginners
 
Meghan Sutherland In Media Res Media Component
Meghan Sutherland In Media Res Media ComponentMeghan Sutherland In Media Res Media Component
Meghan Sutherland In Media Res Media Component
 
History Class XII Ch. 3 Kinship, Caste and Class (1).pptx
History Class XII Ch. 3 Kinship, Caste and Class (1).pptxHistory Class XII Ch. 3 Kinship, Caste and Class (1).pptx
History Class XII Ch. 3 Kinship, Caste and Class (1).pptx
 
Software Engineering Methodologies (overview)
Software Engineering Methodologies (overview)Software Engineering Methodologies (overview)
Software Engineering Methodologies (overview)
 
internship ppt on smartinternz platform as salesforce developer
internship ppt on smartinternz platform as salesforce developerinternship ppt on smartinternz platform as salesforce developer
internship ppt on smartinternz platform as salesforce developer
 
Proudly South Africa powerpoint Thorisha.pptx
Proudly South Africa powerpoint Thorisha.pptxProudly South Africa powerpoint Thorisha.pptx
Proudly South Africa powerpoint Thorisha.pptx
 
Pharmacognosy Flower 3. Compositae 2023.pdf
Pharmacognosy Flower 3. Compositae 2023.pdfPharmacognosy Flower 3. Compositae 2023.pdf
Pharmacognosy Flower 3. Compositae 2023.pdf
 
Interactive Powerpoint_How to Master effective communication
Interactive Powerpoint_How to Master effective communicationInteractive Powerpoint_How to Master effective communication
Interactive Powerpoint_How to Master effective communication
 
Alper Gobel In Media Res Media Component
Alper Gobel In Media Res Media ComponentAlper Gobel In Media Res Media Component
Alper Gobel In Media Res Media Component
 
How to Configure Email Server in Odoo 17
How to Configure Email Server in Odoo 17How to Configure Email Server in Odoo 17
How to Configure Email Server in Odoo 17
 
ECONOMIC CONTEXT - PAPER 1 Q3: NEWSPAPERS.pptx
ECONOMIC CONTEXT - PAPER 1 Q3: NEWSPAPERS.pptxECONOMIC CONTEXT - PAPER 1 Q3: NEWSPAPERS.pptx
ECONOMIC CONTEXT - PAPER 1 Q3: NEWSPAPERS.pptx
 
Final demo Grade 9 for demo Plan dessert.pptx
Final demo Grade 9 for demo Plan dessert.pptxFinal demo Grade 9 for demo Plan dessert.pptx
Final demo Grade 9 for demo Plan dessert.pptx
 
POINT- BIOCHEMISTRY SEM 2 ENZYMES UNIT 5.pptx
POINT- BIOCHEMISTRY SEM 2 ENZYMES UNIT 5.pptxPOINT- BIOCHEMISTRY SEM 2 ENZYMES UNIT 5.pptx
POINT- BIOCHEMISTRY SEM 2 ENZYMES UNIT 5.pptx
 
Computed Fields and api Depends in the Odoo 17
Computed Fields and api Depends in the Odoo 17Computed Fields and api Depends in the Odoo 17
Computed Fields and api Depends in the Odoo 17
 
Capitol Tech U Doctoral Presentation - April 2024.pptx
Capitol Tech U Doctoral Presentation - April 2024.pptxCapitol Tech U Doctoral Presentation - April 2024.pptx
Capitol Tech U Doctoral Presentation - April 2024.pptx
 
Historical philosophical, theoretical, and legal foundations of special and i...
Historical philosophical, theoretical, and legal foundations of special and i...Historical philosophical, theoretical, and legal foundations of special and i...
Historical philosophical, theoretical, and legal foundations of special and i...
 
Crayon Activity Handout For the Crayon A
Crayon Activity Handout For the Crayon ACrayon Activity Handout For the Crayon A
Crayon Activity Handout For the Crayon A
 
Presiding Officer Training module 2024 lok sabha elections
Presiding Officer Training module 2024 lok sabha electionsPresiding Officer Training module 2024 lok sabha elections
Presiding Officer Training module 2024 lok sabha elections
 
Earth Day Presentation wow hello nice great
Earth Day Presentation wow hello nice greatEarth Day Presentation wow hello nice great
Earth Day Presentation wow hello nice great
 

228 Chapter 8 • Measurementto collect more validation data mor.docx

  • 1. 228 Chapter 8 • Measurement to collect more validation data more quickly. For example, insurance companies can share data to obtain large amounts of validation data on specific positions. Another alternative is that it can be advantageous to use professionally developed assessment tools and procedures for which documentation on validity already exists. However, you must ensure that the validity evidence obtained from an "outside" study can be suitably "transported" to your particular situation. In fact, the Uniform Guidelines require as much. To determine if a particular measure is valid for your intended use, consult the manual and available independent reviews such as those in Buros Institute's Mental Measurements Yearbook29 and Test Critiques.*0 When evaluating validity information purchased from a vendor, you should consider the following: · Available validation evidence supporting the use of the measure for specific purposes. The manual should include a thorough description of the procedures used in the validation studies and the results of those studies. Also consider the definition of job success used in the validation study. · The possible valid uses of the measure. The purposes for which the measure can legitimately be used should be described, as well as the performance criteria that can validly be predicted. · The similarity of the sample group(s) on which the measure was developed with the group(s) with which you would like to use the measure. For example, was the measure developed on a sample of high school graduates, managers, or clerical workers? What was the racial, ethnic, age, and gender mix of the sample? · Job similarity. A job analysis should be performed to verify that your job and the original job are substantially similar in terms of ability requirements and work behavior. · Adverse impact evidence. Consider the adverse impact reports from outside studies for each protected group that is part of
  • 2. your labor market. If this information is not available for an otherwise qualified measure, conduct your own study of adverse impact, if feasible. In addition, if an organization would like to use a vendor's assessment or other tool globally, it is important to thoroughly evaluate this capability. Many vendors that claim to be global are actually not capable of delivering a product globally.31 This chapter's Develop Your Skills feature provides some advice on measuring the characteristics of job applicants. DEVELOP YOUR SKILLS Chapter 8 • Measurement 225 226 Chapter 8 • Measurement Assessment Tips3 To effectively assess job candidates, employers must be aware of the inherent limitations of any assessment procedure as well as how to properly use their chosen assessment methods. Here are 10 tips on conducting an effective assessment program: 1. The measures should be used in a purposeful manner— have a clear understanding of what you want to measure and why you want to measure it. 2. Use a variety of tools—because no single measurement tool is 100 percent reliable or valid, use a variety of tools to measure job-relevant characteristics. 3. Use measures that are unbiased and fair to all groups— this will allow you to identify a qualified and diverse set of finalists. 4. Use measures that are reliable and valid. 5. Use measures that are appropriate for the target population— a measure developed for use with one group might not be valid for other groups. 6. Ensure that your administration staff is properly trained— the training should include how to administer the measure as well as how to handle special situations with sensitivity—for example, how and when to provide reasonable accommodations for people with disabilities.
  • 3. 7. Ensure suitable and uniform assessment conditions—noise, poor lighting, inaccurate timing, and damaged equipment can adversely affect respondents. 8. Keep your assessment instruments secure—developers and administrators should restrict access to the instrument's questions, and the measures should be periodically revised. 9. Maintain the confidentiality of the results—the results should be shared only with those who have a legitimate need to know. Personal information should not be released to other organizations or individuals without the informed consent of the respondent. 10. Interpret the scores properly—the inferences made from the results should be reasonable, well founded, and not based on superficial interpretation; careful attention should be paid to contamination and deficiency errors; the manual for the tools should also provide instructions on how to properly interpret the results. Selection Errors
  • 4. selection errors not hiring someone who would have been successful at the job or hiring someone who is not successful at the job whole-person approach the practice of using a variety of measures and procedures to more fully assess people standardization the consistent administration and use of a measure objectivity the amount of judgment or bias involved in scoring an assessment measure Professionally developed measures and procedures that are used as part of a planned assessment program can help you select and hire more qualified and productive employees even if the measures are not perfect. It is essential to understand that all assessment tools are subject to errors. both in measuring a characteristic, such as verbal ability, and in predicting job success criteria, such as job performance. This is true for all measures and procedures.
  • 5. · Do not expect any measure or procedure to measure a personal trait or ability with perfect accuracy for every single person. · Do not expect any measure or procedure to be completely accurate in terms of predicting a candidate's job success. Certainly, selecting employees who are highly able is important. However, there are many factors that affect a person's performance. You also need a motivated employee who clearly understands the job to be performed, for example. The employee also needs the time and resources necessary to succeed in the job. Several of these factors can be predicted using good measurement tools. This is why selection procedures typically involve three to five distinct selection measures (at a minimum) that are combined in some fashion to make a final hiring decision. Despite these efforts, there always will be cases in which a score or procedure will predict someone to be a good worker, who, in fact, is not. There will also be cases in which an individual receiving a low score will be rejected when he or she would actually be a capable and good worker. In the staffing profession, these errors are called selection errors. False positives and false negatives are two types of selection errors. False positives occur when you erroneously classify a weak applicant as being a good hire. False negatives occur when you erroneously classify a strong applicant as being a weak hire. As you try to reduce one type of error you may increase the other so there are trade-offs in how you make your hiring decision. These issues will be covered more in the following chapters. Selection errors cannot be completely avoided, but they can be reduced, for example, by using a variety of measures. Using a variety of measures and procedures to more fully assess people is referred to as the whole-person approach to assessment. This approach will help reduce the number of selection errors and boost the effectiveness of your overall decision making.33 Standardization and Objectivity Standardization is the consistent administration and use of a measure. Standardization reflects the consistency and
  • 6. uniformity of the conditions as well as the procedures for administering an assessment method. Computerization helps to ensure that all respondents receive the same instructions and the same amount of time to complete the assessment. Because maintaining standardized conditions is the responsibility of the people administering the assessment, training all administrators in proper procedures and control of conditions is critical. This is true for interviewing as well as any other assessment approach. In addition to being legally important, standardization is also valuable because recruiters should consistently evaluate candidates on their competencies, styles, and traits. Norms reflect the distribution of scores of a large number of people whose scores on an assessment method are to be compared. The standardization sample is the group of respondents whose scores are used to establish norms. These norms become the comparison scores for determining the relative performance of future respondents. Objectivity refers to the amount of judgment or bias involved in scoring an assessment measure. The scoring process for objective measures is free of personal judgment or bias. The number of words typed in a minute is an objective measure, as is the amount of weight a firefighter candidate can lift. Subjective measures, on the other hand, contain items (such as essay or interview questions) for which the score can be influenced by the attitudes, biases, and personal characteristics of the person doing the scoring. Whenever hiring decisions are subjective, it is also a good idea to involve multiple people in the hiring process, preferably of diverse gender and race, to generate a more defensible decision.34 Because they produce the most accurate measurements, it is best to use standardized, objective measures whenever possible. CREATING AND VALIDATING AN ASSESSMENT SYSTEM Creating an effective assessment and selection system for any position in any organization begins with a job analysis. As you learned in Chapter 4, after understanding the requirements of
  • 7. job success, you identify the important knowledge, skills, abilities, and other characteristics (KSAOs) and competencies required of a successful employee. You then identify reliable and valid methods of measuring these KSAOs and competencies, and create a system for measuring and collecting the resulting data. The integrity and usefulness of the data generated by each measure needs to be considered when deciding which measures to use. The data collected from each measure is then examined to ensure that it has an appropriate mean and standard deviation. Remember, a measure on which everyone scores the same or nearly the same is not as useful as a measure that produces a wide range of scores. Candidates' scores on each assessment method are then correlated or entered into a regression equation to evaluate any redundancies among the measures and to assess how well the group of measures predicts job success. Adverse impact and the cost of the measures are also considered in evaluating each measure. After the final set of measures is identified, selection rules are developed to determine which scores are passing. The usefulness and effectiveness of the system is then periodically reevaluated to ensure that it is still predicting job success without adverse impact. Benchmarking It is sometimes useful to compare an organization's staffing data with those of other organizations to understand better whether the organization is doing well or poorly on a particular dimension. For example, is a voluntary turnover rate of 30 percent good or bad? In some positions, such as the positions held by retail employees, this would be a good turnover level compared to the industry average. In other positions, a 30 percent turnover rate would be unusually high. Benchmarking other firms can give a company comparative information about dimensions including the following: · Application rates · Average starting salaries · Average time to fill
  • 8. · Average cost per hire There are numerous sources of relatively high-quality benchmark information, but it can be expensive. Some sources of benchmarking data include · Corporate Leadership Council · Watson Wyatt and other staffing consulting firms · Hackett Group · The Saratoga Institute (now part of PricewaterhouseCoopers) · Staffing.org · Many industry associations, such as the Society for Human Resource Management, track benchmark information and make it available to their members. Evaluating Assessment Methods The determinants of the effectiveness of any internally or externally developed assessment method include 1. Validity-—whether the assessment method predicts the relevant components of job success 2. Return on investment—whether the assessment method generates a financial return that exceeds the cost associated with using it 3. Applicant reactions—including the perceived job relatedness and fairness of the assessment method 4. Usability—the willingness and ability of people in the organization to use the method consistently and correctly 5. Adverse impact—whether the method can be used without discriminating against members of a protected class 6. The selection ratio—whether the method has a low selection ratio The importance of a firm's selection ratio and base rate to the effectiveness of an assessment method deserve further elaboration. Taylor and Russell35 were among the first to demonstrate that validity alone will not determine the usefulness of an assessment. The tables they generated, taking into account selection ratio and base rate, demonstrated that oSSGSSIIlfifltS Willi 227
  • 9. high validity may not prove useful if a high number of those assessed are hired and that assess- ments with relatively low validity can still have a substantial impact on the improvement of job success rates if only a few of those assessed are hired. This work laid the foundation for utih: analysis, which is discussed in a later chapter. selection ratio A selection ratio is the number of people hired divided by the number of applicants. the number of people hired divided by Lower selection ratios mean that a lower percentage of applicants are hired, and higher selection the number of applicants ratios mean that a greater percentage of applicants are hired. Lower selection ratios mean that the company is being more selective, and can reflect either hiring a low number of people or receiv- ing a large number of applications. For example, a selection ratio of 75 percent means that the company is hiring 75 of every 100 applicants, which doesn't give the assessment method as good of a chance to weed out the applicants who are less likely to do the job well. Imagine if your se- lection ratio is 1.00 (100%), in which case you are hiring everyone who applies—no assessment tool can be useful in that circumstance. base rate The base rate is the percent of employees who are defined as currently successful per- the percent of employees who are formers. Clearly, organizations desire a base rate of 100 percent as this reflects a situation in defined as currently successfulwhich all employees are performing satisfactorily. The firm's system of HR practices, including performers staffing, training, compensation, and performance management, work together to affect a firm's
  • 10. base rate. If your base rate is 100 percent, then everyone who gets hired is already successful, and using an additional assessment tool will not improve your success rate. The potential to improve the effectiveness of a new assessment system in terms of improving the base rate of a firm depends on the percent of its currently successful employees (the current base rate), the selection ratio, and the new assessment method's validity.36 If the current base rate is high, and most employees are successful in their jobs, the potential impact of the new assessment method will be lower than if the base rate is lower and more of the firm's employees are performing poorly. A high-performing system (as evidenced by a high base rate) simply has less room for improvement than a lower-performing system. Lowering the selection ratio can also improve the impact of the selection system. A selection ratio of 80 percent means that the company is only screening out 20 percent of its applicants and is possibly hiring many candidates who its assessment system has identified as lower potential performers. Of course, if the sourcing and recruiting processes resulted in a high-quality candidate pool that contains many potential high performers, a lower selection ratio might not improve the firm's selection process as much. The validity of a new assessment method can also affect the impact of the selection system. As we have discussed, assessment methods with higher validities are better able to improve the selection process than those with low validities. If the current base rate is high, the current selection ratio is high, and the validity of the new assessment method is moderate or low, it may not be worthwhile to use it. Hiring The Best Call Center Workers at Xerox Xerox wanted to use a data-driven approach to improve hiring quality and reduce turnover in its call centers. To do this, Xerox validated its current hiring system and discovered that its
  • 11. current system of preferring applicants who had done the job before was ineffective—call center experience didn't matter to performance or retention. After collecting data on broader characteristics related to performance and retention, Xerox learned that personality mattered a lot in predicting who would perform well and stay at least six months, long enough for the company to recoup its $5,000 investment in training its new hires. It learned that although inquisitive or empathetic people tended to quit, creative personalities tended to stay longer and performed better. Xerox also learned that living near the job and having reliable transportation were important to retention.37 A half-year trial of a new assessment system focusing on personality found that new hire attrition was reduced by 20 percent and performance improved. Xerox now uses software to screen applicants for its 48,700 call center jobs. Applicants take a 30-minute computerized test that asks them to respond to scenarios they might encounter on the job and to choose between statements including, "I ask more questions than most people do" and "People tend to trust what I say." Applicants' personality traits, including creativity, are evaluated automatically and the program spits out a score: red for low potential, yellow for medium potential, or green for high potential. Xerox occasionally hires some yellows if it thinks it can train them, but primarily hires greens.38 Chapter 8 • Measurement 207 5 Chapter 8 • Measurement 208 companies in the United States, states they were able to work with PeopleAnswers to reduce turnover by 50 percent using screening and assessment technologies developed using data analytics. The cornerstone of using data effectively is collecting high-quality information on the right predictors and outcomes.9 WHAT IS MEASUREMENT? Chapter 8 • Measurement 207
  • 12. 206 Chapter 8 • Measurement MEASUREMENT the process of assigning numbers according to some rule or convention to aspects of people, jobs, job success, or aspects of the staffing system DATA the numerical outcomes of measurement PREDICTIVE DATA information about measures used to make projections about outcomes CRITERION DATA information about important outcomes of the staffing process Evaluating people, processes, or outcomes requires collecting data, which requires measurement. In staffing, measurement is the process of assigning numbers according to some rule or convention to aspects of people, jobs, job success, or aspects of the staffing system.10 These measures can be used to select individual employees or to assess the staffing process in general. Interview ratings, knowledge test scores, and performance data are measures used to select employees. Measures relevant to the staffing process in general assess the
  • 13. following: (a) characteristics of the job (which enables the firm to create job requirements and job rewards matrices), (b) aspects of the staffing system (such as the number of days a job posting is run. where it is run, and the nature of the recruiting message), (c) characteristics of job candidates (such as personality or ability), and (d) staffing outcomes (such as performance or turnover). These types of measures enable the firm to improve its staffing system by identifying important patterns and relationships that can be used to make decisions or to design assessments and interventions. The numerical outcomes of measurement are data. Strategic staffing centers around collecting and analyzing the relationship between two types of data:11 1. Predictive data is information used to make projections about outcomes. For example, what data might you collect to predict turnover or job performance? Similarly, could you measure the conscientiousness of job candidates to see if it predicts some component of job success? This is predictive data. In terms of the general staffing system, predictive data can come from any part of the hiring process and can include information on sourcing quality, the basic qualifications of applicants, and their traits, competencies, and values. 2. Criterion data is information about important outcomes of the staffing process. Traditionally, this data includes measuring the job success of employees. More generally, criterion data should also include all outcome information relevant to the evaluation of the effectiveness of the staffing system against its goals. This can include measuring a company's return on investment related to its staffing measures, employee job success, time-to-hire, time-to-productivity, promotion rates, turnover rates, and new hire fit with company values. In short, criterion data is information about outcomes of the staffing or selection process. Predictive data gives you information about the possible predictors of those outcomes. Once you have collected data, you have to do something with it. Next, we discuss basic tools and techniques for describing and
  • 14. interpreting data, followed by a discussion of the characteristics of useful measures. It is critical to note that it is nearly pointless to analyze and interpret data that is of low quality. The data must be accurate, dependable, and relevant to be worth collecting and analyzing. DESCRIBING AND INTERPRETING DATA When a measure, such as an assessment test, is administered to job candidates, the data needs to be interpreted before it can be useful in making hiring decisions. Describing the scores within a distribution is important for interpreting what they mean for the entire group of candidates, as well as understanding the significance of any one particular score. Types of Measurement The tools you can use to describe and interpret the data depend on the level of measurement. The data can come from nominal, ordinal, interval, or ratio measures. NOMINAL In nominal measurement, numbers are assigned to discrete labels or categories. No ordering is implied in the assigned values. Gender, race, and college major are examples of nominal measures. You could assign a "0" to males and a "1" to females to create a nominal measure for gender. ORDINAL In ordinal measurement, attributes are ranked by assigning numbers in ascending or descending order. For example, the first person finishing a work sample task might receive a "1," the second person "2," and so on. Ordinal measures don't tell you anything about the distance between the scores, though—just their rank. INTERVAL In interval measurement, the distance between scores has meaning. The distance from 40 to 50 degrees in Fahrenheit is the same as the distance from 80 to 90 degrees. Thus, the interval is constant. However, the zero point on interval measures is arbitrary, so ratios computed using two
  • 15. different measures of the same attribute will not yield the same result. For example, 100 degrees Fahrenheit is twice that of 50 degrees Fahrenheit but when converted to Celsius the 2:1 ratio doesn't hold. Examples of interval measurement in selection may include intelligence scores, personality assessment scores, and scoring keys for interview questions. RATIO Ratio measurement includes a true and meaningful zero point. Thus, you can construct ratios from the measure. Salary, weight, height, typing speed, and sales per month are examples of ratio-level measures. If one person can lift 200 pounds and another 100 pounds, then the first person can lift twice as much as the second person whether the weight is in grams or pounds. Thus, the ratio holds because there is a true zero point. In a selection context, years of experience is a ratio measure because ratios will hold whether time is measured in years, minutes, or seconds. The distinctions among the different types of measures are important because they influence how you can describe and interpret data. For example, it is generally not useful to compute an average of ordinal scores. Scores The process of assigning numerical values during measurement is scoring. In order to interpret scores properly, we need to understand the scoring system used. Data is often presented in terms of numerical scores, such as raw scores, standard scores, and percentile scores, which we discuss next. RAW SCORES Raw scores are the unadjusted scores on a measure. On a job knowledge test, the raw score might represent the number of items answered correctly. For measures such as personality inventories that have no "right" or "wrong" answers, the raw score may represent the number of positive responses for a particular trait. Raw scores do not provide much useful information by themselves. Consider your score on a midterm. If you get 30 out of 50 questions correct, it is hard to know whether this is a good or a poor score. You may believe 30 is a poor score, but if you compare the results to the results of other
  • 16. people who took the same test, you may discover that 30 is the highest score. For criterion-referenced measures, or standards- based assessments, the scores have meaning in and of themselves. For example, candidates might be expected to exceed a certain level on a criterion measure, such as typing at least 90 words per minute, before they can advance to the next stage of the hiring process. On criterion-referenced measures it is easy to see what a particular score indicates about proficiency or competence. In general, scores on norm-referenced measures have meaning only when compared to the scores of others. For example, candidates who reach a certain norm-referenced measure—for example, who score in the top third of their applicant group on a typing test—would advance to the next stage of the hiring process. Converting raw scores into standard scores (or percentiles), as we describe next, provides you with the kind of comparative information you need to use a norm-referenced measure. NOMINAL MEASUREMENT a measurement in which numbers are assigned to discrete labels or categories ORDINAL MEASUREMENT a measurement in which attributes are ranked by assigning numbers in ascending or descending order INTERVAL MEASUREMENT a measurement in which the distance between scores on an attribute has meaning RATIO MEASUREMENT a measurement in which the distance between scores has meaning; it includes a true and meaningful zero point
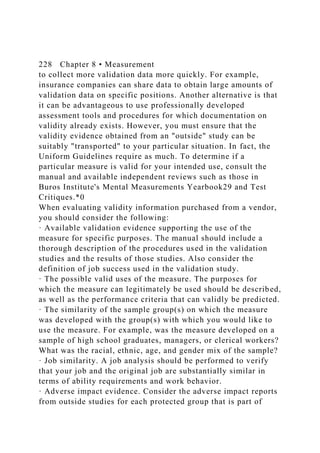
  • 17. RAW SCORES the unadjusted scores on a measure CRITERION-REFERENCED MEASURES measures in which the scores have meaning in and of themselves NORM-REFERENCED MEASURES measures in which the scores have meaning only when compared to the scores of others NORMAL CURVE Many human characteristics, such as height, weight, math ability, and normal curve typing skill, are distributed in the population in a typical pattern known as the normal a curve representing the bell-shaped curve. In other words, the characteristics display a symmetrical bell-shaped appearance like symmetrical distribution of some factor ( Percent of Sample = .13
  • 18. 2.14 13.59 34.13 34.13 13.59 2.14 Percentiles .13 2.28 15.87 50.00 84.13 97.72 99.87 Standardized Score -3 -2 -1 0 +1 +2 +3 TestX 35 40 45 50 55 60 65 TestY 40 60 80 100 120 140 160 =.13 FIGURE 8-1 The Normal Curve Illustrating Standard Scores and Percentiles
  • 19. ) NORMAL DISTRIBUTION the distribution of scores under the normal curve the one shown in Figure 8-1. The distribution of scores under the normal curve is called the normal distribution. As you can see, a large number of individual cases cluster in the middle of the curve. The farther from the middle (or average) you go, the fewer the cases. Many distributions of scores follow the same normal curve pattern. Most individuals get scores in the middle range, near average. As score extremes are approached, fewer and fewer cases exist, indicating that progressively fewer individuals get lower scores (represented by the left tail of the curve) or higher scores (represented by the right tail of the curve). Other distributions are possible but we will focus on the normal distribution because it is one of the most commonly used. PERCENTILE SCORE a raw score that has been converted into an expression of the percentage of people who score at or below that score PERCENTILE SCORE A percentile score is a raw score that has been converted into an expression of the percentage of people who score at or below that score. For example, in Figure 8-1, a
  • 20. score of 55 on Test X or 120 on Test Y would place a person at about the 84th percentile. This means that 84 percent of the people taking the test scored at or below this individual's score. The second horizontal line below the curve in Figure 8-1 labeled "Percentiles" represents the distribution of scores in percentile units. By knowing the percentile score of an individual, you already know how that individual compares with others in the group. An individual at the 98th percentile scored the same as or better than 98 percent of the individuals in the group. This is approximately equivalent to getting a raw score of 60 on Test X or 140 on Test Y. Percentiles can yield useful information. Assume you want to make highly competitive job offers. You can use data sources such as the Bureau of Labor and Statistics (BLS), which typically report the 10th, 25th, 50th, 75th, and 90th percentiles in the distribution of salaries for a given occupation. If you wish to pay salaries at the top 10 percent of the distribution, then you can use the BLS's percentiles to figure out how much you should pay. You can also collect salary information from within your firm to determine what might be a competitive job offer. Assume you collected data from all your employees on their current salary levels. How might you describe the data? We discuss this next. CENTRAL TENDENCY the midpoint, or center, of the data MEAN a measure of central tendency reflecting the average score MEDIAN the middle score, or the point below which 50 percent of the scores fall MODE the most commonly observed score CENTRAL TENDENCY Central tendency describes the
  • 21. midpoint, or center, of the data. Typical measures of central tendency include the mean, median, and mode. The mean is a measure of central tendency reflecting the average score. For example, you could compute the average salary and then pay at or above this level to be competitive. The median is the middle score, or the 50th percentile, which is the point below which 50 percent of the scores fall below. The mode is the most commonly observed score. If scores are normally distributed, as they are in Figure 8-1, then the mean, median, and mode are in the same position. This is not always the case if scores are not normally distributed. In the case of data on annual pay, a distribution could have most employees at the left (lower end) of the range and relatively few employees at the high end. This is not a normal distribution. This is regularly observed in organizations, and it is called positive skew. In this case, the mode would be to the left, near the bulk of the distribution, because it is the most commonly observed score. The mean would be shifted to the right due to the high annual pay for a limited number of employees. The median would be somewhere in between. In this case, the firm might extend different job offers depending on which measure it used to describe the data. In labor disputes, it is not uncommon for managers to use average pay as a reference point (indicating higher pay across employees) whereas unions use the mode or median as a reference point (indicating lower pay across employees). Alternatively, you might see a bimodal distribution, or a distribution with two modes, for annual pay. The mean and median would fall between the two modes but neither would be representative of true compensation levels because there are probably two separate employee groups represented in the data. Perhaps the two modes represent some employees who are paid on a salary basis and other employees who are paid on an hourly basis. In this case, you might use one of the two modes to
  • 22. determine your competitive offer for compensation, or you could compute the mean, median, and mode separately for the two groups. VARIABILITY Variability describes the "spread" of the data around the midpoint. If you were told that an applicant scored 76 out of 100 points on a work sample test, what would you think? It's hard to know what to conclude without more information. What if you were told the mean was 70? This additional information helps because you can tell that the applicant did better than average, but you are still missing important information. How much better or worse did the applicant actually fare? To answer this, you need to know the variability of scores. What would you think if the lowest score was 64 and the highest was 76? What if you were told the lowest score was 40 and the highest 100? Knowing the variability of a distribution changes your interpretation of scores. There are a number of alternative measures of variability but typical measures include the range, variance, and standard deviation. The range is the difference between the highest and lowest observed scores. The range is highly influenced by any single extreme score (an outlier) so it may not effectively represent the true variability in the data. Other measures of variability such as the variance and standard deviation are less affected by outliers. The variance is a mathematical measure of the spread based on squared deviations of scores from the mean. You can find the formula for variance in the supplement at the end of this chapter. The standard deviation is conceptually similar to the average distance from the mean of a set of scores. It is the positive square root of the variance. A data set with a larger standard deviation has scores with more variance and a larger range. For example, if the average score on a measure was 70, and the standard deviation was 3, the scores would be more tightly clustered around the mean than if the standard deviation was 15. If all the scores were the same, the standard
  • 23. deviation would be 0. If everyone scores the same on a measure, the measure isn't useful in predicting job performance or deciding who to hire. You can see in Figure 8-1 that the range and standard deviation are smaller for Test X than they are for Test Y. STANDARD SCORES Standard scores are converted raw scores that indicate where a person's score lies in comparison to a referent group. A common standard score is a z score, which measures the distance of a score from the mean in standard deviation units. There are three determinants of a z score: the raw score and the mean and standard deviation of the entire set of scores. Look at Figure 8-1. Test X and Test Y have different raw score means. Notice that Test X has a mean of 50 and Test Y has a mean of 100. If an individual got a score of 65 on Test X, that person did very well. However, a score of 65 on Test Y would be a poor score. Raw scores often carry limited information by themselves. Figure 8-1 shows the percent of cases 1, 2, and 3 standard deviations above the mean and 1, 2, and 3 standard deviations below the mean. As you can see, 34 percent of the cases lie between the mean and +1 standard deviation, and 34 percent of the cases lie between the mean and —1 standard deviation. Thus, approximately 68 percent of the cases lie between —1 and +1 standard deviations. Note that for Test X, the standard deviation is 5, and 68 percent of the test takers scored between 45 and 55. For Test Y, the standard deviation is 20, and 68 percent of the test takers scored between 80 and 120. A z score is calculated by subtracting the referent group's mean from the target individual's raw score, and dividing the difference by the measure's standard deviation in the referent group. The resulting standard z score indicates how many standard deviations the individual's VARIABILITY a measure that describes the "spread" of the data around the
  • 24. midpoint RANGE the difference between the highest and lowest observed score OUTLIER a score that is much higher or lower than most of the scores in a distribution VARIANCE a mathematical measure of the spread based on squared deviations of scores from the mean STANDARD DEVIATION the positive square root of the variance; it is conceptually similar to the average distance from the mean of a set of scores STANDARD SCORES converted raw scores that indicate where a person's score lies in comparison to a referent group ZSCORE a standard score that indicates the distance of a score from the mean in standard deviation units score is above or below the mean of the referent group. It can be seen in Figure 8-1 that approximately 84 percent of scores fall below a z score of +1, whereas nearly 100 percent of people fall below a z score of +3. The simple formula for a z score is Zscore = (Individual's raw score - Referent group mean)/Referent group standard deviation A z score is negative when the target individual's raw score is below the referent group's mean, and positive when the target individual's raw score is above the referent group's mean. To compare candidates, we often need a single overall score
  • 25. that represents each candidate's combined performance on all of the assessment methods used to evaluate them. Combining a candidate's raw scores on two or more measures that use different scoring systems is difficult. Imagine an assessment system that evaluates candidates using an interview scored on a l-to-10 scale and a job knowledge test that is scored on a 0-to- 100 scale. Simply averaging the two scores would give disproportionate weight to one of the tests, depending on the mean and standard deviation. Standardizing both scores by converting them to z scores allows them to be easily combined, as shown in Table 8-1. In Table 8-1, the interview scores have a range of 15 to 22, a mean of 18.25, and a standard deviation of 3. The job knowledge test has a range of 69 to 87, a mean of 78.25, and a standard deviation of 7.46. If you subtract the mean from each raw score and divide by the standard deviation, you will obtain the standard score. For Felix, the calculations would be (15 - 18.25)/3 = -1.1 and (87 - 78.25)/7.46 = 1.2 (after rounding). Although meaningfully combining the raw scores would be difficult, combining the z scores is easy and results in a single number reflecting how each candidate did on both of the assessment methods relative to the other candidates. In this case, Sue's outstanding interview score allowed her to overcome her slightly below-average job knowledge test score to be the candidate with the highest overall score. If a company wants to weight multiple assessment methods differently, each standard score can be multiplied by the desired weighting percentage. For example, the formula for weighting the interview score 60 percent and the job knowledge test score 40 percent would be Overall score = (0.6 X ziwerview) + (0.4 X Zj0bknowiedgeteSt) For Felix, this would be (0.6 X -1.1) + (0.4 X 1.2) = -0.18 rather than the 0.1 he received when the interview and knowledge test were equally weighted. Shifting the Normal Curve (
  • 26. Raw Standard Raw Standard Standard Units Felix 15 -1.1 87 1.2 (-1.1 + 1.2) = 0.1 Sue 22 1.3 77 -0.2 (1.3 - 0.2) = 1.1 Lin 19 0.3 69 -1.2 (0.3 - 1.2) = -0.9 Pierre 17 -0.4 80 0.2 (-0.4 + 0.2) = -0.2 ByiBKHP Converting Raw Scores to Standard Scores Job Knowledge Candidate Interview Score Test Score Overall Score
  • 27. )When making candidate selection decisions, it is often assumed that the distribution of applicants' fit with the job reflects the normal curve as depicted by the current talent pool shown in Figure 8-2. If this is true, then a large burden is placed on the selection system to accurately identify which candidates fall to the far right of the curve (the best hires). In practice, however, many of the most desirable people for a position are not in the applicant pool at all. The most talented and competent people are often successfully employed because they are usually being promoted and rewarded for the work they do. As a result, most of these people are semi-passive job seekers at best. Without an effective sourcing and recruiting process, they will not apply to your firm. For example, during the 2008 economic downturn, it was difficult to get passive job seekers with deep experience and a proven track record in advertising to apply for positions at other companies.12