2. Module 2.1
Ozone depletion
Links between ozone and climate
2.1 Training presentation ozone – UN Environment OzonAction Introductory Training for NOUs
5. Ozone: what is it and where?
Stratospheric ozone = good ozone:
• ca 90% of ozone naturally occurs
10*- 50 km above Earth
* For comparison, Mt Everest is almost 9 km high
• Most abundant in lower part of
stratosphere the ozone layer
• Thickness of ozone layer tends to
vary by region, season and other
natural processes
Ground-level ozone = bad ozone:
• About 10% of ozone lies near ground
level as part of petrochemical smog
and acid rain
• Harmful air pollutant
• Not part of the ozone layer
Ozone is good up high, bad nearby
6. Ozone layer’s role in blocking UV
• ODS gases used by humans are carried up by air movements
• ODS destroy many ozone molecules in the stratosphere
• This makes the ozone layer thinner (depleted)
• Thinner ozone means a larger amount of UV reaches Earth,
particularly UV-B
Normal ozone layer:
The ozone layer absorbs
(blocks) most of the sun’s
harmful UV rays
Plays an important role in
stabilizing the planet
Depleted ozone layer:
Ozone-damaging chemicals
(called ozone-depleting
substances) increase UV levels
in the following way:
9. Effects of UV on human health
The natural background level of UV varies greatly, depending on
factors such as latitude (highest UV is in tropics), season (highest in
summer), time of day (highest around midday) – as well as the amount
of ozone
Benefits of UV: Our skin produces vitamin D when exposed to small
amounts of UV (sunlight) for a short period, several times a week.
Vitamin D is essential for healthy bones.
Negative effects of UV:
• The high energy of UV can break molecular bonds in DNA (building
blocks of life) and other bio-molecules
• Even the natural background levels of UV can cause ill-health in
humans and animals if exposed to too much sun:
– Non-melanoma skin cancers – not normally fatal, but treatment
can be costly, painful and disfiguring
– Malignant melanoma skin cancer – far less common, but the
major cause of death from skin cancer
11. Effects of UV on health (cont.)
– Eye cataracts – are the leading cause of blindness worldwide.
Over-exposure to UV is one major cause
– Immune suppression – UV can make people and animals more
susceptible to infectious diseases, and may reduce the
effectiveness of vaccinations in some cases.
• If we had a 10% decrease in the amount of ozone (10% ozone
depletion) it could cause an estimated 300,000 extra non-melanoma
skin cancers, 4,500 extra melanoma cancers, and 1.6 - 1.75 million
extra eye cataracts, worldwide, every year*
(*World Health Organisation (2002) Global Solar UV Index: A Practical Guide, p.18)
12. Other negative effects of UV
Damage to marine food chain and fish stocks:
• UV can damage early developmental stages of fish, shrimp,
marine mammals and other water organisms
• Higher UV reduces production of phytoplankton (primary element
in food chains in oceans) reduce fish stocks
Indirect effects on plants and forests:
• UV can alter plant development, plant diseases, how nutrients are
distributed, and biogeochemical cycles
Damage to outdoor materials:
• UV degrades many materials used outdoors, reducing their useful
lifetimes, e.g. some plastics, rubber, textiles, wood products
• Chemical additives can make materials somewhat resistant to UV,
but increased UV reduces product lifetimes, bringing greater costs
14. ODS controlled by the Montreal Protocol
The Montreal Protocol (MP) controls 96 ozone-depleting substances,
which contain chlorine or bromine
Examples of ODS containing chlorine:
• Chlorofluorocarbons (CFCs), used in the past in refrigerators, air
conditioners, foam and other products
• Hydrofluorocarbons (HCFCs) currently used in similar products, as
temporary substitutes for CFCs
• Others such as carbon tetrachloride, methyl chloroform
Examples of ODS containing bromine:
• Halons, used in the past for extinguishing fires
• Methyl bromide, used in the past for pest control; currently used
for official quarantine treatments for import/export goods
ODS gases can be emitted to the air during production, use, servicing
and/or eventual disposal of these products and equipment
15. Examples of products that have used ODS
CFCs and HCFCs in refrigeration, air-conditioning, foam and other products
Halons in fire-protection
systems
Methyl bromide for
treating pests in soil
Carbon tetrachloride in
chemical processing
16. Environmental Characteristic of ODS
Atmospheric lifetime:
amount of time gas remain in
the atmosphere (few years to
thousands)
Global Warming Potential:
describes a refrigerant’s
ability to warm the
atmosphere relative to CO2
over 100 years
Ozone Depleting Potential:
describes a refrigerant ability
to destroy ozone relative to
that of CFC11
17. Potency indicator: Ozone Depletion Potential
• Some ODS substances are more potent or strong than others -
they have a more damaging effect on ozone
• Scientists estimate an Ozone Depletion Potential (ODP) value for
each ODS, as an indicator of its potency compared with the
benchmark CFC substance (CFC-11, ODP = 1)
• An ODP value depends largely on the stability or lifetime of the
substance in the atmosphere
• So substances with longer lifetimes generally have highest ODPs
(when calculated over 100-year time period)
• Based on scientific estimates, the Montreal Protocol has
allocated an ODP to each controlled ODS substance
20. Many ODS are greenhouse gases
• Many ODS are greenhouse gases, with Global Warming Potentials
(GWP) varying from small to large
Ozone depleting substances Global Warming Potential (GWP)
Chlorofluorocarbons (CFCs) 4,750 - 10,900
Hydrochlorofluorocarbons (HCFCs) 77 - 2,310
Halons 1,750 - 6,670
Carbon tetrachloride 1,380
Methyl chloroform 144
Methyl bromide 5
• For comparison, CO2 GWP is 1, the total quantity of CO2 is very large so
CO2 has a greater impact on climate
• The radiative forcing (an index of the importance as a potential climate
change mechanism) from ODS reached about 0.3 Watts/m2 around the
year 2000, compared with about 1.5 W/m2 from CO2
• Without the Montreal Protocol’s restrictions, radiative forcing from ODS
alone could have reached about 0.60 W/m2 in 2010 (Velders in Science (2012) vol. 335,
p.922-923)
21. Key ODS alternatives are greenhouse gases:
high-GWP HFCs
• ODS have been replaced by hydrofluorocarbons (HFCs) in many
situations, and the use of HFCs is growing rapidly
• HFCs are not ODS, but many are potent greenhouse gases with very
high GWPs compared to carbon dioxide (GWP 1) – examples below
• HFC emissions are covered by the UNFCCC climate agreement
• Responding to the need to reduce greenhouse gases, the Montreal
Protocol recently adopted restrictions on HFC consumption &
production Kigali Amendment
HFCs used as ODS alternatives Global Warming Potential (GWP)
HFC-143a 4,470
HFC-227ea 3,220
HFC-134a 1,430
HFC-32 675
HFC-143 353
HFC-152 53
22. Indirect climate impacts of energy used by
refrigeration equipment
• Refrigeration and air-conditioning equipment consumes a large
percentage of electricity in most developing countries
• But increasingly, its possible to get the same degree of air-
conditioning or refrigeration while using less electricity/energy
Energy-efficiency means using less energy to do the same
amount of work, such as cooling (e.g. an energy-efficient fridge
keeps your food cool as normal, but uses less electricity
compared to an older type of fridge)
• If we become energy-efficient globally, it could potentially yield
about 40% of the carbon emission reductions we need to make by
2050 to stay below 2°C rise in global temperature
energy-efficiency is important when considering ODS alternatives
Further details in Module 12
24. Close-up: trend in global average ozone, 1960 – 2012
• Graph shows change in total global ozone (thickness): Annual average
compared with average of earlier period (1964-1980, black line)
• The strongest ozone decline occurred during 1980s
• Global average depletion peaked around 5% ozone loss in 1990s
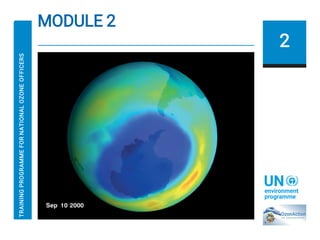
25. • Severe ozone depletion started around 1980 over Antarctic region each
winter/spring, mainly in September - October (spring in southern hemisphere)
• Upper row shows ozone over Antarctica in early 1970s, before ozone hole
appeared - about 300-350 DU (green colour) or more (orange/red) over Antarctic
• Lower row: Blue area indicates ozone hole in 1980s and 1990s, below 220 DU
• The ozone hole = area where ozone is less than 220 Dobson Units (DU)
Why does the ozone hole occur in the Antarctic?
26. Ozone Layer with and without
The vertical thickness is known as total column ozone
or total ozone, measured in Dobson Units (DU)*
Without Montreal Protocol
With Montreal Protocol
27. Potential impediments to ozone recovery
• ODS abundance is falling, but the Montreal Protocol’s work is not
finished…
• The ozone layer remains vulnerable for a long time
– because of the long lifetime of many ODS
– halon-1301 and several CFCs, emitted from older equipment, are still
increasing in the atmosphere. HCFCs are still produced and consumed - as
permitted during the phase-out period
– Unusually cold temperatures can act as a catalyst, triggering the damaging
action of chlorine and bromine compounds already in the atmosphere.
– Other factors: e.g. a major volcanic eruption occurs may result in
substantial ozone depletion (volcanic aerosols act as platforms for ozone-
damaging action of ODS)
• The recovery of the ozone layer depends on full compliance with
the Protocol’s restrictions on ODS, if not it would delay, or even
prevent, the ozone layer’s recovery
• So our international efforts to protect the ozone layer remain
essential!