Whether Draft Animals are Disappearing from Rural India: Macro and Micro Level Analysis
•
0 likes•207 views

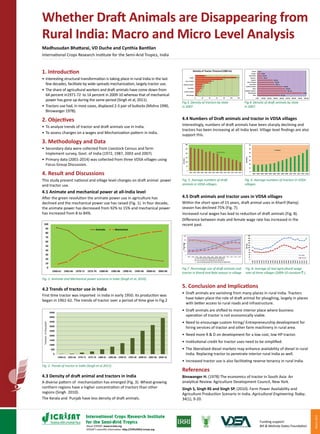
Interesting structural transformation is taking place in rural India in the last few decades, facilitate by wide spreads mechanization, largely tractor use. The share of agricultural workers and draft animals have come down from 64 percent in1971-72 to 14 percent in 2009-10 whereas that of mechanical power has gone up during the same period (Singh et al, 2011). Tractors use had, in most cases, displaced 2-3 pair of bullocks (Mishra 1990, Binswanger 1978).
Recommended

Recommended
More Related Content
What's hot
What's hot (20)
Viewers also liked
Viewers also liked (20)
Similar to Whether Draft Animals are Disappearing from Rural India: Macro and Micro Level Analysis
Similar to Whether Draft Animals are Disappearing from Rural India: Macro and Micro Level Analysis (20)
More from ICRISAT
More from ICRISAT (20)
Recently uploaded
Recently uploaded (20)
Whether Draft Animals are Disappearing from Rural India: Macro and Micro Level Analysis
- 1. March2015 Sciencewithahumanface About ICRISAT: www.icrisat.org ICRISAT’s scientific information: http://EXPLOREit.icrisat.org Funding support: Bill & Melinda Gates Foundation Whether Draft Animals are Disappearing from Rural India: Macro and Micro Level Analysis Madhusudan Bhattarai, VD Duche and Cynthia Bantilan VILLAGE DYNAMICS IN SOUTH ASIA 1. Introduction • Interesting structural transformation is taking place in rural India in the last few decades, facilitate by wide spreads mechanization, largely tractor use. • The share of agricultural workers and draft animals have come down from 64 percent in1971-72 to 14 percent in 2009-10 whereas that of mechanical power has gone up during the same period (Singh et al, 2011). • Tractors use had, in most cases, displaced 2-3 pair of bullocks (Mishra 1990, Binswanger 1978). 2. Objectives • To analyze trends of tractor and draft animals use in India. • To assess changes on a wages and Mechanization pattern in India. 3. Methodology and Data • Secondary data were collected from Livestock Census and farm Implement survey, Govt. of India (1972, 1987, 2003 and 2007). • Primary data (2001-2014) was collected from three VDSA villages using Focus Group Discussion. 4. Result and Discussions This study present national and village level changes on draft animal power and tractor use. 4.1 Animate and mechanical power at all-India level After the green revolution the animate power use in agriculture has declined and the mechanical power use has raised (Fig. 1). In four decade, the animate power has decreased from 92% to 15% and mechanical power has increased from 8 to 84%. Fig. 1. Animate and Mechanical power scenario in India (Singh et al, 2010). Fig. 2. Trends of tractor in India (Singh et al 2011). 4.2 Trends of tractor use in India First time tractor was imported in India in early 1950. Its production was began in 1961-62. The trends of tractor over a period of time give in Fig.2 0 50 100 150 200 250 300 2001 2002 2003 2004 2005 2006 2007 2008 2009 2010 2011 2012 2013 2014 Draft animals Numbers Fig. 6. Average numbers of tractors in VDSA villages. Fig. 5. Average numbers of draft animals in VDSA villages. 4.5 Draft animals and tractor uses in VDSA villages Within the short span of 15 years, draft animal uses in Kharif (Rainy) season has declined 75% (Fig. 7). Increased rural wages has lead to reduction of draft animals (Fig. 8). Difference between male and female wage rate has increased in the recent past. 4.3 Density of draft animal and tractors in India A diverse pattern of mechanization has emerged (Fig. 3). Wheat-growing northern regions have a higher concentration of tractors than other regions (Singh 2010). The Kerala and Punjab have less density of draft animals. 371.28 732.40 481.38 455.80 416.88 286.11 274.60 256.39 90.92 82.79 54.00 6.17 0.00 100.00 200.00 300.00 400.00 500.00 600.00 700.00 800.00 India West Bengal Madhya Pradesh Bihar Andhra Pradesh Karnataka Uttar Pradesh Gujarat Haryana Tamil Nadu Punjab Kerala 0 10 20 30 40 50 60 70 2001 2002 2003 2004 2005 2006 2007 2008 2009 2010 2011 2012 2013 2014 Tractors Numbers 0 20 40 60 80 100 120 West Bengal Andhra Pradesh Karnataka Madhya Pradesh Uttar Pradesh Punjab 4 5 10 12 17 18 19 36 44 74 113 25 Density of Tractor (Tractors/1000 ha) Fig.3. Density of tractors by state in 2007. Fig.4. Density of draft animals by state in 2007. 4.4 Numbers of Draft animals and tractor in VDSA villages Interestingly, numbers of draft animals have been sharply declining and tractors has been increasing at all India level. Village level findings are also support this. Fig. 8. Average of real agricultural wage rate of three villages (2009-10 constant `.). Fig.7. Percentage use of draft animals and tractor in Kharif and Rabi season in village. 5. Conclusion and Implications • Draft animals are vanishing from many places in rural India. Tractors have taken place the role of draft animal for ploughing, largely in places with better access to rural roads and infrastructure. • Draft animals are shifted to more interior place where business operation of tractor is not economically viable. • Need to encourage custom hiring/ Entrepreneurship development for hiring services of tractor and other farm machinery in rural area. • Need more R & D on development for a low cost, low HP tractor. • Institutional credit for tractor uses need to be simplified. • The liberalized diesel markets may enhance availability of diesel in rural India. Replacing tractor to penetrate interior rural India as well. • Increased tractor use is also facilitating reverse tenancy in rural India. References Binswanger H. (1978) The economics of tractor in South Asia: An analytical Review. Agriculture Development Council, New York. Singh S, Singh RS and Singh SP. (2010). Farm Power Availability and Agriculture Production Scenario in India. Agricultural Engineering Today, 34(1), 9-20. International Crops Research Institute for the Semi-Arid Tropics, India 0 10 20 30 40 50 60 70 80 90 100 1960-61 1965-66 1970-71 1975-76 1980-81 1985-86 1990-91 1995-96 2000-01 2005-06 Animate Mechanical 0 500 1000 1500 2000 2500 3000 3500 4000 4500 1960-61 1965-66 1970-71 1975-76 1980-81 1985-86 1990-91 1995-96 2000-01 2005-06 2009-10 Tractorsinthousand 371.28 732.40 481.38 455.80 416.88 286.11 274.60 256.39 90.92 82.79 54.00 6.17 0.00 100.00 200.00 300.00 400.00 500.00 600.00 700.00 800.00 India West Bengal Madhya Pradesh Bihar Andhra Pradesh Karnataka Uttar Pradesh Gujarat Haryana Tamil Nadu Punjab Kerala 0 10 20 30 40 50 60 70 2001 2002 2003 2004 2005 2006 2007 2008 2009 2010 2011 2012 2013 2014 Tractors Numbers 0 20 40 60 80 100 2001 2002 2003 2004 2005 2006 2007 2008 2009 2010 2011 2012 2013 2014 Use of tractor (%) in Kharif season for agriculture Use of tractor (%) in Rabi season for agriculture Use of working animals (%) in Kharif season for agriculture Percentage 0 20 40 60 80 100 120 140 160 180 200 1990 1991 1992 1993 1994 1995 1996 1997 1998 1999 2000 2001 2002 2003 2004 2005 2006 2007 2008 2009 2010 2011 2012 2013 2014 Male Female RS/Day 0 20 40 60 80 100 2001 2002 2003 2004 2005 2006 2007 2008 2009 2010 2011 2012 2013 2014 Use of tractor (%) in Kharif season for agriculture Use of tractor (%) in Rabi season for agriculture Use of working animals (%) in Kharif season for agriculture Percentage 0 20 40 60 80 100 120 140 160 180 200 1990 1991 1992 1993 1994 1995 1996 1997 1998 1999 2000 2001 2002 2003 2004 2005 2006 2007 2008 2009 2010 2011 2012 2013 2014 Male Female RS/Day