Download to read offline
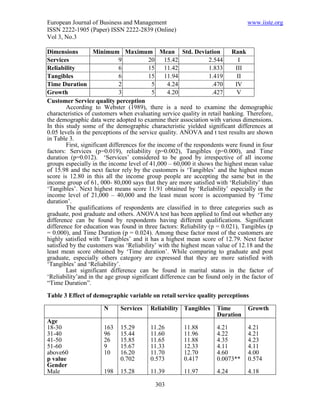
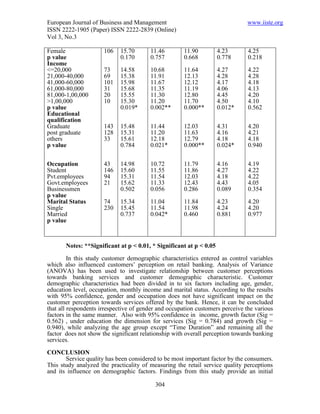


This study analyzes customer perceptions of service quality in the retail banking sector, based on responses from 304 customers in Chennai. By employing factor analysis, five key service quality factors were identified, with significant variations noted based on customers' income and education levels, suggesting the critical importance of these demographics in shaping perceptions. Results indicate that service quality, reliability, and tangibles have a notable impact on customer satisfaction and are essential for banks aiming to enhance market share and profitability.


![6.[45 54]factors influencing online banking customer satisfaction and their i...](https://cdn.slidesharecdn.com/ss_thumbnails/6-45-54factorsinfluencingonlinebankingcustomersatisfactionandtheirimportanceinimprovingoverallretentionlevels-111118182103-phpapp01-thumbnail.jpg?width=640&height=640&fit=bounds)


![4.[40 55]the drivers of customer loyalty to retail banks](https://cdn.slidesharecdn.com/ss_thumbnails/4-40-55thedriversofcustomerloyaltytoretailbanks-111118182042-phpapp02-thumbnail.jpg?width=640&height=640&fit=bounds)


