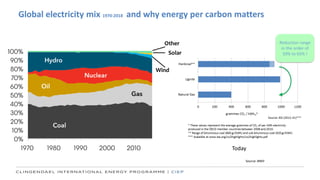
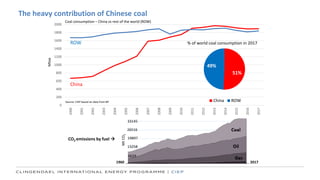
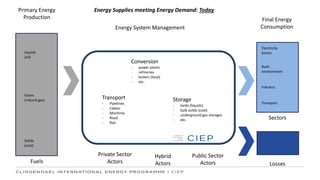
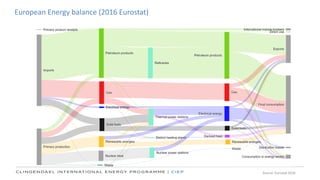
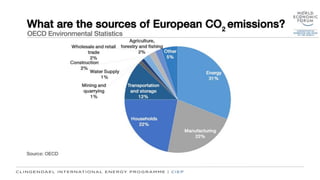
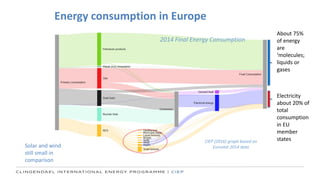
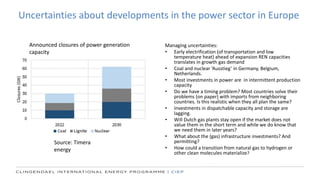
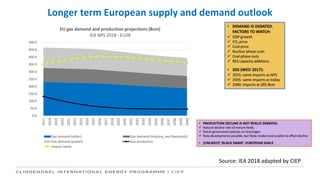
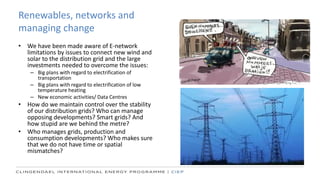
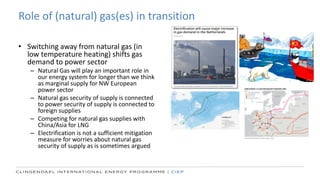
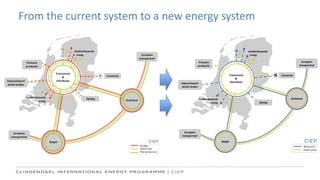
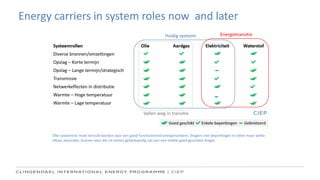
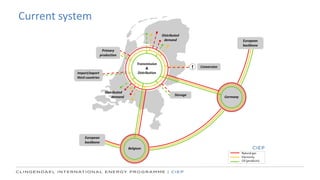
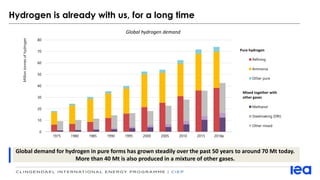
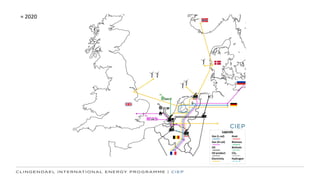
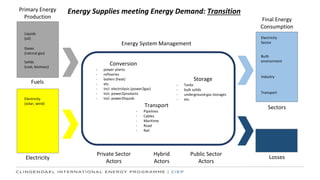
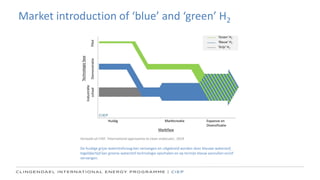
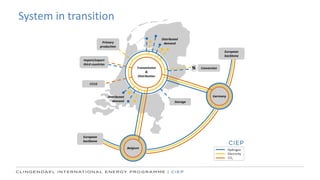
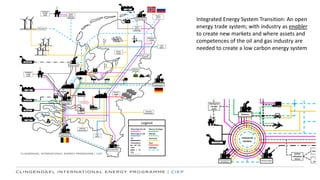
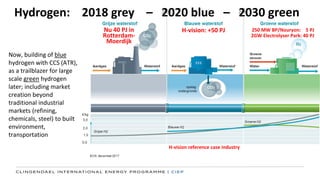
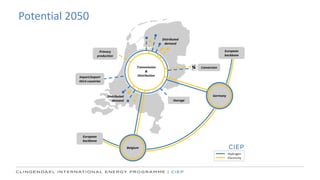
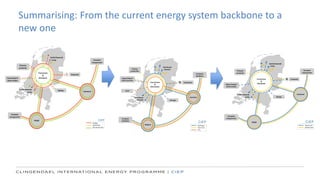
Building a new energy system backbone in NW Europe
and managing transition
29 October 2019, Geldermalsen
Coby van der Linde
33000
34000
35000
36000
37000
2010 2011 2012 2013 2014 2015 2016 2017 2018
2014-2016
2017-2018
Graph by CIEP
Data: Carbon Atlas (2010-2017), IEA (2018)
Global CO2 emissions 2010-2018 – MtCO2
• Efficiency, RES, C2G are helping limit CO2 emission growth
• CO2 intensity of the economy has been consistently decreasing in the last years
• However, this has not been enough to lower total CO2 emissions
Deconstructing CO2 emission growth 2017-2018 – MtCO2
The spectacular rise of China CO2 emissions in 1960-2017 – MtCO2
Embedded CO2 emissions in trade
Top 6 carbon dioxide emitters, 2005 and
2015 CO2 in trade
Solar
Wind
Today
Other
Global electricity mix 1970-2018 and why energy per carbon matters
Source: BNEF
Reduction range
in the order of
50% to 65% !
0
200
400
600
800
1000
1200
1400
1600
1800
2000
2000
2001
2002
2003
2004
2005
2006
2007
2008
2009
2010
2011
2012
2013
2014
2015
2016
2017
Source: CIEP based on data from BP
51%
49%
% of world coal consumption in 2017
China ROW
1960 2017
33145
26516
19897
13258
6629
CO2 emissions by fuel →
The heavy contribution of Chinese coal
Mtoe
MtCO2
Coal consumption – China vs rest of the world (ROW)
China
ROW
Final Energy
Consumption
Conversion
- power plants
- refineries
- boilers (heat)
- etc.
Storage
- tanks (liquids)
- bulk solids (coal)
- underground gas storages
- etc.
Transport
- Pipelines
- Cables
- Maritime
- Road
- Rail
Liquids
(oil)
Gases
(natural gas)
Solids
(coal)
Energy Supplies meeting Energy Demand: TodayPrimary Energy
Production
Sectors
Fuels
Energy System Management
Private Sector
Actors
Public Sector
Actors
Hybrid
Actors
Electricity
Sector
Built-
environment
Industry
Transport
Losses
Source: Eurostat 2016
European Energy balance (2016 Eurostat)
Energy consumption in Europe
CIEP (2016) graph based on
Eurostat 2014 data
2014 Final Energy Consumption
Solar and wind
still small in
comparison
Electricity
about 20% of
total
consumption
in EU
member
states
About 75%
of energy
are
‘molecules;
liquids or
gases
Uncertainties about developments in the power sector in Europe
Managing uncertainties:
• Early electrification (of transportation and low
temperature heat) ahead of expansion REN capacities
translates in growth gas demand
• Coal and nuclear ‘Ausstieg’ in Germany, Belgium,
Netherlands.
• Most investments in power are in intermittent production
capacity
• Do we have a timing problem? Most countries solve their
problems (on paper) with imports from neighboring
countries. Is this realistic when they all plan the same?
• Investments in dispatchable capacity and storage are
lagging.
• Will Dutch gas plants stay open if the market does not
value them in the short term and while we do know that
we need them in later years?
• What about the (gas) infrastructure investments? And
permitting?
• How could a transition from natural gas to hydrogen or
other clean molecules materialize?
Source: Timera
energy
Announced closures of power generation
capacity
Electricity from Solar & wind Germany (1/2)
• Every day, solar (yellow) peaks around noon and goes back to zero in the evening
• Many days, wind energy (blue) is produced, but sometimes for days it is not
• Different seasons show different patters
• Electricity generation in Germany in the month of June and July 2019
Bron: Agora Energiewende (2019)
Electricity from Solar & wind Germany (2/2)
Source: Agora Energiewende (2017)
• Every day, solar (yellow) peaks around noon and goes back to zero in the evening
• Many days, wind energy (blue) is produced, but sometimes for days it is not
• Different seasons show different patterns, and as a result also different emission profiles (dark purple line)
• Electricity generation in Germany in the months of January and February 2019
Seasonality of Heat Demand (NL example)
GW
Source: CIEP (2016) based on GTS & ENTSO-E data
Jan Feb Mar Apr May Jun Jul Aug Sep Oct Nov Dec
Electricity
Heat proxy (gas @ LDC level)
Heating for buildings, vs. electricity system
Source: IEA 2018 adapted by CIEP
Longer term European supply and demand outlook
CHEMICALS REFINING
IRON AND STEEL
NON-FERROUS METALS
NON-METALLIC
MINERALS PAPER
MACHINERY
FOOD AND
BEVERAGES
OTHER
0 20 40 60 80 100
MTOE
PRIMARY METALS
EU INDUSTRIAL NATURAL GAS CONSUMPTION BY INDUSTRIAL SECTOR
EU INDUSTRIAL GAS CONSUMPTION BY MEMBER STATE
Source: CIEP
Largest Energy Imports Europe – 2016 (Mtoe)
Source: CIEP based on Eurostat data. Numbers are in Mtoe and rounded off.
Categories are: Crude oil, Oil products (Total Petroleum Products except for crude oil), Natural gas, and Coal (Solid Fuels). Europe includes both EU and non-EU states.
USA
55
Norway
Russia
Saudi
Arabia
Nigeria
Algeria
37
70
170
452
52
95
11
64
Renewables, networks and
managing change
• We have been made aware of E-network
limitations by issues to connect new wind and
solar to the distribution grid and the large
investments needed to overcome the issues:
– Big plans with regard to electrification of
transportation
– Big plans with regard to electrification of low
temperature heating
– New economic activities/ Data Centres
• How do we maintain control over the stability
of our distribution grids? Who can manage
opposing developments? Smart grids? And
how stupid are we behind the metre?
• Who manages grids, production and
consumption developments? Who makes sure
that we do not have time or spatial
mismatches?
Role of (natural) gas(es) in transition
• Switching away from natural gas (in
low temperature heating) shifts gas
demand to power sector
– Natural Gas will play an important role in
our energy system for longer than we think
as marginal supply for NW European
power sector
– Natural gas security of supply is connected
to power security of supply is connected to
foreign supplies
– Competing for natural gas supplies with
China/Asia for LNG
– Electrification is not a sufficient mitigation
measure for worries about natural gas
security of supply as is sometimes argued
From the current system to a new energy system
Energy carriers in system roles now and later
Elke systeemrol moet vervuld worden voor een goed functionerend energiesysteem. Dragers met beperkingen in rollen maar welke
elkaar aanvullen, kunnen voor die rol samen gelijkwaardig zijn aan een enkele goed geschikte drager.
Current system
Hydrogen is already with us, for a long time
Global demand for hydrogen in pure forms has grown steadily over the past 50 years to around 70 Mt today.
More than 40 Mt is also produced in a mixture of other gases.
Global hydrogen demand
0
10
20
30
40
50
60
70
80
1975 1980 1985 1990 1995 2000 2005 2010 2015 2018e
Milliontonnesofhydrogen
Refining
Ammonia
Other pure
Methanol
Steelmaking (DRI)
Other mixed
Pure hydrogen
Mixed together with
other gases
≈ 2020
Final Energy
Consumption
Sectors
Energy System Management
Private Sector
Actors
Public Sector
Actors
Hybrid
Actors
Conversion
- power plants
- refineries
- boilers (heat)
- etc.
- Incl. electrolysis (power2gas)
- Incl. power2products
- Incl. power2liquids
Storage
- Tanks
- bulk solids
- underground gas storages
- etc.
Electricity
Sector
Transport
- Pipelines
- Cables
- Maritime
- Road
- Rail
Built-
environment
Industry
Transport
Electricity
(solar, wind)
Losses
Energy Supplies meeting Energy Demand: Transition
Electricity
Primary Energy
Production
Fuels
Liquids
(oil)
Gases
(natural gas)
Solids
(coal, biomass)
Market introduction of ‘blue’ and ‘green’ H2
De huidige grijze waterstofvraag kan vervangen en uitgebreid worden door blauwe waterstof,
tegelijkertijd kan groene waterstof technologie opschalen en op termijn blauw aanvullen en/of
vervangen.
Vertaald uit CIEP, ‘International approaches to clean molecules’, 2019
System in transition
Integrated Energy System Transition: An open
energy trade system; with industry as enabler
to create new markets and where assets and
competences of the oil and gas industry are
needed to create a low carbon energy system
Now, building of blue
hydrogen with CCS (ATR),
as a trailblazer for large
scale green hydrogen
later; including market
creation beyond
traditional industrial
markets (refining,
chemicals, steel) to built
environment,
transportation
Nu 40 PJ in
Rotterdam-
Moerdijk
H-vision: +50 PJ 250 MW BP/Nouryon: 5 PJ
2GW Electrolyser Park: 40 PJ
H-vision reference case industry
Hydrogen: 2018 grey – 2020 blue – 2030 green
(possible) Different roles of hydrogen
Elektriciteitssector
Industrie
Internationaal perspectief
Primary Energy
Production
Final Energy
Consumption
Sectors
Energy System Management
Private Sector
Actors
Public Sector
Actors
Hybrid
Actors
Conversion
- Into gases, liquids, solids
- Incl. electrolysis (power2gas)
- Incl. power2products
- Incl. power2liquids
Storage
- Tanks
- bulk solids
- underground gas storages
- etc.
Electricity
Sector
Transport
- Pipelines
- Cables
- Maritime
- Road
- Rail
Built-
environment
Industry
Transport
Electricity
(solar, wind)
Losses
Energy Supplies meeting Energy Demand: Future
Electricity
Natural gas
with CCUS
Fuels
Potential 2050
Summarising: From the current energy system backbone to a
new one
Thank you!
Visit us at www.clingendaelenergy.com

Coby van der Linde - CIEP

  • 1.
    Building a newenergy system backbone in NW Europe and managing transition 29 October 2019, Geldermalsen Coby van der Linde
  • 2.
    33000 34000 35000 36000 37000 2010 2011 20122013 2014 2015 2016 2017 2018 2014-2016 2017-2018 Graph by CIEP Data: Carbon Atlas (2010-2017), IEA (2018) Global CO2 emissions 2010-2018 – MtCO2
  • 3.
    • Efficiency, RES,C2G are helping limit CO2 emission growth • CO2 intensity of the economy has been consistently decreasing in the last years • However, this has not been enough to lower total CO2 emissions Deconstructing CO2 emission growth 2017-2018 – MtCO2
  • 4.
    The spectacular riseof China CO2 emissions in 1960-2017 – MtCO2
  • 5.
    Embedded CO2 emissionsin trade Top 6 carbon dioxide emitters, 2005 and 2015 CO2 in trade
  • 6.
    Solar Wind Today Other Global electricity mix1970-2018 and why energy per carbon matters Source: BNEF Reduction range in the order of 50% to 65% !
  • 7.
    0 200 400 600 800 1000 1200 1400 1600 1800 2000 2000 2001 2002 2003 2004 2005 2006 2007 2008 2009 2010 2011 2012 2013 2014 2015 2016 2017 Source: CIEP basedon data from BP 51% 49% % of world coal consumption in 2017 China ROW 1960 2017 33145 26516 19897 13258 6629 CO2 emissions by fuel → The heavy contribution of Chinese coal Mtoe MtCO2 Coal consumption – China vs rest of the world (ROW) China ROW
  • 8.
    Final Energy Consumption Conversion - powerplants - refineries - boilers (heat) - etc. Storage - tanks (liquids) - bulk solids (coal) - underground gas storages - etc. Transport - Pipelines - Cables - Maritime - Road - Rail Liquids (oil) Gases (natural gas) Solids (coal) Energy Supplies meeting Energy Demand: TodayPrimary Energy Production Sectors Fuels Energy System Management Private Sector Actors Public Sector Actors Hybrid Actors Electricity Sector Built- environment Industry Transport Losses
  • 9.
    Source: Eurostat 2016 EuropeanEnergy balance (2016 Eurostat)
  • 11.
    Energy consumption inEurope CIEP (2016) graph based on Eurostat 2014 data 2014 Final Energy Consumption Solar and wind still small in comparison Electricity about 20% of total consumption in EU member states About 75% of energy are ‘molecules; liquids or gases
  • 12.
    Uncertainties about developmentsin the power sector in Europe Managing uncertainties: • Early electrification (of transportation and low temperature heat) ahead of expansion REN capacities translates in growth gas demand • Coal and nuclear ‘Ausstieg’ in Germany, Belgium, Netherlands. • Most investments in power are in intermittent production capacity • Do we have a timing problem? Most countries solve their problems (on paper) with imports from neighboring countries. Is this realistic when they all plan the same? • Investments in dispatchable capacity and storage are lagging. • Will Dutch gas plants stay open if the market does not value them in the short term and while we do know that we need them in later years? • What about the (gas) infrastructure investments? And permitting? • How could a transition from natural gas to hydrogen or other clean molecules materialize? Source: Timera energy Announced closures of power generation capacity
  • 13.
    Electricity from Solar& wind Germany (1/2) • Every day, solar (yellow) peaks around noon and goes back to zero in the evening • Many days, wind energy (blue) is produced, but sometimes for days it is not • Different seasons show different patters • Electricity generation in Germany in the month of June and July 2019 Bron: Agora Energiewende (2019)
  • 14.
    Electricity from Solar& wind Germany (2/2) Source: Agora Energiewende (2017) • Every day, solar (yellow) peaks around noon and goes back to zero in the evening • Many days, wind energy (blue) is produced, but sometimes for days it is not • Different seasons show different patterns, and as a result also different emission profiles (dark purple line) • Electricity generation in Germany in the months of January and February 2019
  • 15.
    Seasonality of HeatDemand (NL example) GW Source: CIEP (2016) based on GTS & ENTSO-E data Jan Feb Mar Apr May Jun Jul Aug Sep Oct Nov Dec Electricity Heat proxy (gas @ LDC level) Heating for buildings, vs. electricity system
  • 16.
    Source: IEA 2018adapted by CIEP Longer term European supply and demand outlook
  • 17.
    CHEMICALS REFINING IRON ANDSTEEL NON-FERROUS METALS NON-METALLIC MINERALS PAPER MACHINERY FOOD AND BEVERAGES OTHER 0 20 40 60 80 100 MTOE PRIMARY METALS EU INDUSTRIAL NATURAL GAS CONSUMPTION BY INDUSTRIAL SECTOR EU INDUSTRIAL GAS CONSUMPTION BY MEMBER STATE Source: CIEP
  • 18.
    Largest Energy ImportsEurope – 2016 (Mtoe) Source: CIEP based on Eurostat data. Numbers are in Mtoe and rounded off. Categories are: Crude oil, Oil products (Total Petroleum Products except for crude oil), Natural gas, and Coal (Solid Fuels). Europe includes both EU and non-EU states. USA 55 Norway Russia Saudi Arabia Nigeria Algeria 37 70 170 452 52 95 11 64
  • 19.
    Renewables, networks and managingchange • We have been made aware of E-network limitations by issues to connect new wind and solar to the distribution grid and the large investments needed to overcome the issues: – Big plans with regard to electrification of transportation – Big plans with regard to electrification of low temperature heating – New economic activities/ Data Centres • How do we maintain control over the stability of our distribution grids? Who can manage opposing developments? Smart grids? And how stupid are we behind the metre? • Who manages grids, production and consumption developments? Who makes sure that we do not have time or spatial mismatches?
  • 20.
    Role of (natural)gas(es) in transition • Switching away from natural gas (in low temperature heating) shifts gas demand to power sector – Natural Gas will play an important role in our energy system for longer than we think as marginal supply for NW European power sector – Natural gas security of supply is connected to power security of supply is connected to foreign supplies – Competing for natural gas supplies with China/Asia for LNG – Electrification is not a sufficient mitigation measure for worries about natural gas security of supply as is sometimes argued
  • 21.
    From the currentsystem to a new energy system
  • 22.
    Energy carriers insystem roles now and later Elke systeemrol moet vervuld worden voor een goed functionerend energiesysteem. Dragers met beperkingen in rollen maar welke elkaar aanvullen, kunnen voor die rol samen gelijkwaardig zijn aan een enkele goed geschikte drager.
  • 23.
  • 24.
    Hydrogen is alreadywith us, for a long time Global demand for hydrogen in pure forms has grown steadily over the past 50 years to around 70 Mt today. More than 40 Mt is also produced in a mixture of other gases. Global hydrogen demand 0 10 20 30 40 50 60 70 80 1975 1980 1985 1990 1995 2000 2005 2010 2015 2018e Milliontonnesofhydrogen Refining Ammonia Other pure Methanol Steelmaking (DRI) Other mixed Pure hydrogen Mixed together with other gases
  • 25.
  • 26.
    Final Energy Consumption Sectors Energy SystemManagement Private Sector Actors Public Sector Actors Hybrid Actors Conversion - power plants - refineries - boilers (heat) - etc. - Incl. electrolysis (power2gas) - Incl. power2products - Incl. power2liquids Storage - Tanks - bulk solids - underground gas storages - etc. Electricity Sector Transport - Pipelines - Cables - Maritime - Road - Rail Built- environment Industry Transport Electricity (solar, wind) Losses Energy Supplies meeting Energy Demand: Transition Electricity Primary Energy Production Fuels Liquids (oil) Gases (natural gas) Solids (coal, biomass)
  • 27.
    Market introduction of‘blue’ and ‘green’ H2 De huidige grijze waterstofvraag kan vervangen en uitgebreid worden door blauwe waterstof, tegelijkertijd kan groene waterstof technologie opschalen en op termijn blauw aanvullen en/of vervangen. Vertaald uit CIEP, ‘International approaches to clean molecules’, 2019
  • 28.
  • 29.
    Integrated Energy SystemTransition: An open energy trade system; with industry as enabler to create new markets and where assets and competences of the oil and gas industry are needed to create a low carbon energy system
  • 30.
    Now, building ofblue hydrogen with CCS (ATR), as a trailblazer for large scale green hydrogen later; including market creation beyond traditional industrial markets (refining, chemicals, steel) to built environment, transportation Nu 40 PJ in Rotterdam- Moerdijk H-vision: +50 PJ 250 MW BP/Nouryon: 5 PJ 2GW Electrolyser Park: 40 PJ H-vision reference case industry Hydrogen: 2018 grey – 2020 blue – 2030 green
  • 31.
    (possible) Different rolesof hydrogen Elektriciteitssector Industrie Internationaal perspectief
  • 32.
    Primary Energy Production Final Energy Consumption Sectors EnergySystem Management Private Sector Actors Public Sector Actors Hybrid Actors Conversion - Into gases, liquids, solids - Incl. electrolysis (power2gas) - Incl. power2products - Incl. power2liquids Storage - Tanks - bulk solids - underground gas storages - etc. Electricity Sector Transport - Pipelines - Cables - Maritime - Road - Rail Built- environment Industry Transport Electricity (solar, wind) Losses Energy Supplies meeting Energy Demand: Future Electricity Natural gas with CCUS Fuels
  • 33.
  • 34.
    Summarising: From thecurrent energy system backbone to a new one
  • 35.
    Thank you! Visit usat www.clingendaelenergy.com