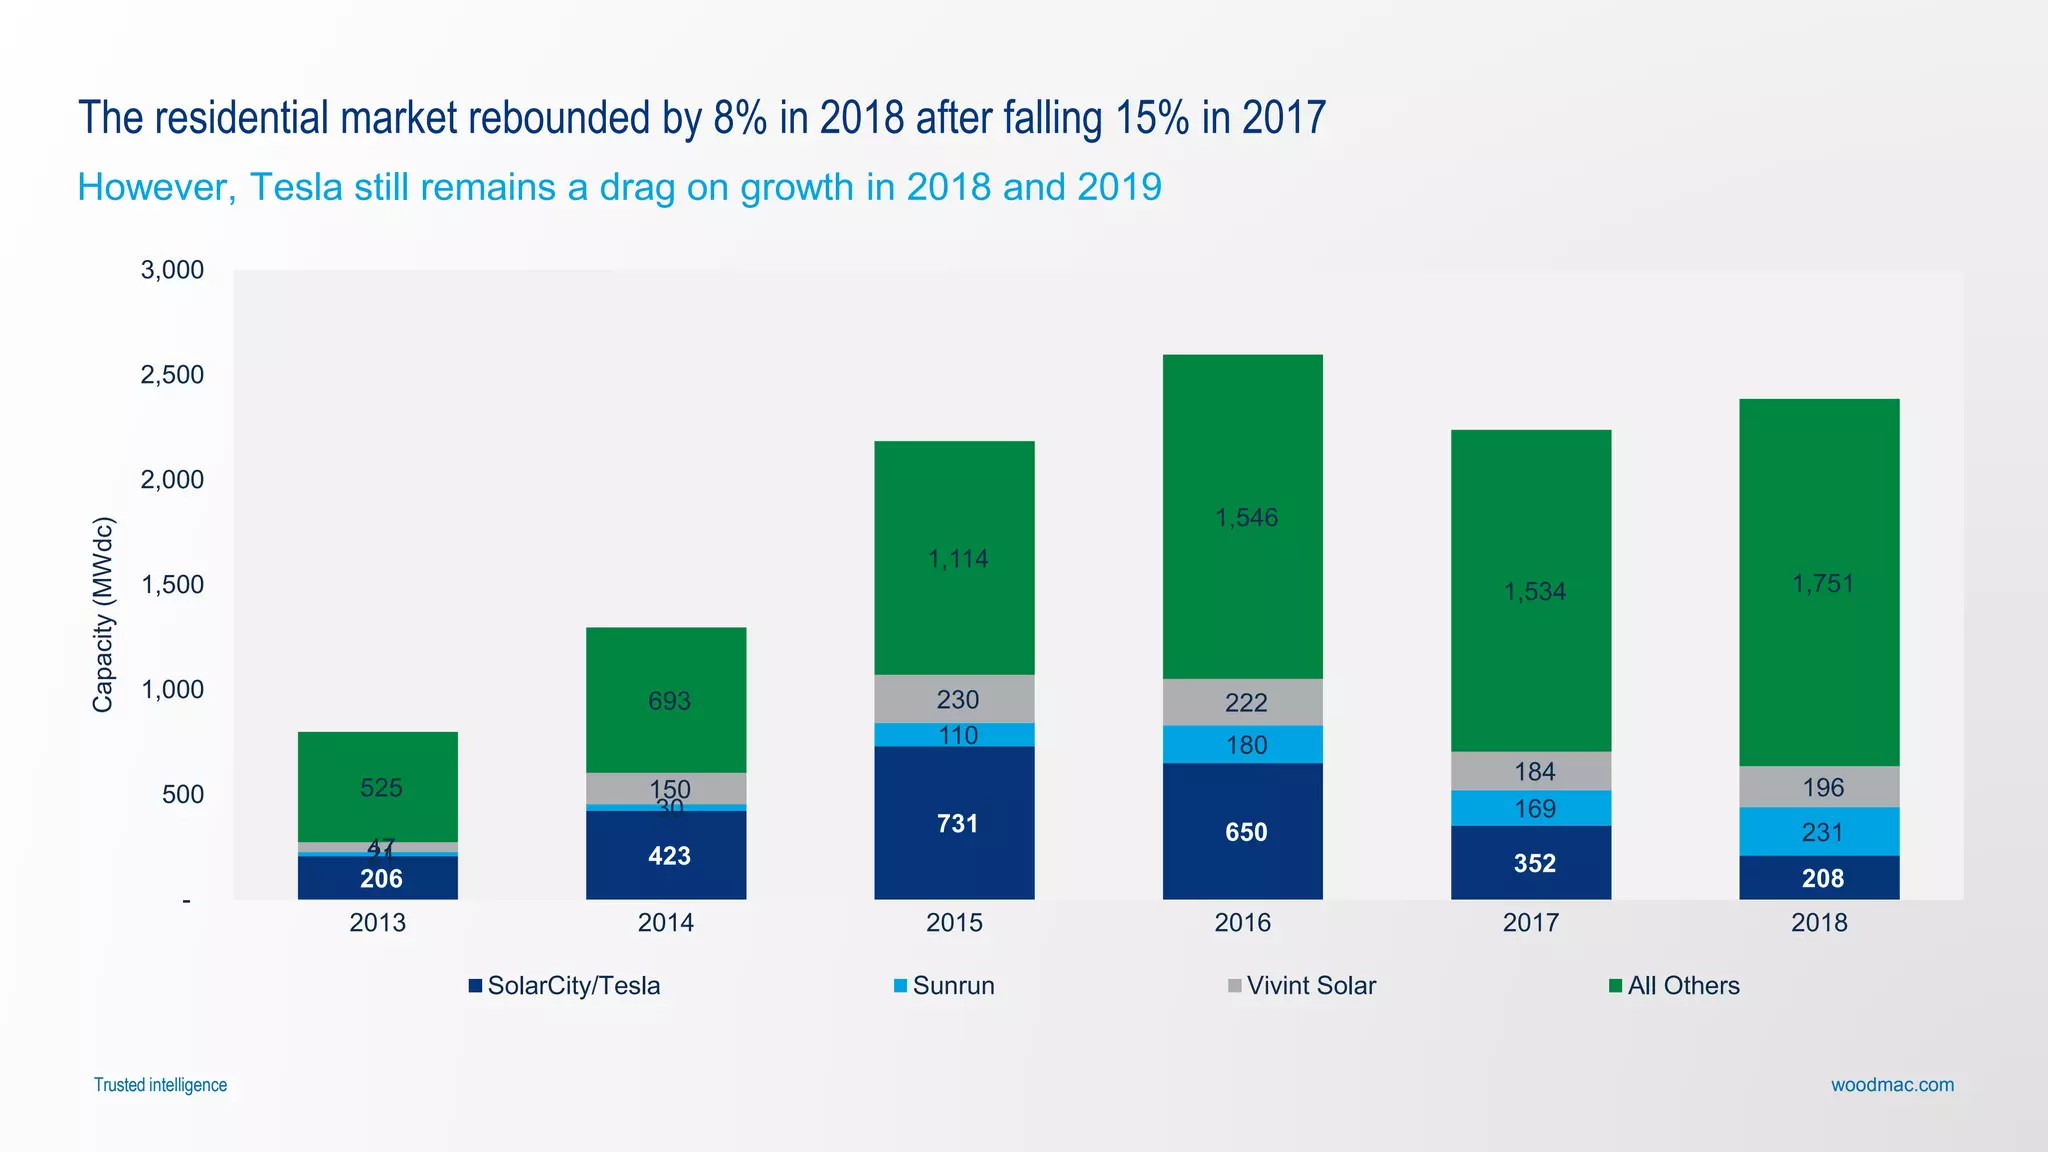
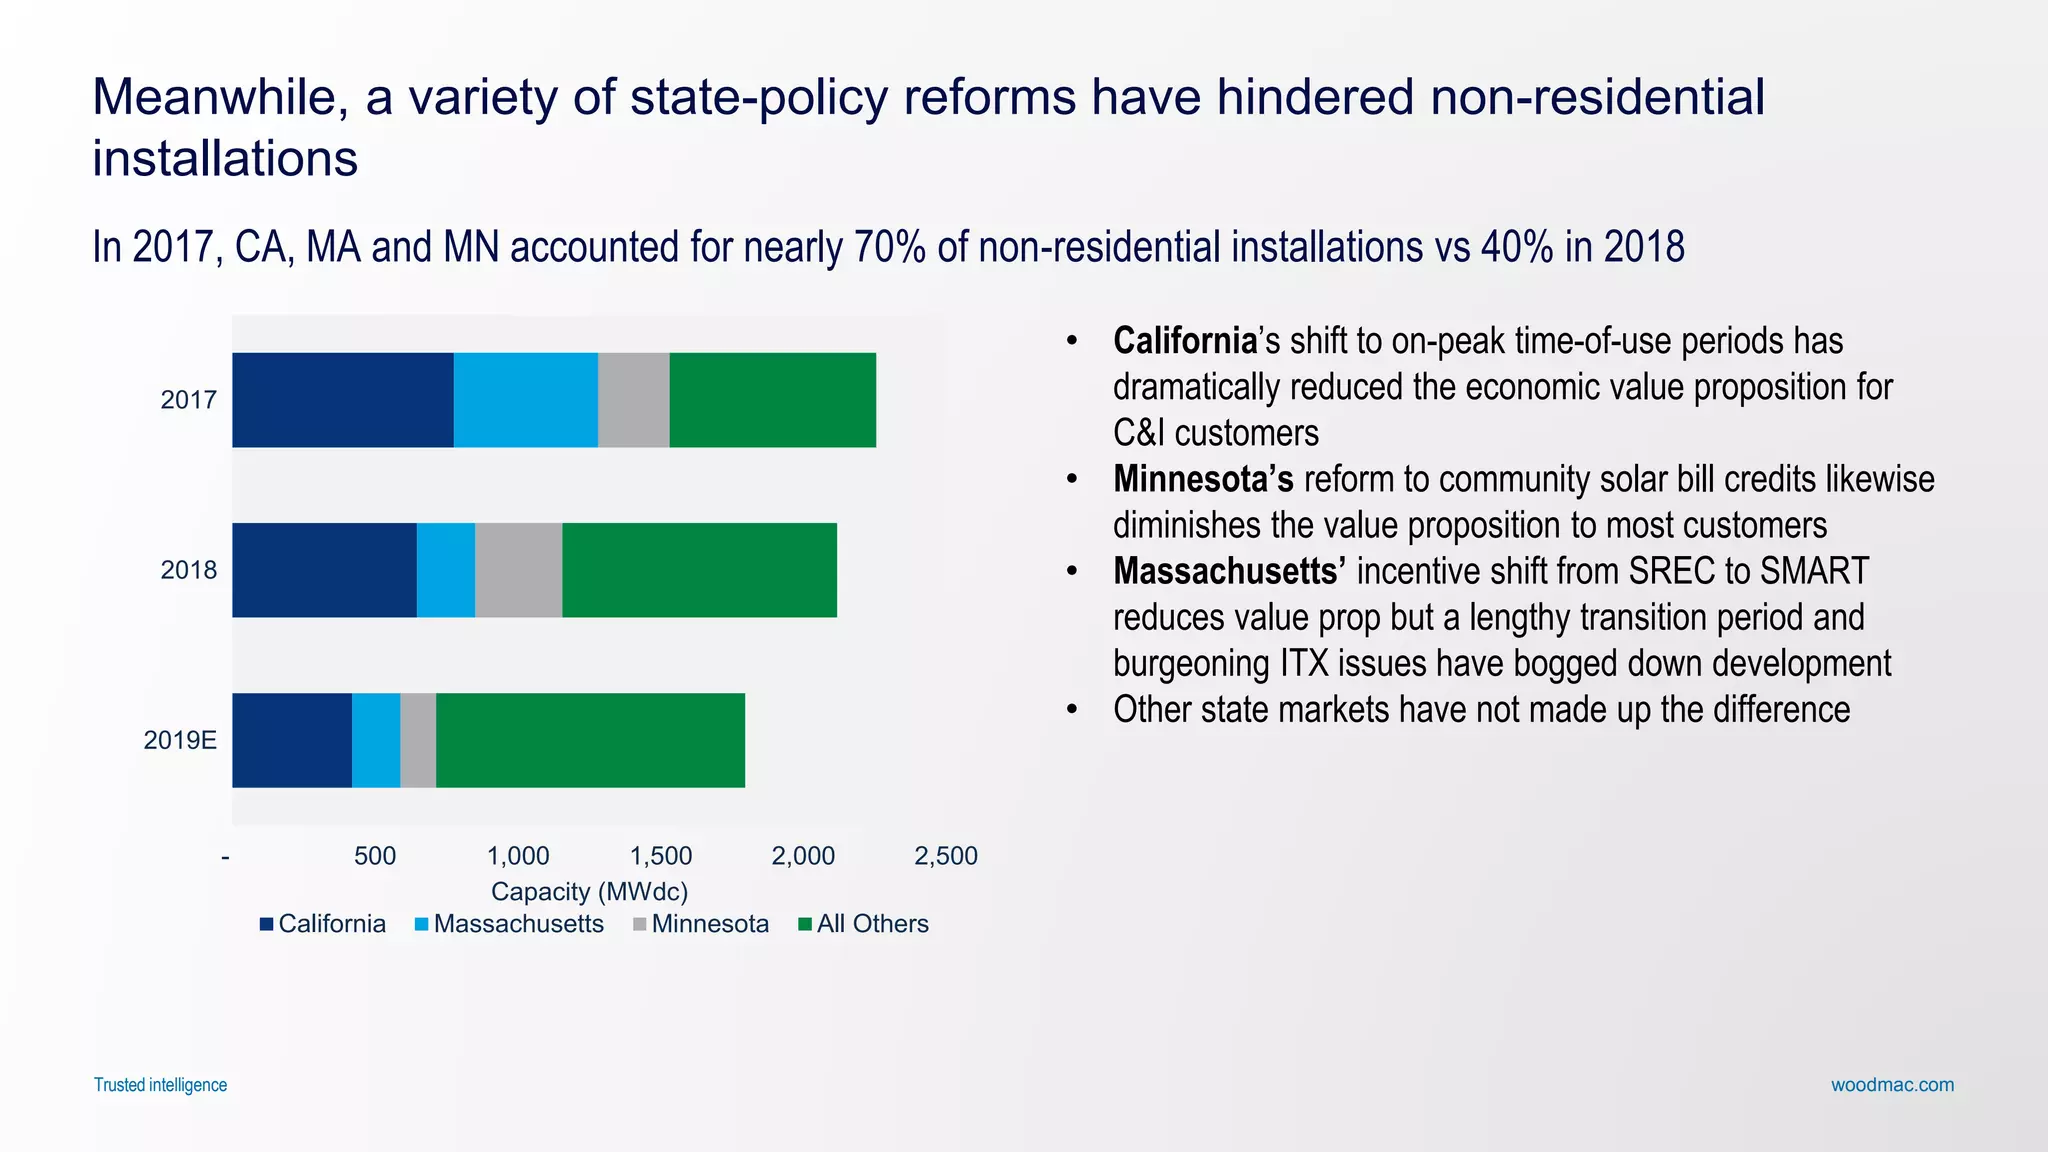
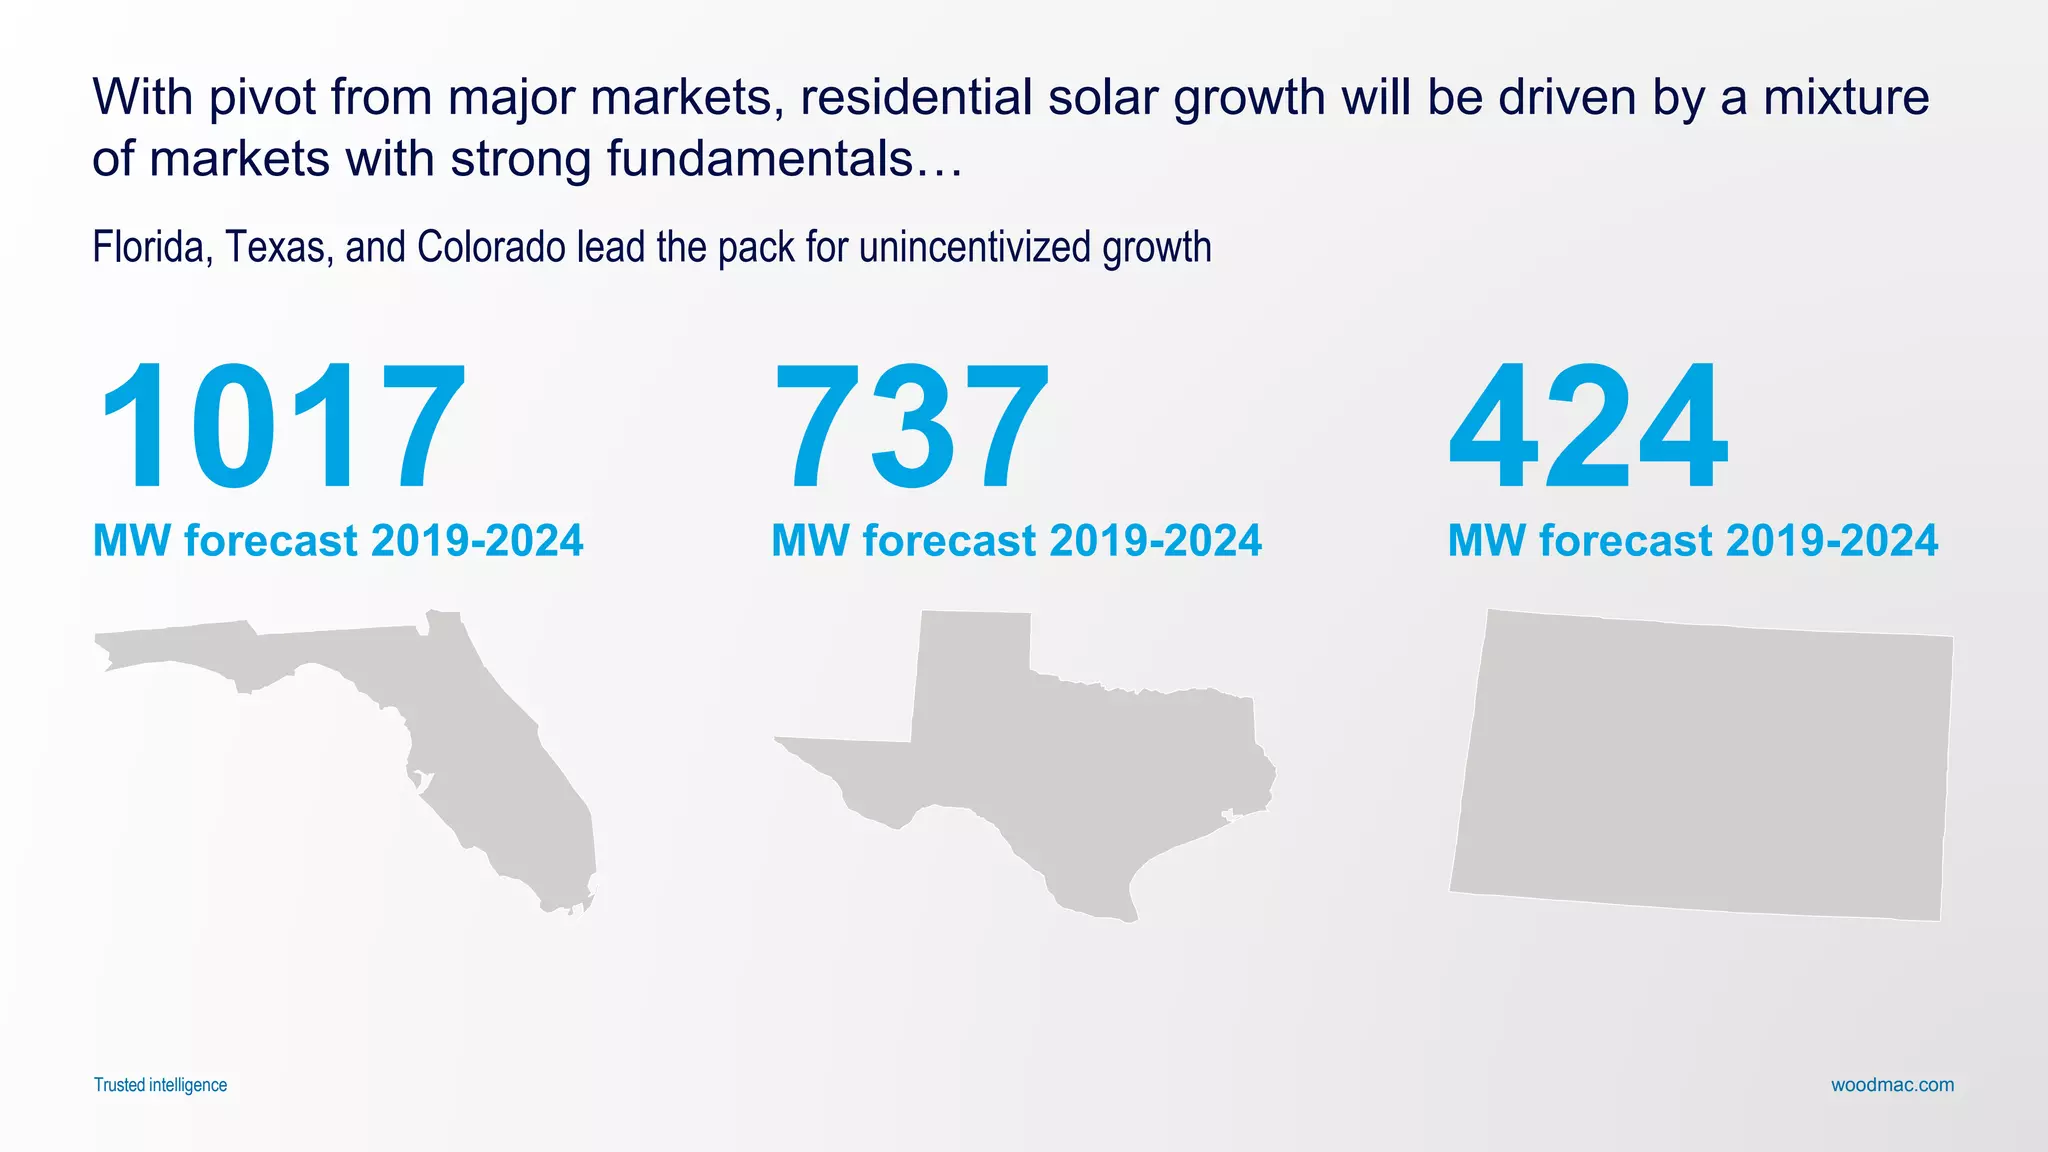
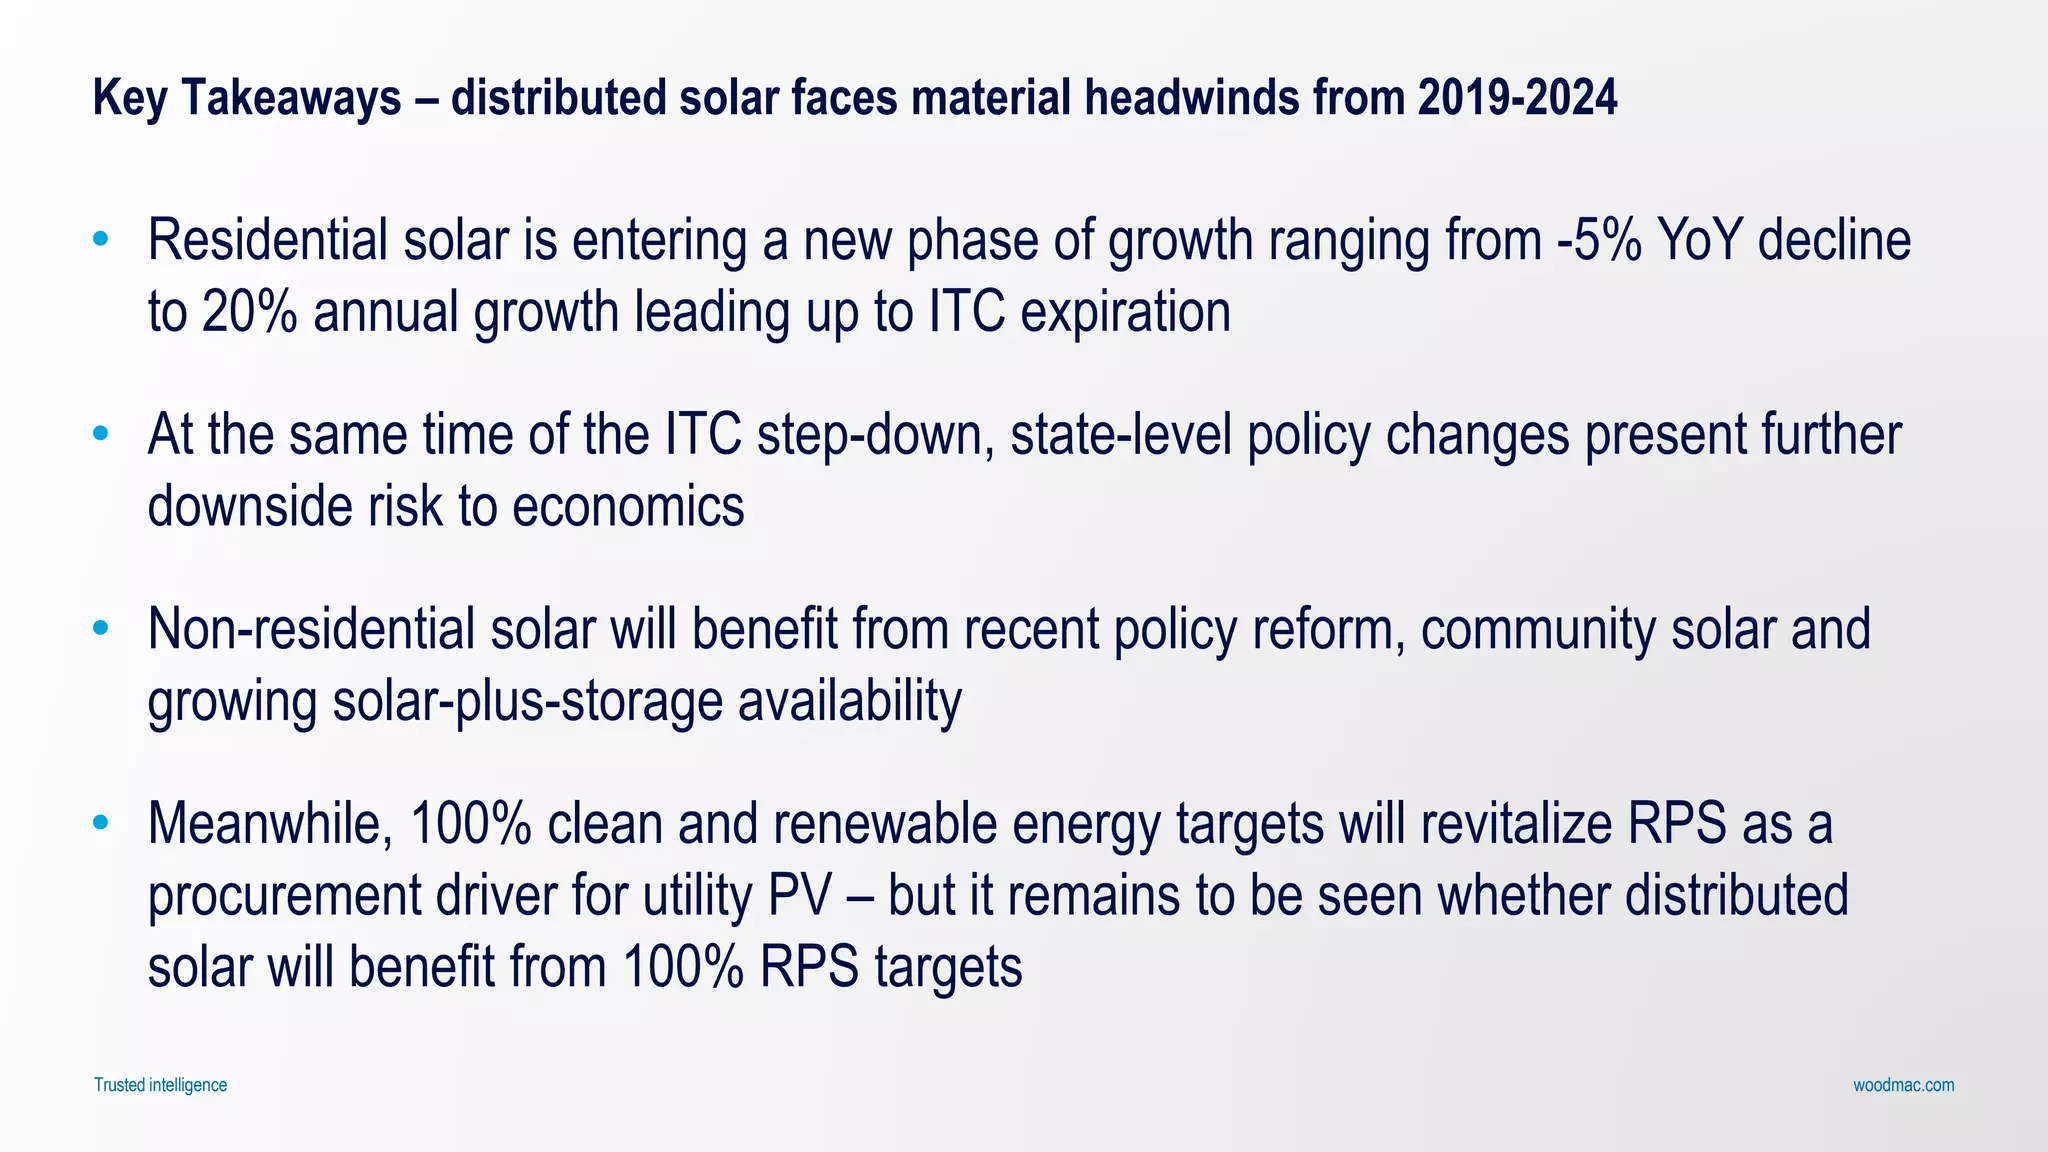
Wood Mackenzie is a research firm with expertise in renewable energy, electricity grids, and electric vehicles. This presentation summarizes the 2018 US solar market and provides an outlook for 2019-2021. The key points are: 1) The US solar market grew slowly in 2018 but utility-scale solar continues to be driven by economic factors rather than policies; 2) Residential solar rebounded in 2018 while non-residential installations declined due to policy changes in major states; 3) Significant policy changes in key states over the next few years will impact market growth as incentives change and the investment tax credit steps down.


![woodmac.comTrusted intelligence
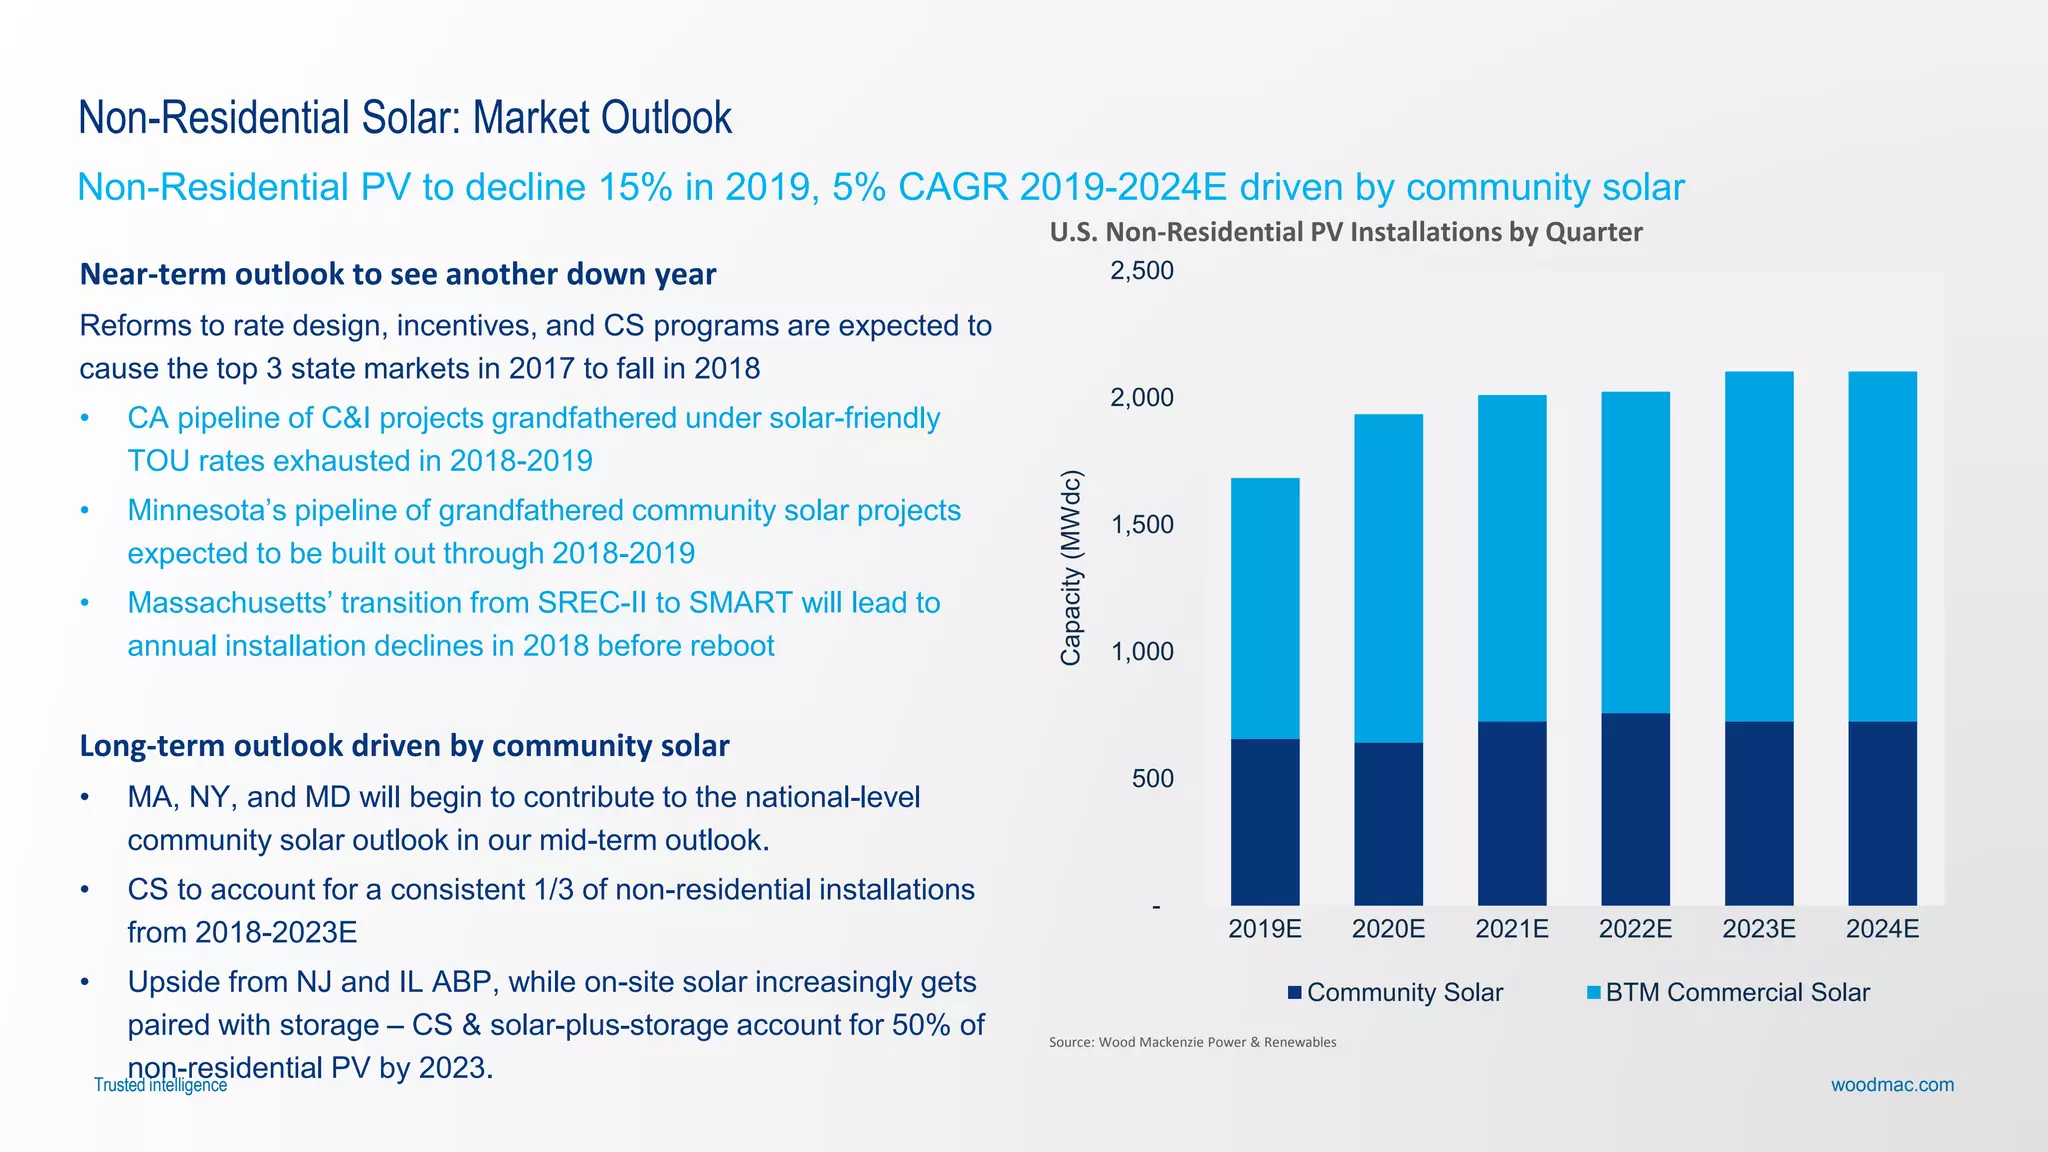
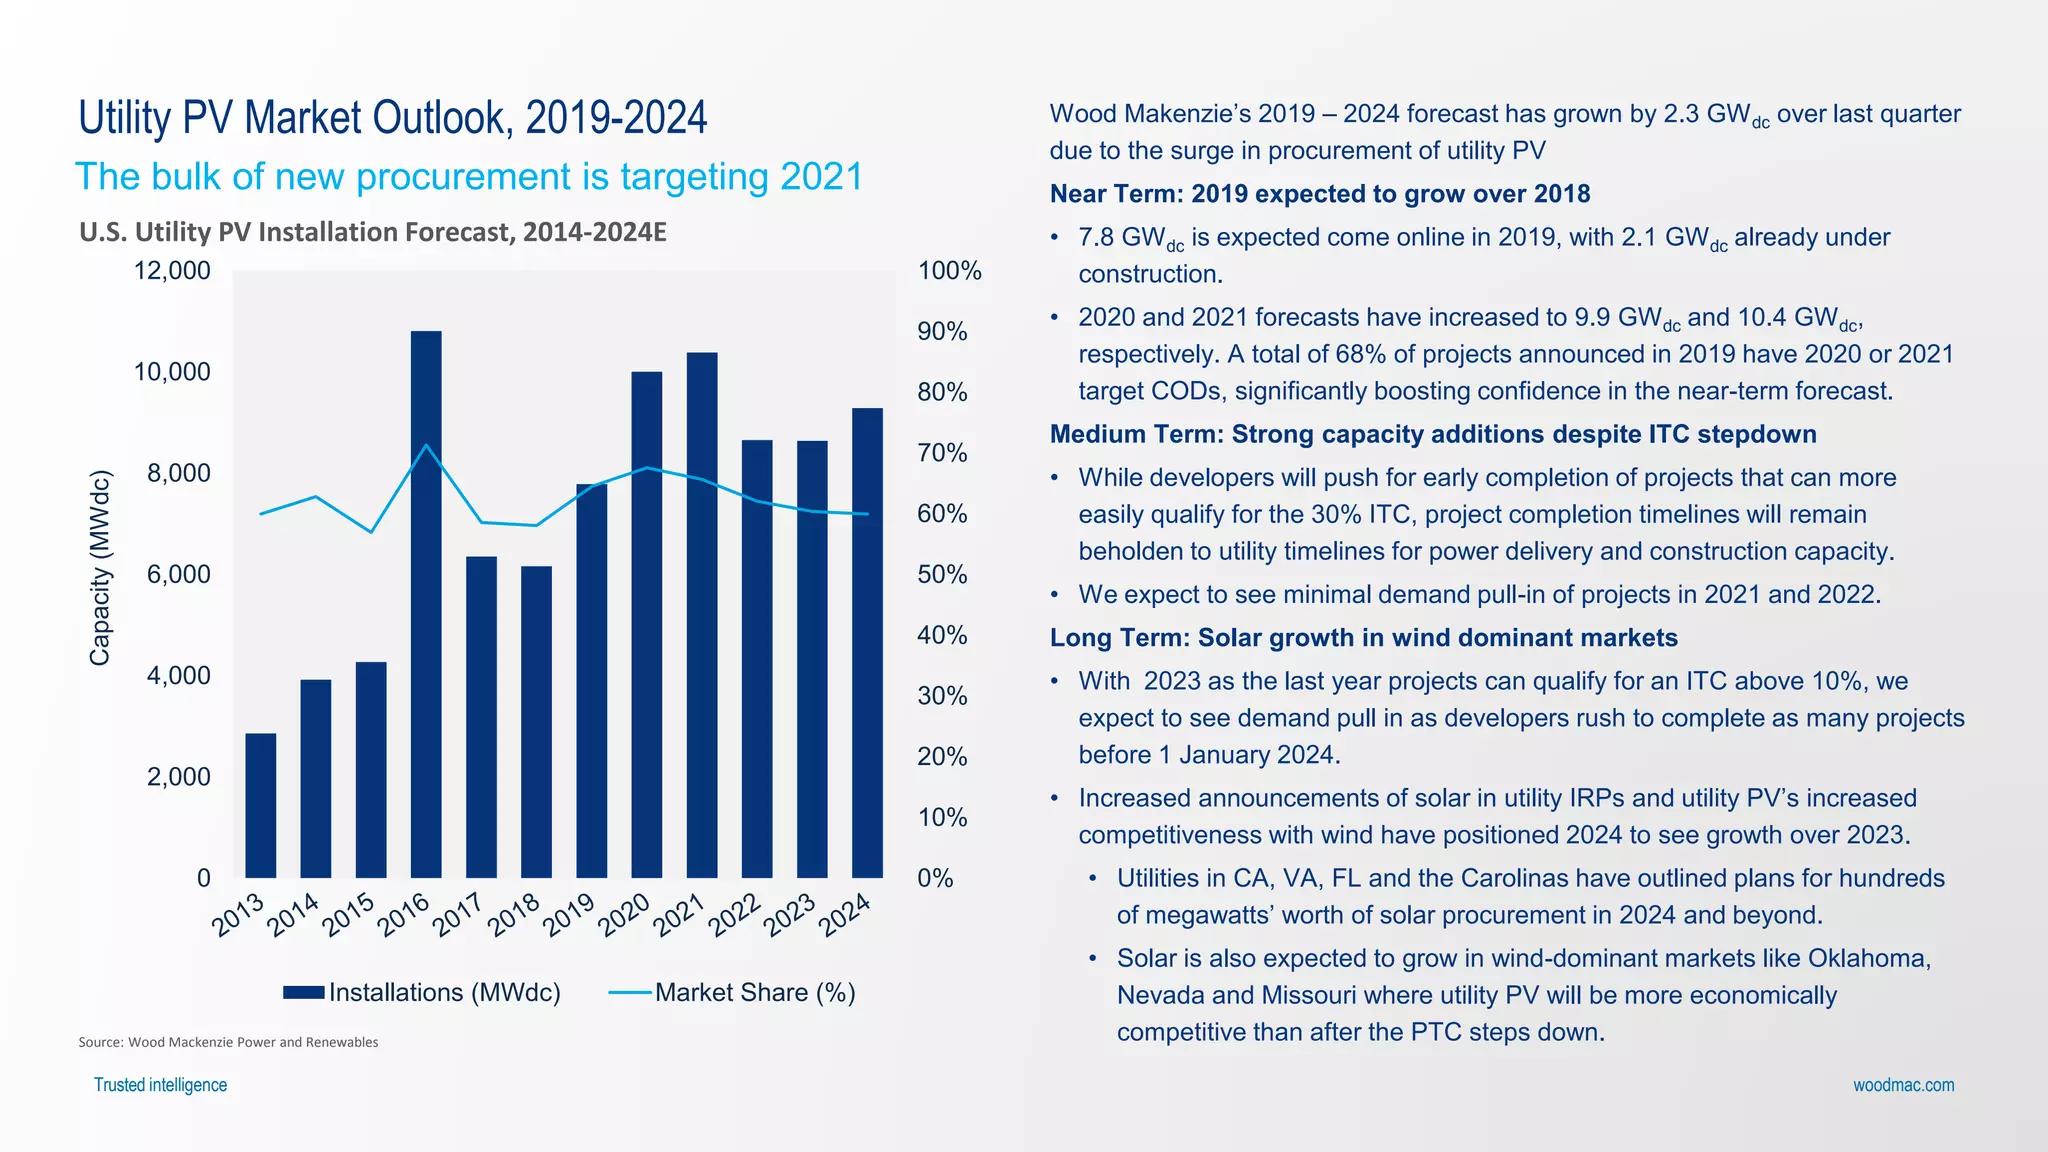
Source: Wood Mackenzie Power and Renewables
Section 201 – Near term impact but long term recovery
Module tariffs have impacted utility solar but the market has proven astoundingly resilient
The White House announced on January 22nd that President Trump has
issued a 30 percent year-one tariff on imported c-Si solar cells and
modules.
• Tariffs: “Ad valorem” (percent-based) tariffs on imported c-Si cells and
modules will decline over a four year period, starting at 30% in year 1 and
declining by 5% per year to 15% in year 4.
• This will result in an average $0.10/W increase in year 1 prices to
modules, stepping down to a $0.04/W premium by year 4.
• Quotas: The first 2.5 gigawatts of imported c-Si cells are excluded from the
tariff in each of those four years.
• The safeguard measures (i.e. tariffs and quotas) took effect on February
7, 2018, which was 15 days from the date President Trump signed the
proclamation.
Final Decision on Section
201
Year 1 Year 2 Year 3 Year 4
Safeguard Tariff on Cells
and Modules
30% 25% 20% 15%
Cells Exempted from Tariff
(Quota)
2.5 GW 2.5 GW 2.5 GW 2.5 GW
-
7%[CELLRAN
GE]
6,198
[CELLRANGE]
-18%
7,786
[CELLRANGE]
8%
10,003
[CELLRANGE]
19%
10,383
[CELLRANGE]
8,655
8,638
9,287
0
2,000
4,000
6,000
8,000
10,000
12,000
2014 2016 2018 2020E 2022E 2024E
Annualinstalledcapacity(MWdc)
Q4-2017 Forecast Q1-2019 Forecast
Despite tariff impacts, the current 2018-
2022 forecast now exceeds Wood
Mackenzie’s pre-tariff forecast](https://image.slidesharecdn.com/solarsummitpresentation-2019statepolicycompass-190514175854/75/2019-State-Policy-Compass-29-2048.jpg)


![[Smart Grid Market Research] A Closer Look at DSM, Energy Storage and Distrib...](https://cdn.slidesharecdn.com/ss_thumbnails/acloserlookatdsmenergystorageanddistributedgenerationaugust2011zprymeresearch-110729070909-phpapp02-thumbnail.jpg?width=640&height=640&fit=bounds)


