2019 10-09 google ads analysis - eyeballing without proper math
•
1 like•67 views

A brief showcase of a cafe's first year's work on digital advertising via the Google Ads medium. Most small businesses don't fully utilise these tools, and I believe that a lot more work needs to be done to educate the market. PRELIMINARY CONCLUSION Each of DISPLAY COST and SEARCH COST have an independently positive correlation with SALES
![Period 1
January 1
to
April 20
⇤
During this period, campaigns
were largely on auto-pilot, under
pre-programmed rules, scripts,
and other adjustments.
SEARCH COST was jacked up
gradually towards 67 MYR/d.
SALES appear to have a strong
positive correlation with
increasing SEARCH COST.
DISPLAY COST was more
volatile. We may be seeing a
slight positive correlation between
DISPLAY COST and [ SALES
per-unit of SEARCH COST ]. This
needs to be examined in more
detail.](data:image/gif;base64,R0lGODlhAQABAIAAAAAAAP///yH5BAEAAAAALAAAAAABAAEAAAIBRAA7)
Recommended
More Related Content
Similar to 2019 10-09 google ads analysis - eyeballing without proper math
Similar to 2019 10-09 google ads analysis - eyeballing without proper math (20)
More from YangJerng Hwa
More from YangJerng Hwa (19)
Recently uploaded
Recently uploaded (20)
2019 10-09 google ads analysis - eyeballing without proper math
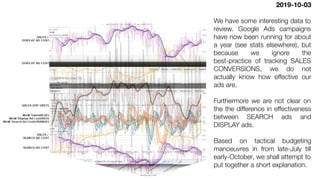
- 1. 2019-10-03 We have some interesting data to review. Google Ads campaigns have now been running for about a year (see stats elsewhere), but because we ignore the best-practice of tracking SALES CONVERSIONS, we do not actually know how effective our ads are. Furthermore we are not clear on the the difference in effectiveness between SEARCH ads and DISPLAY ads. Based on tactical budgeting manoeuvres in from late-July till early-October, we shall attempt to put together a short explanation.
- 2. Period 1 January 1 to April 20 ⇤ During this period, campaigns were largely on auto-pilot, under pre-programmed rules, scripts, and other adjustments. SEARCH COST was jacked up gradually towards 67 MYR/d. SALES appear to have a strong positive correlation with increasing SEARCH COST. DISPLAY COST was more volatile. We may be seeing a slight positive correlation between DISPLAY COST and [ SALES per-unit of SEARCH COST ]. This needs to be examined in more detail.
- 3. To June 24 ⇤ During this period, campaigns were largely on auto-pilot, under pre-programmed rules, scripts, and other adjustments. SEARCH COST was jacked up gradually towards 100 MYR/d. SALES appear to flat-line, however we do know we were outperforming the market during this period, in terms of SALES, so perhaps the positive correlation remains. DISPLAY COST was tweaked down towards 11 MYR/d, and we may be seeing positive correlation with [ SALES per-unit of SEARCH COST ], but the latter could just be negatively correlated with SEARCH COST. This needs to be examined in more detail. Period 2 April 21 ⇥
- 4. To July 4 ⇤ SALES crashed in the third week after Eid (June 5). Reduction in [ SALES per-unit of DISPLAY COST ] and [ SALES per-unit of SEARCH COST ], was probably due to natural causes (‘organic’). SEARCH COST and DISPLAY COST were both quite volatile during this period, so we may have to look more closely at that. Period 3 June 25 ⇥
- 5. To AUG 4 ⇤ SALES trend back up again. This could be a positive correlation with DISPLAY COST as that rises towards 50 MYR/d. SEARCH COST is trending down this whole time. Period 4 July 5 ⇥
- 6. ⇤ There are a number of long weekends this month. However, a lot of weird things also happen in terms of cost control: [ SEARCH COST + DISPLAY COST] in August is 20% lower (2,400 MYR/mo) than in recent months (3,000 MYR/mo). Breaking this down, DISPLAY COSTS are trending down throughout the period towards 18 MYR/d, so it looks like the positive correlation with SALES continues from the previous period. SEARCH COST is pretty flat. Period 5 August 5 To September 5 ⇥
- 7. ⇤ SALES trends back up again, moderately, during this period. DISPLAY COST trends up slightly. SEARCH COST trends down slightly. Period 6 September 6 To September 26 ⇥
- 8. Over this period we ramp up SEARCH COST sharply, and DISPLAY COST just slightly. SALES appear to tick upwards, sharply also. PRELIMINARY CONCLUSION Each of DISPLAY COST and SEARCH COST have an independently positive correlation with SALES NEXT STEPS Ramp up DISPLAY COST back to 50 MYR/d and SEARCH COST back to 90 MYR/d, pushing total spend towards 4,000 MYR/mo. Period 7 September 27 To October 9 ⇥