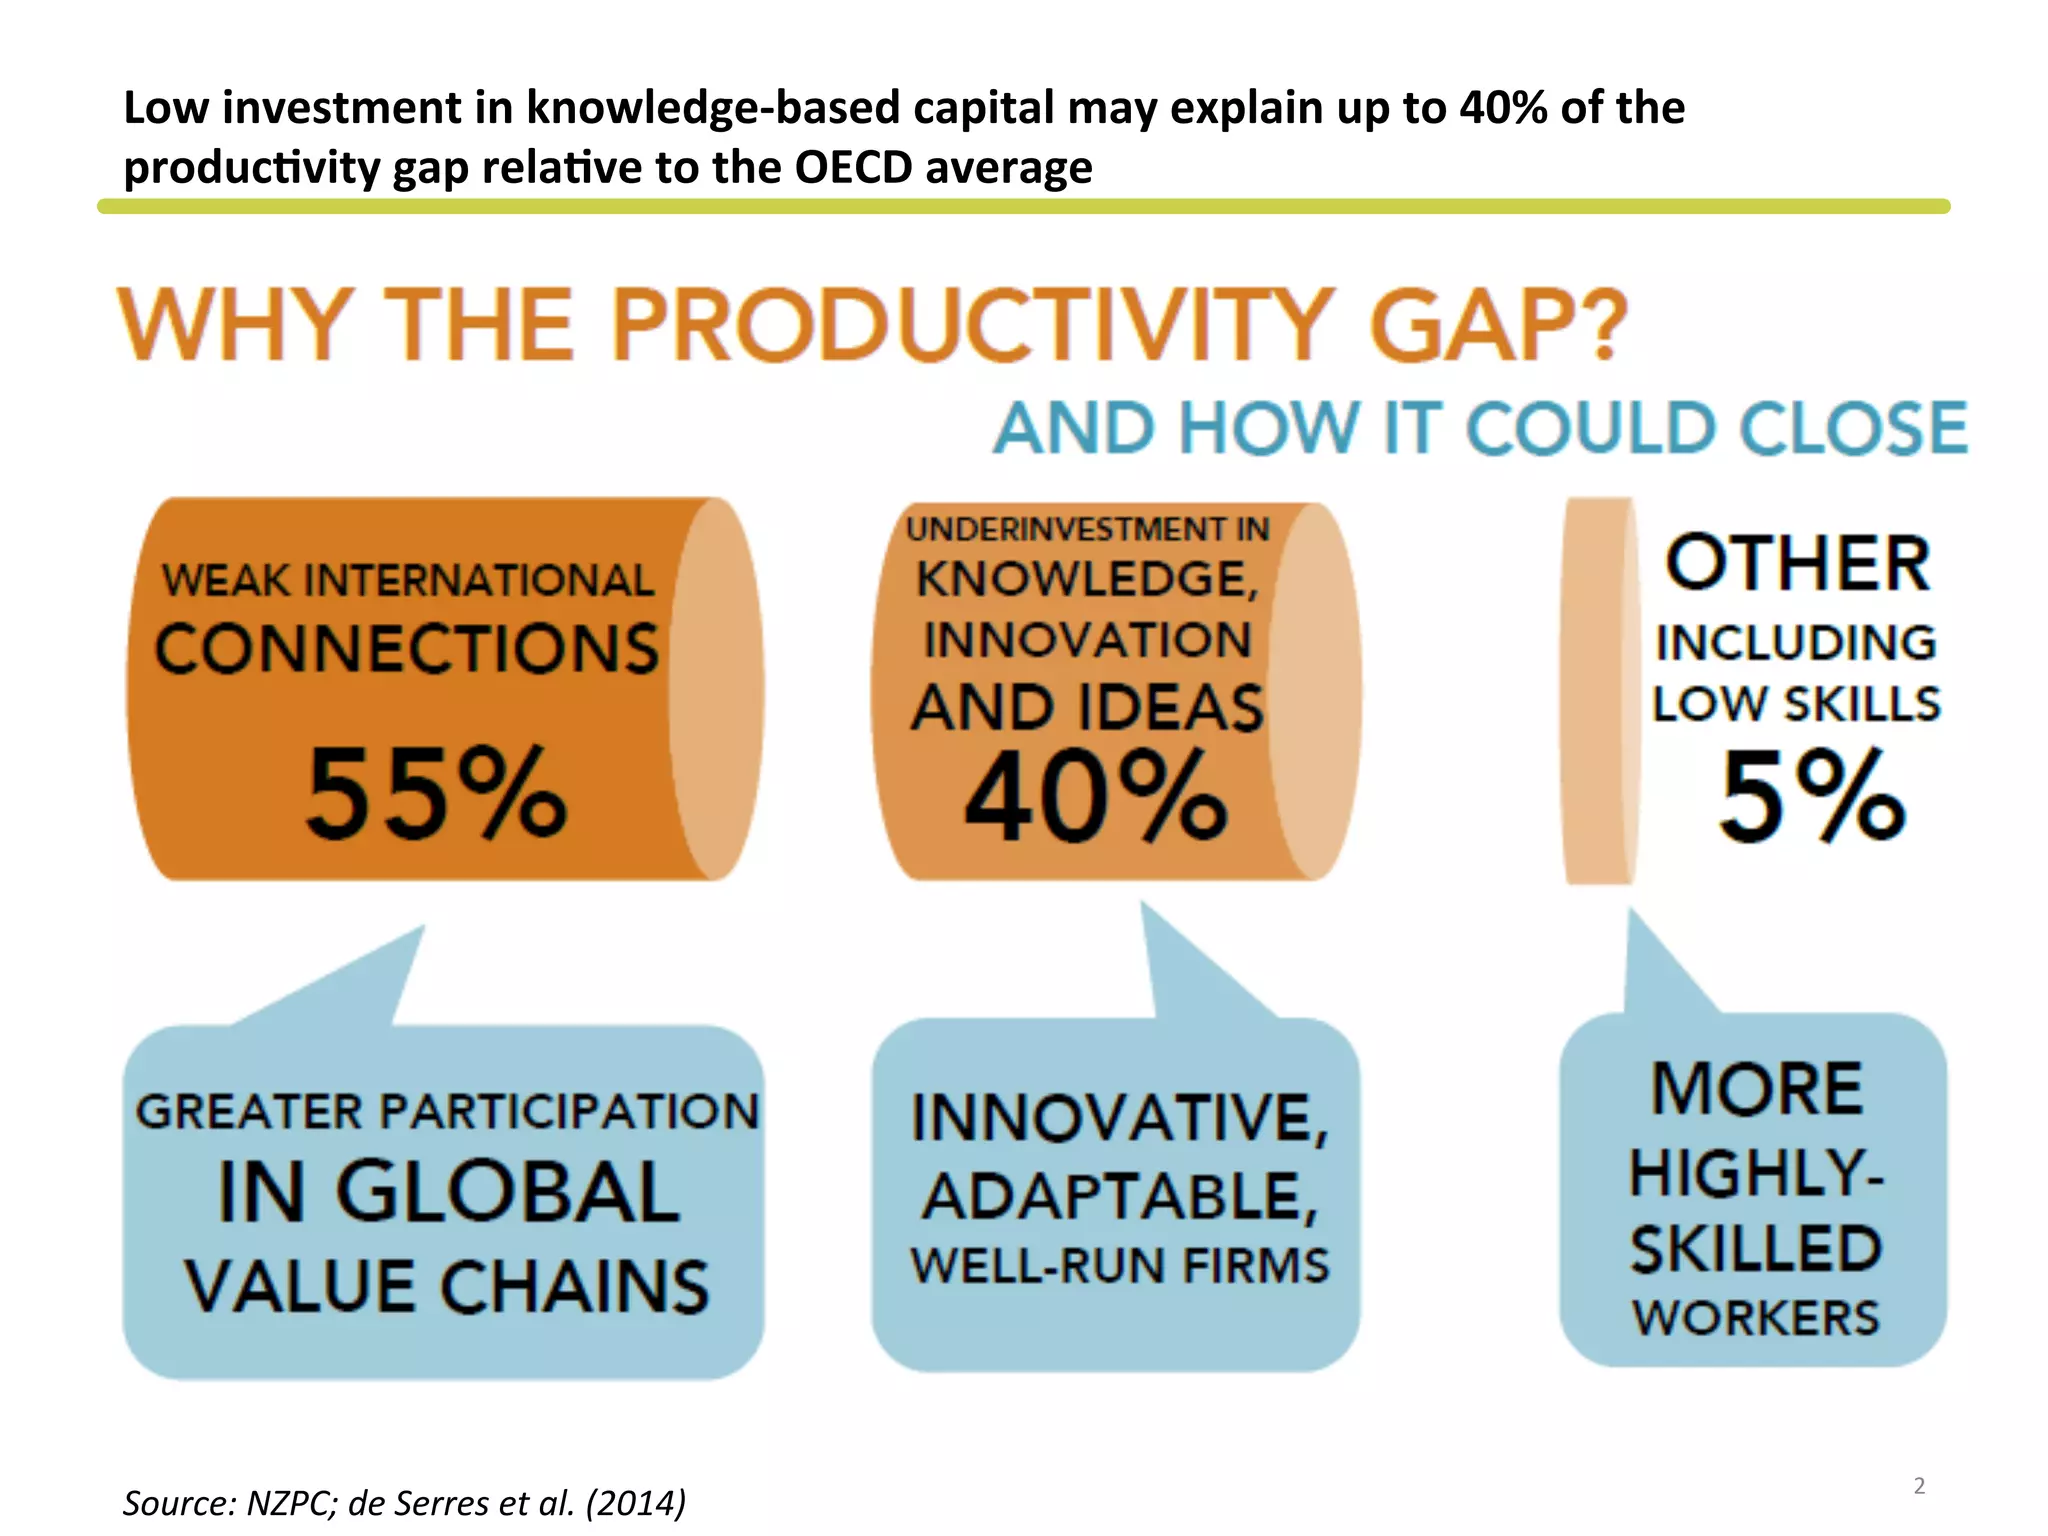
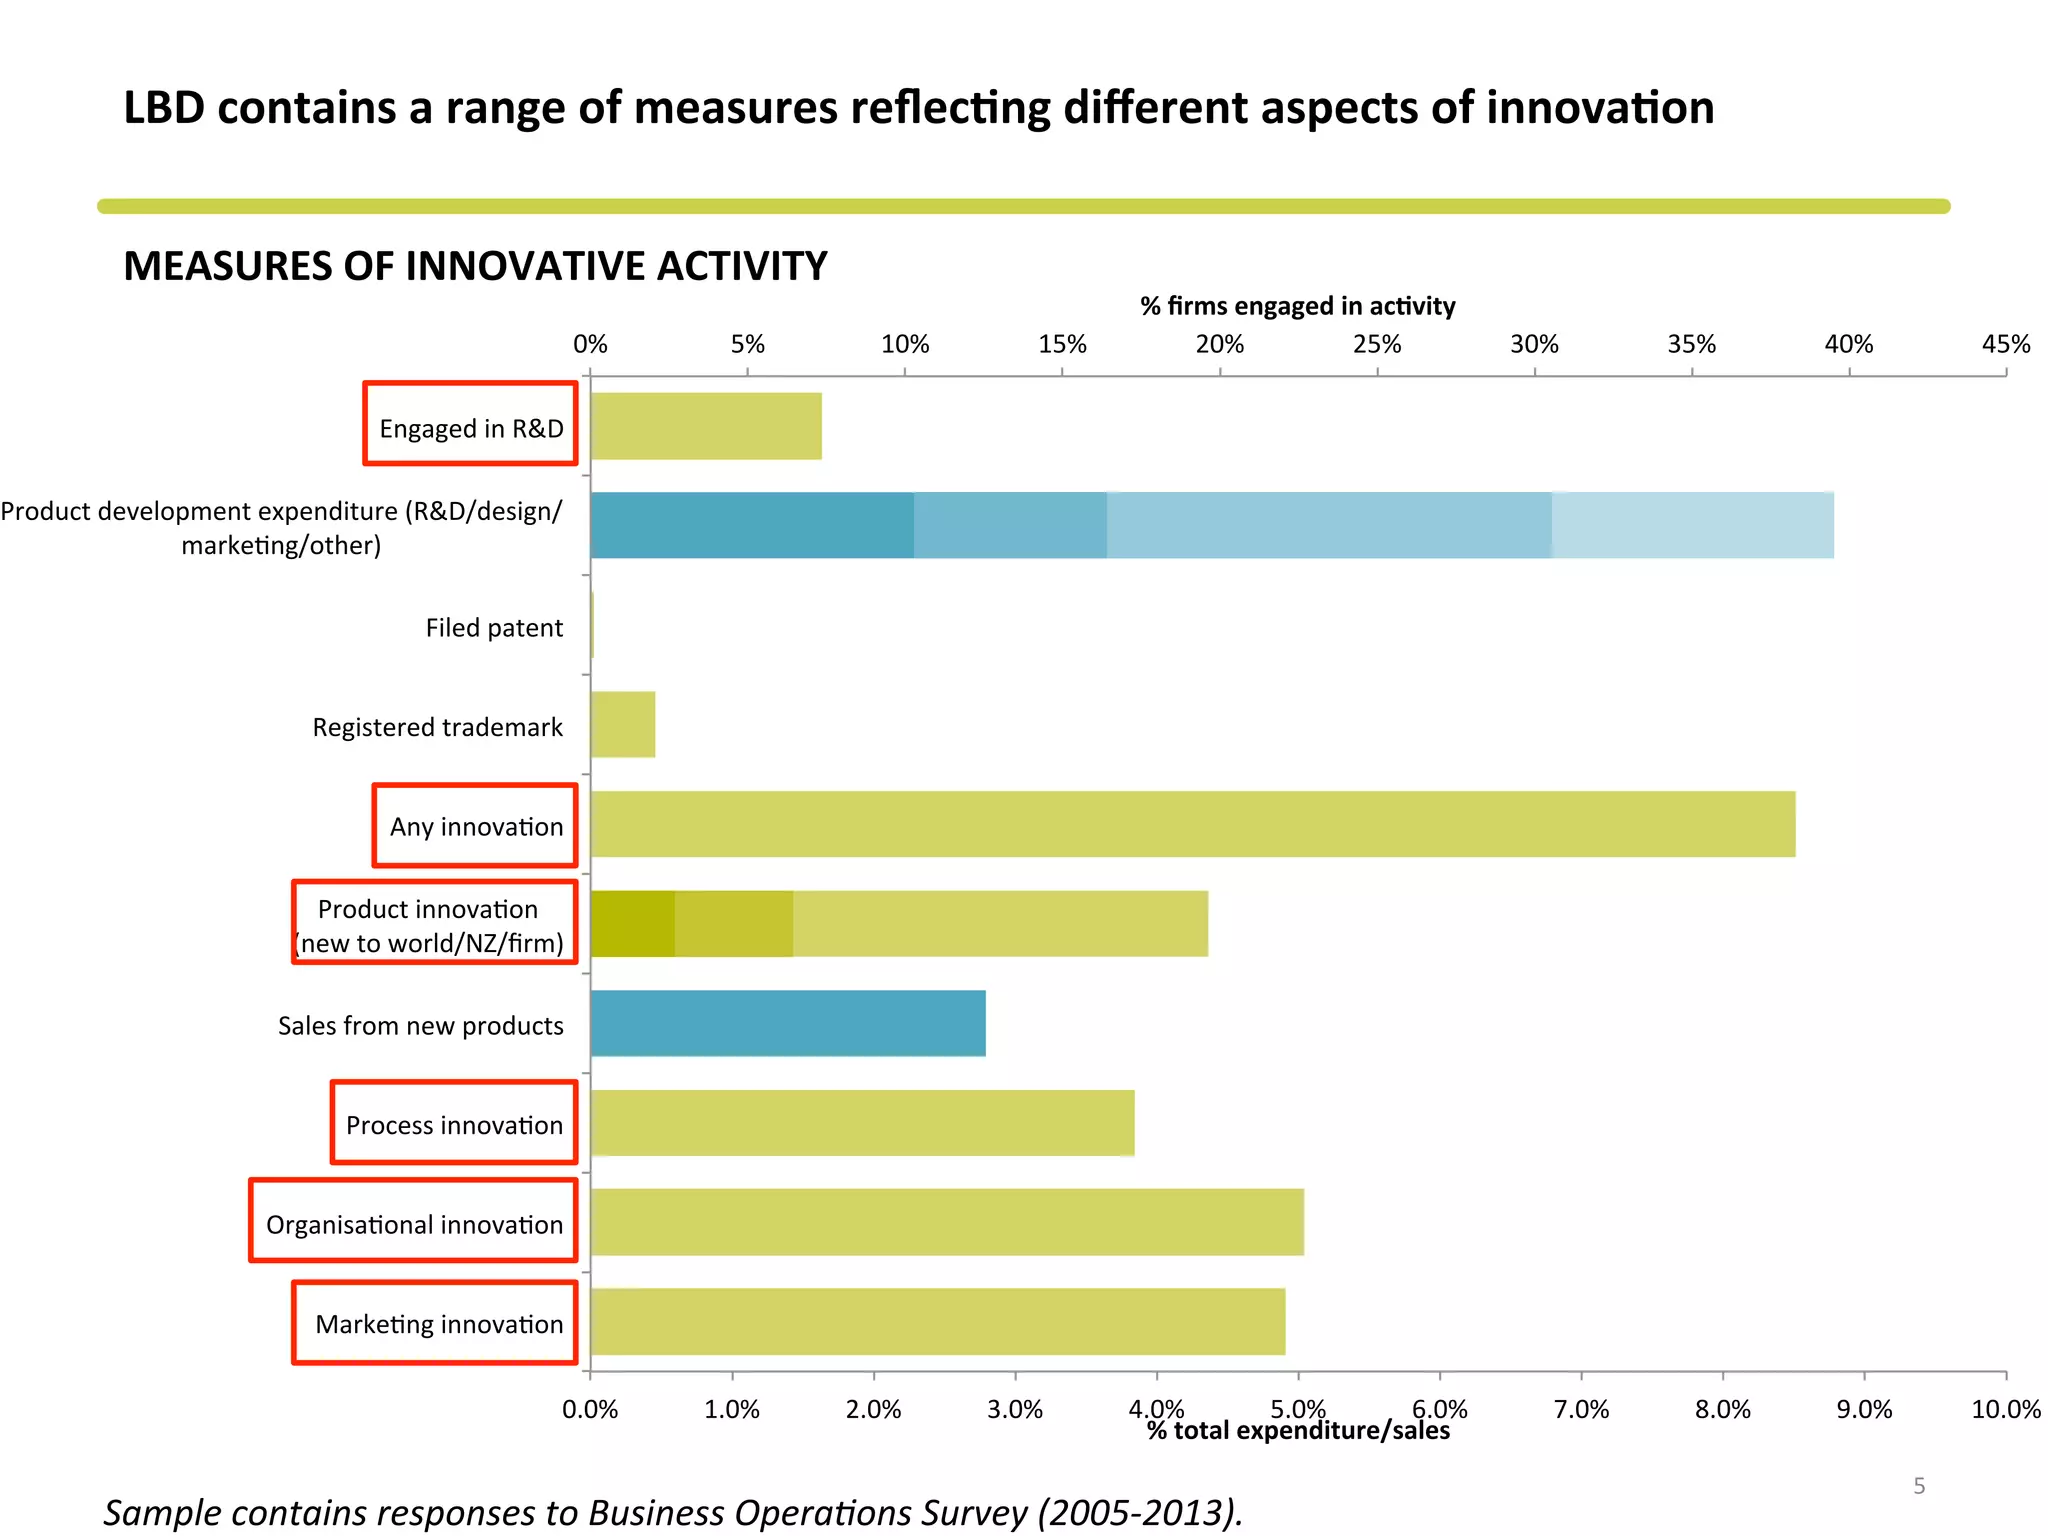
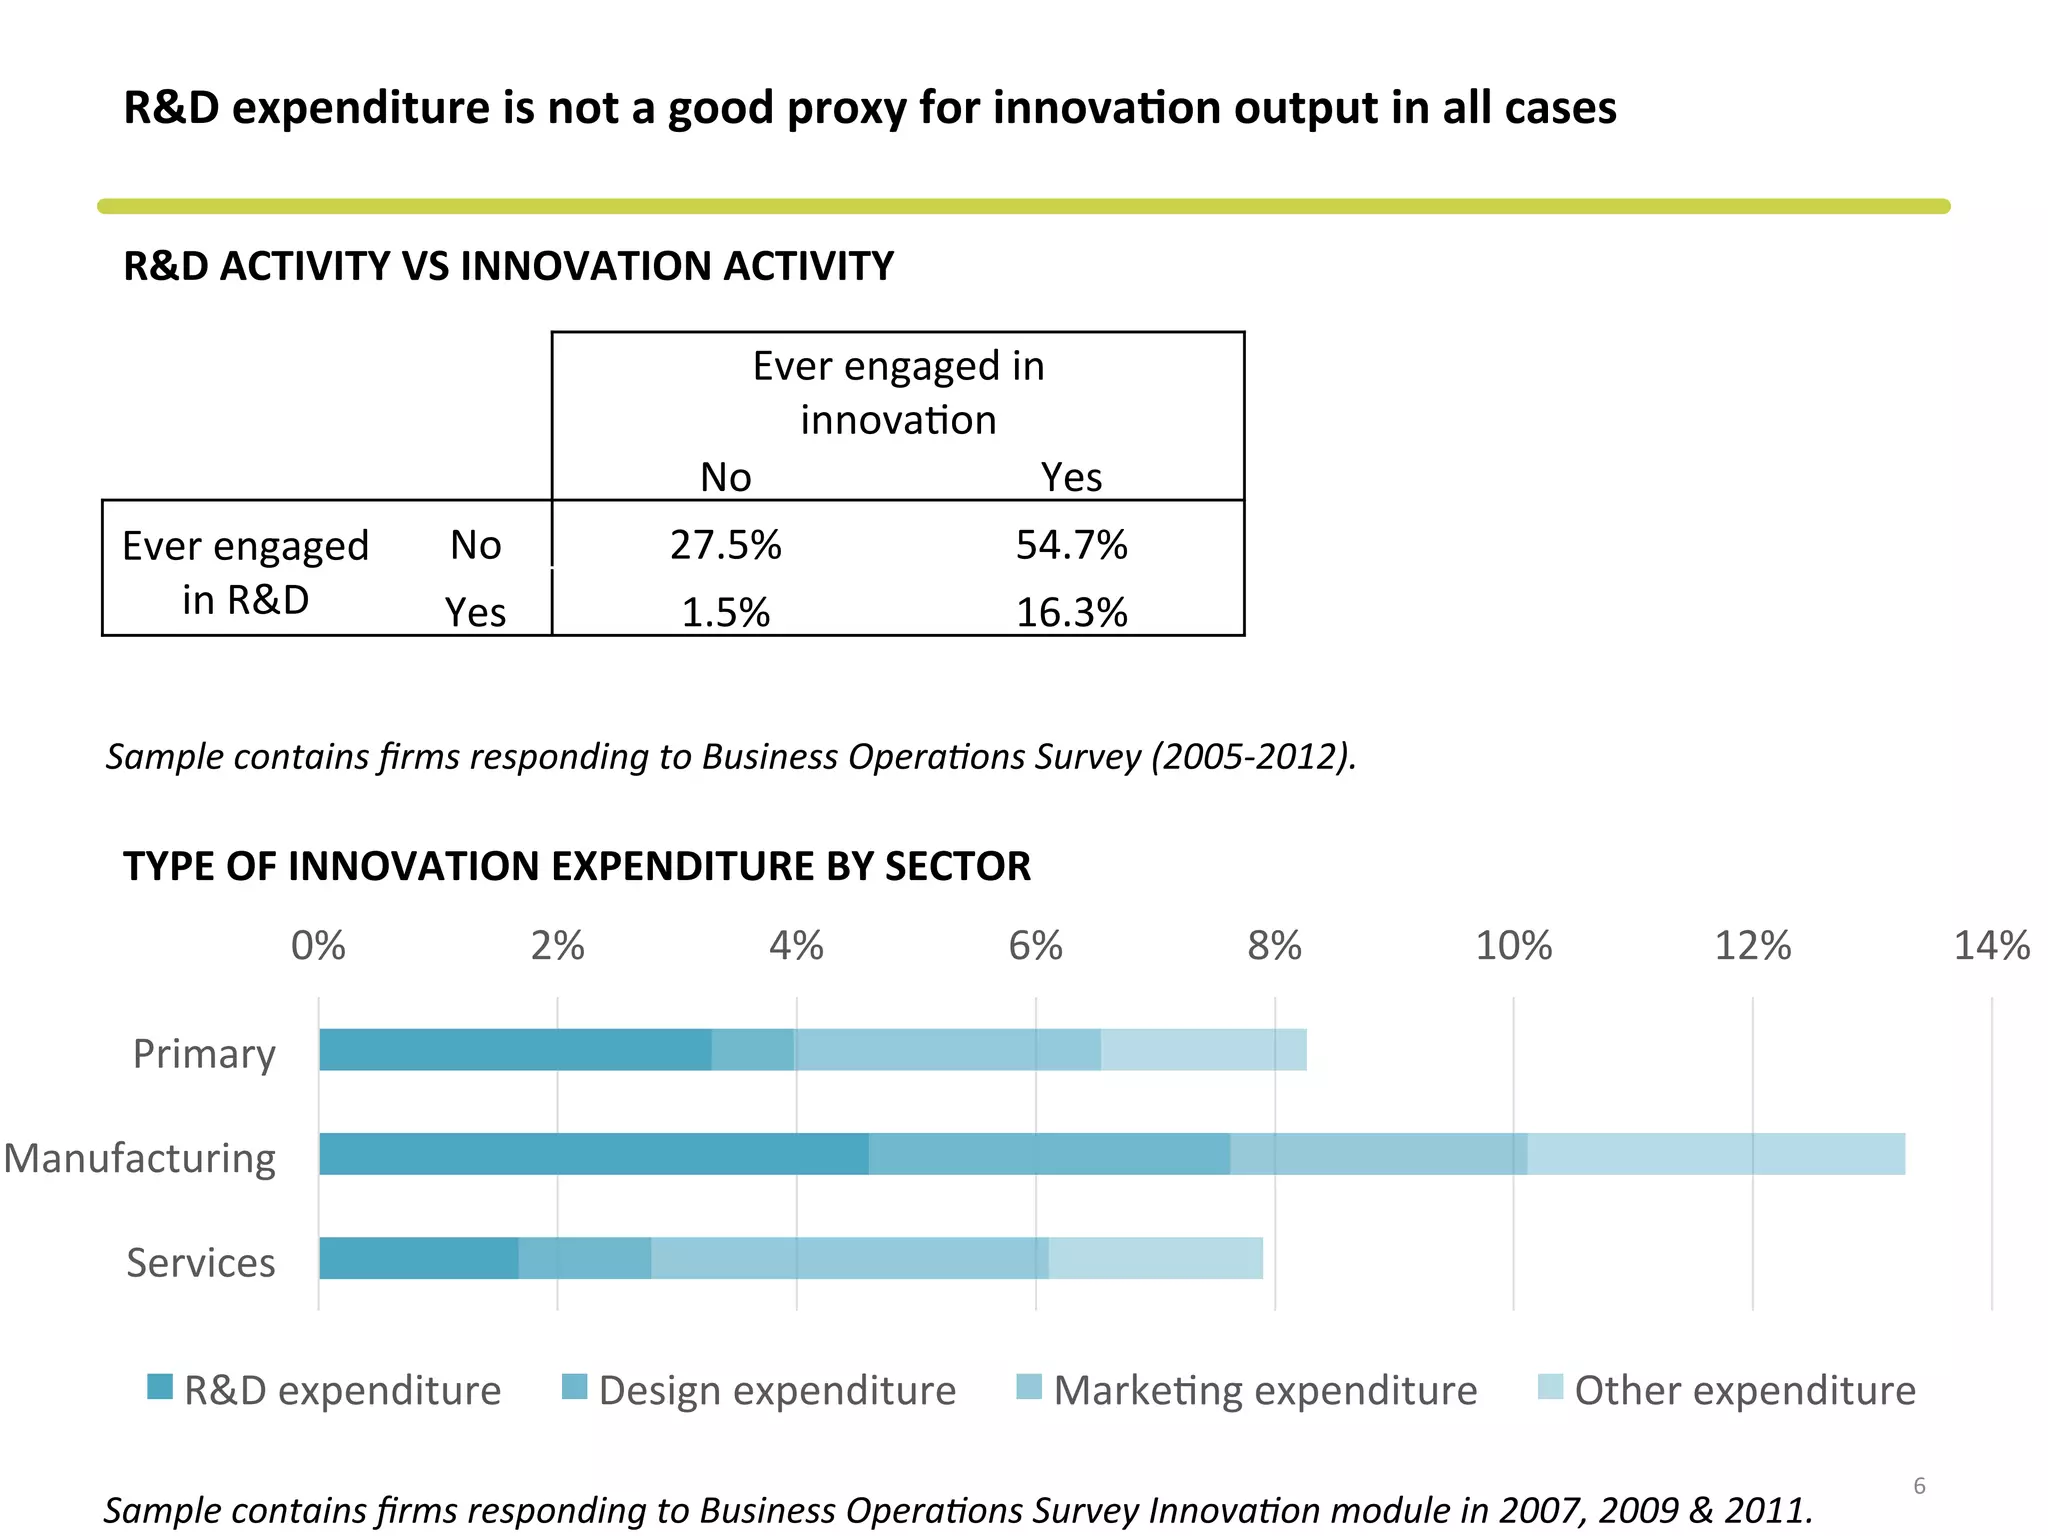
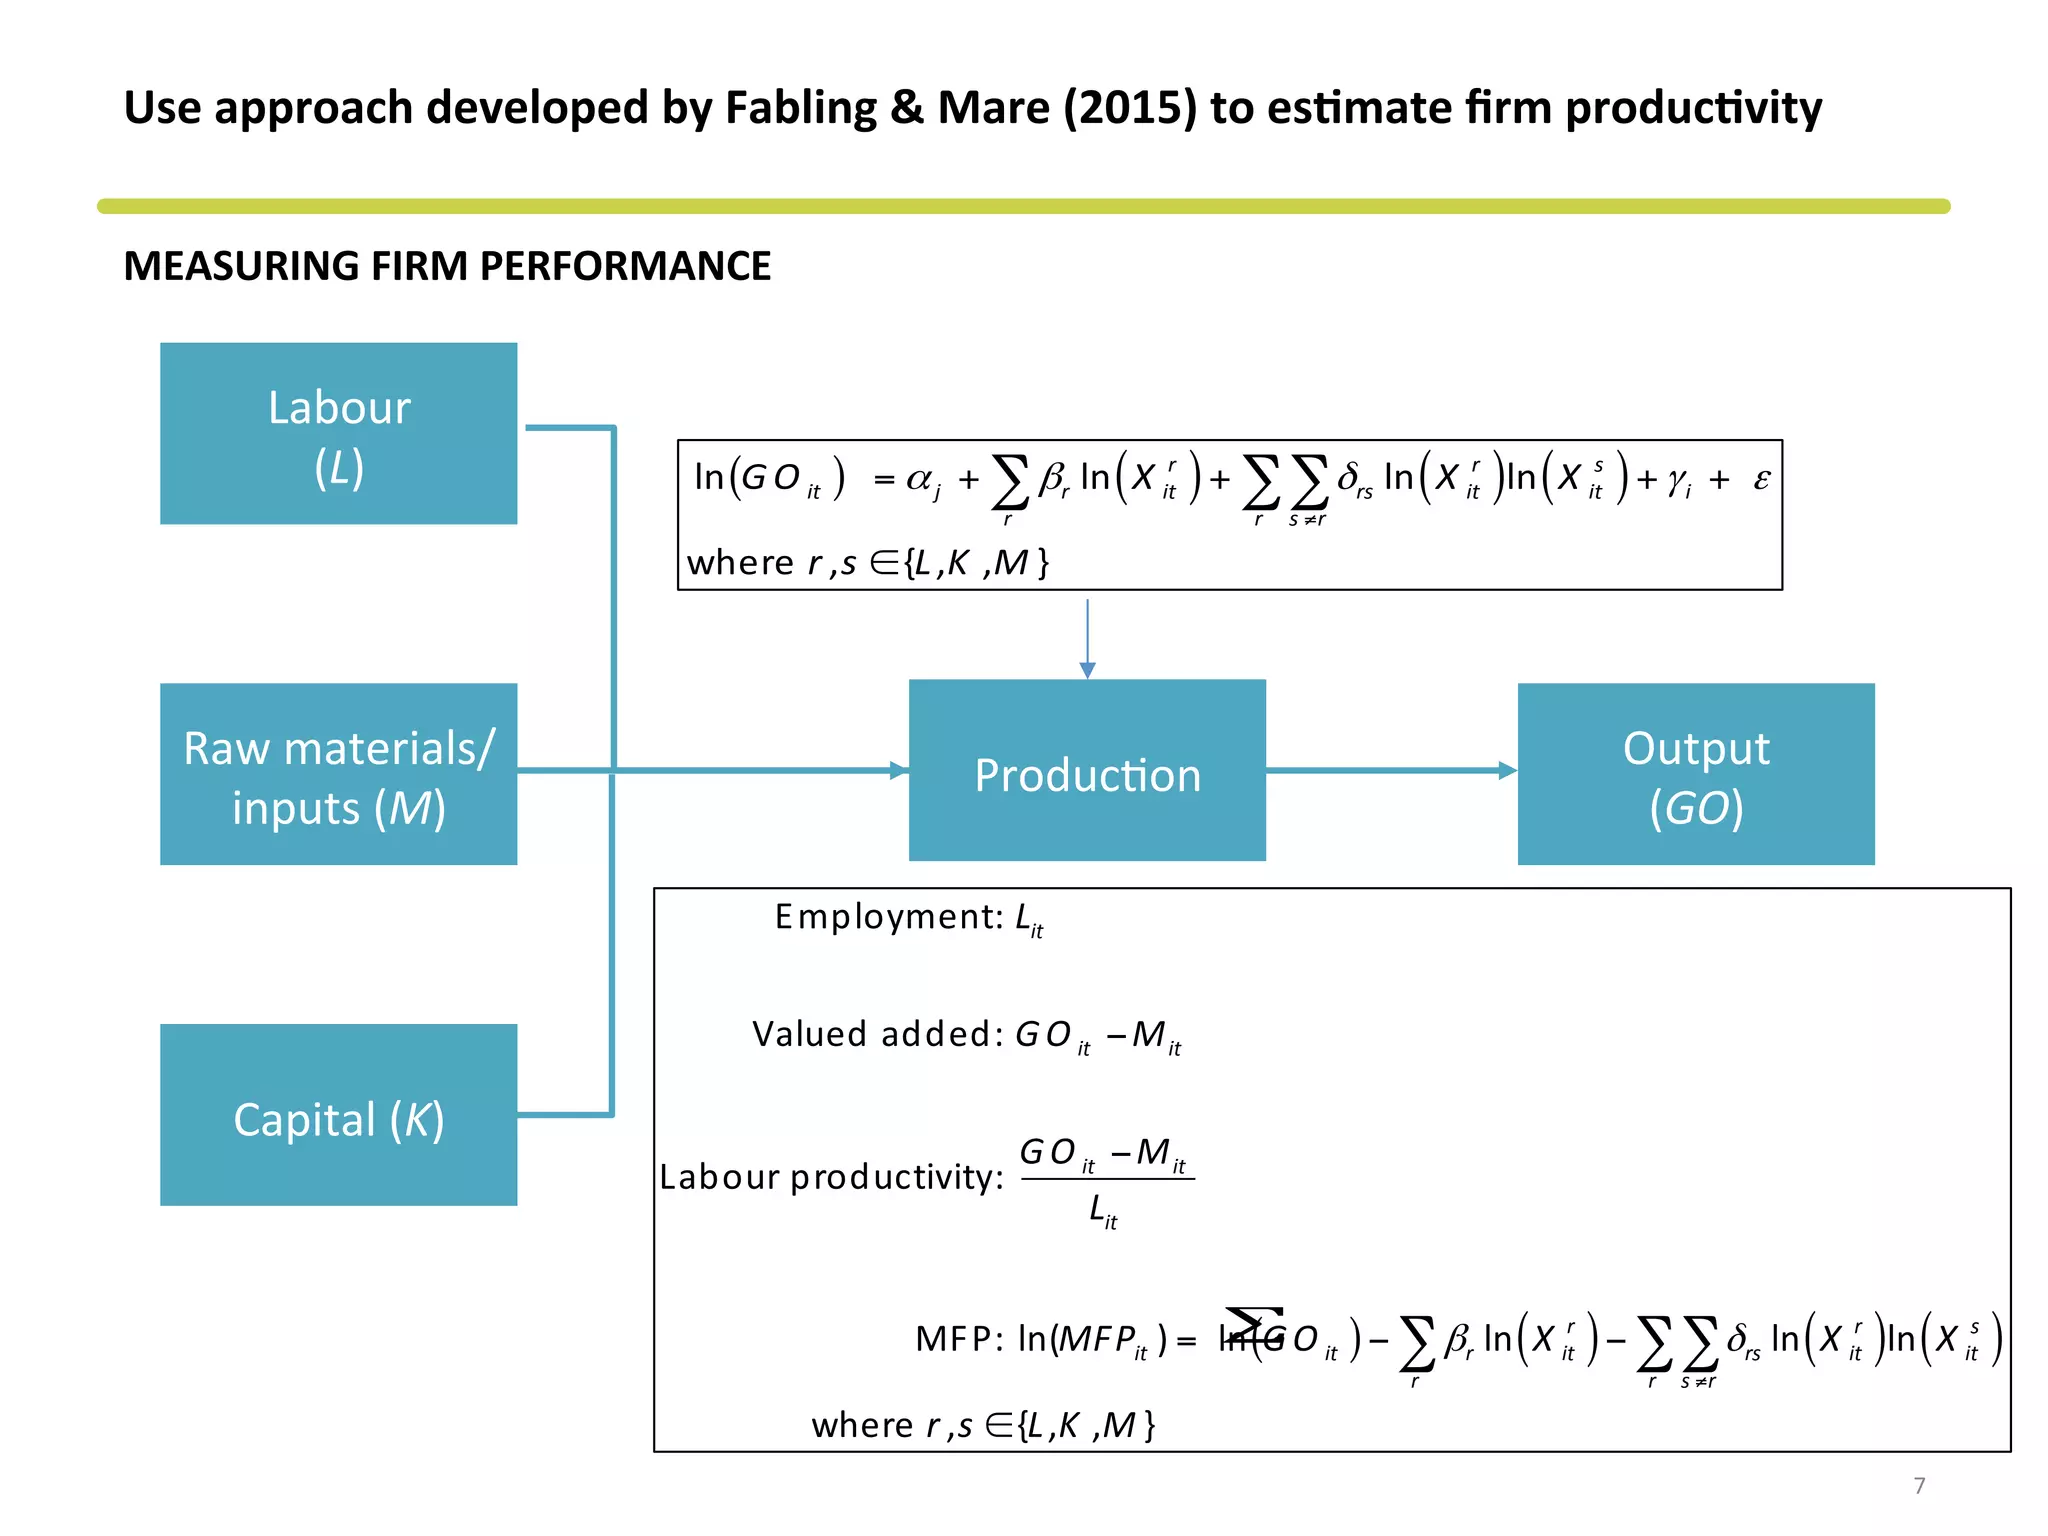
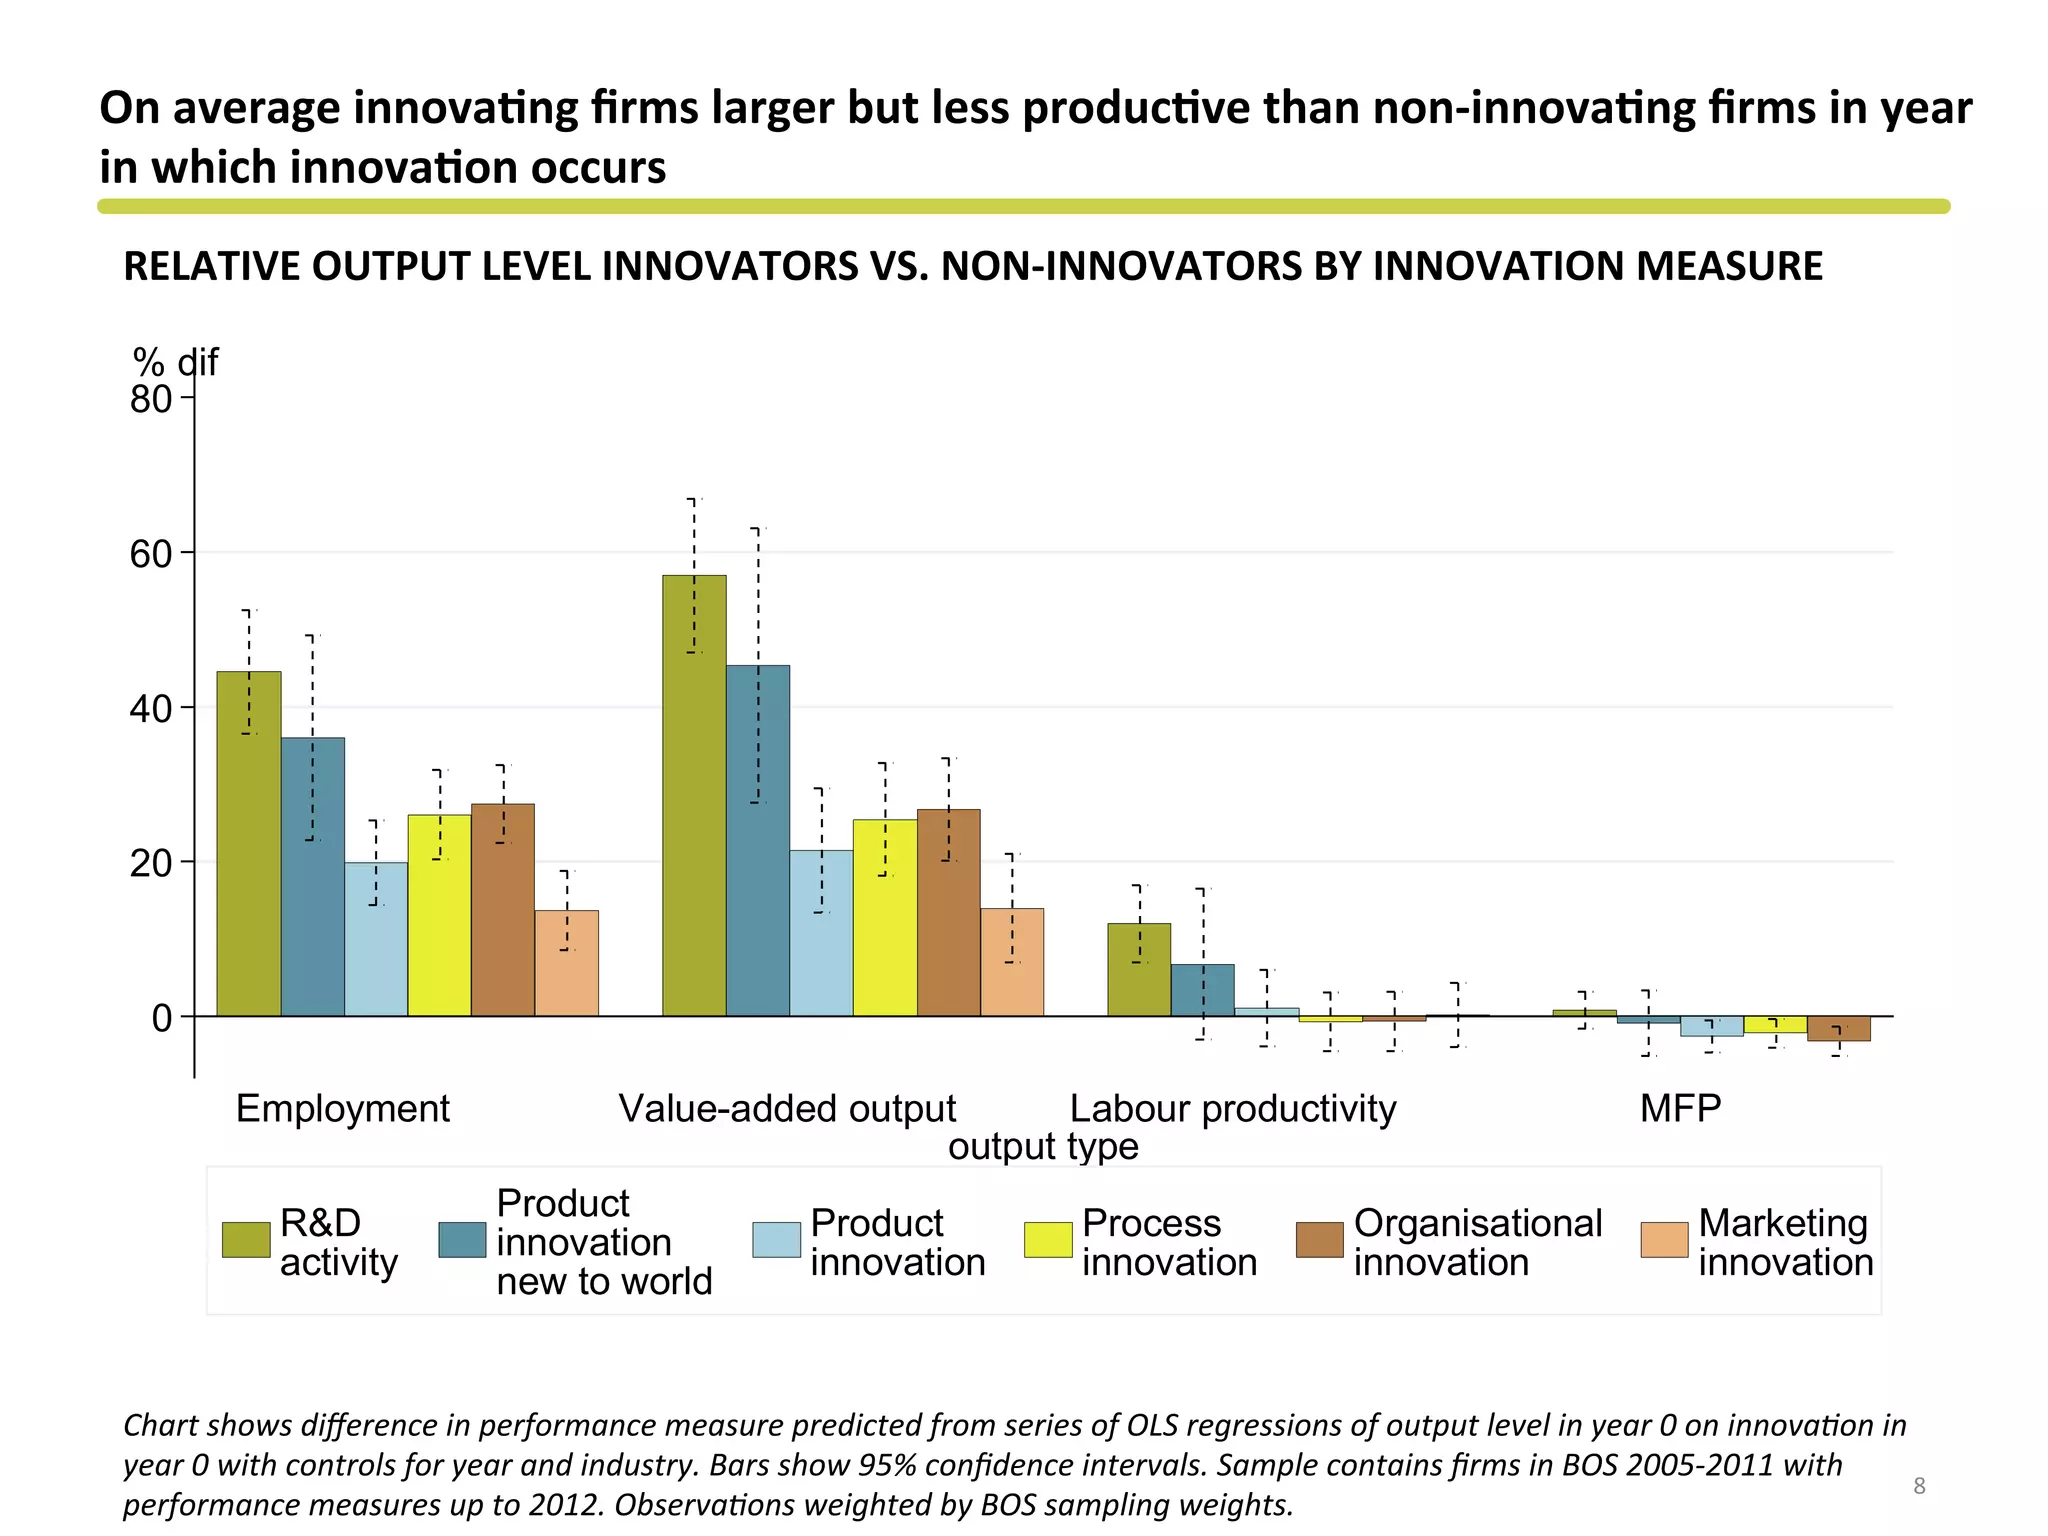
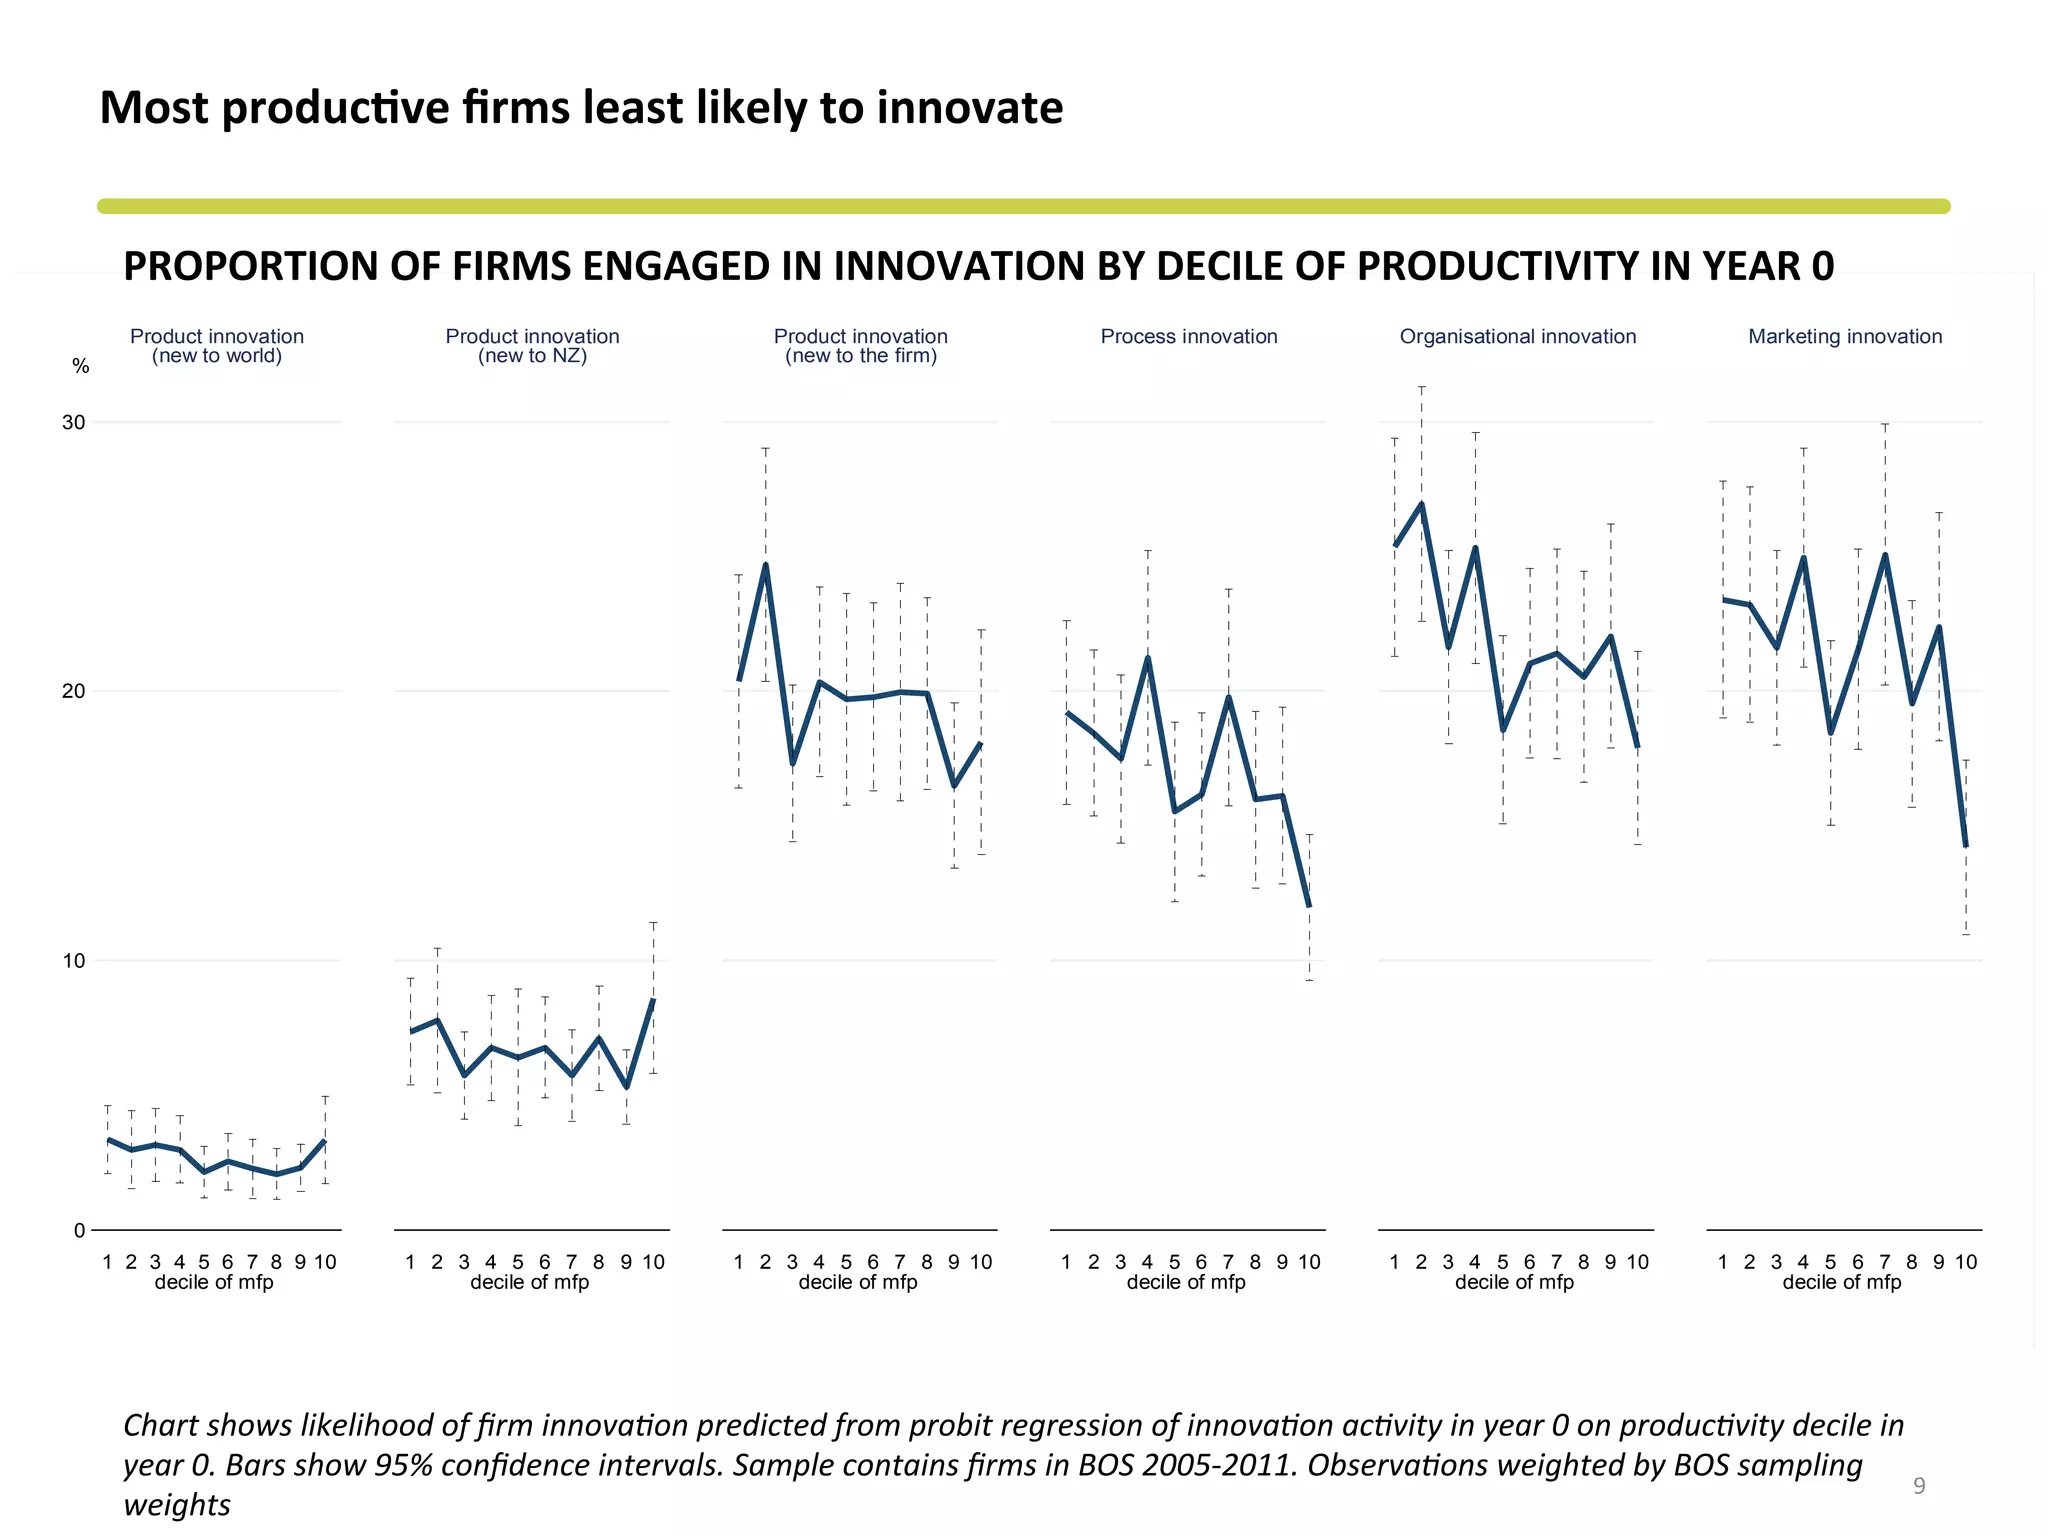
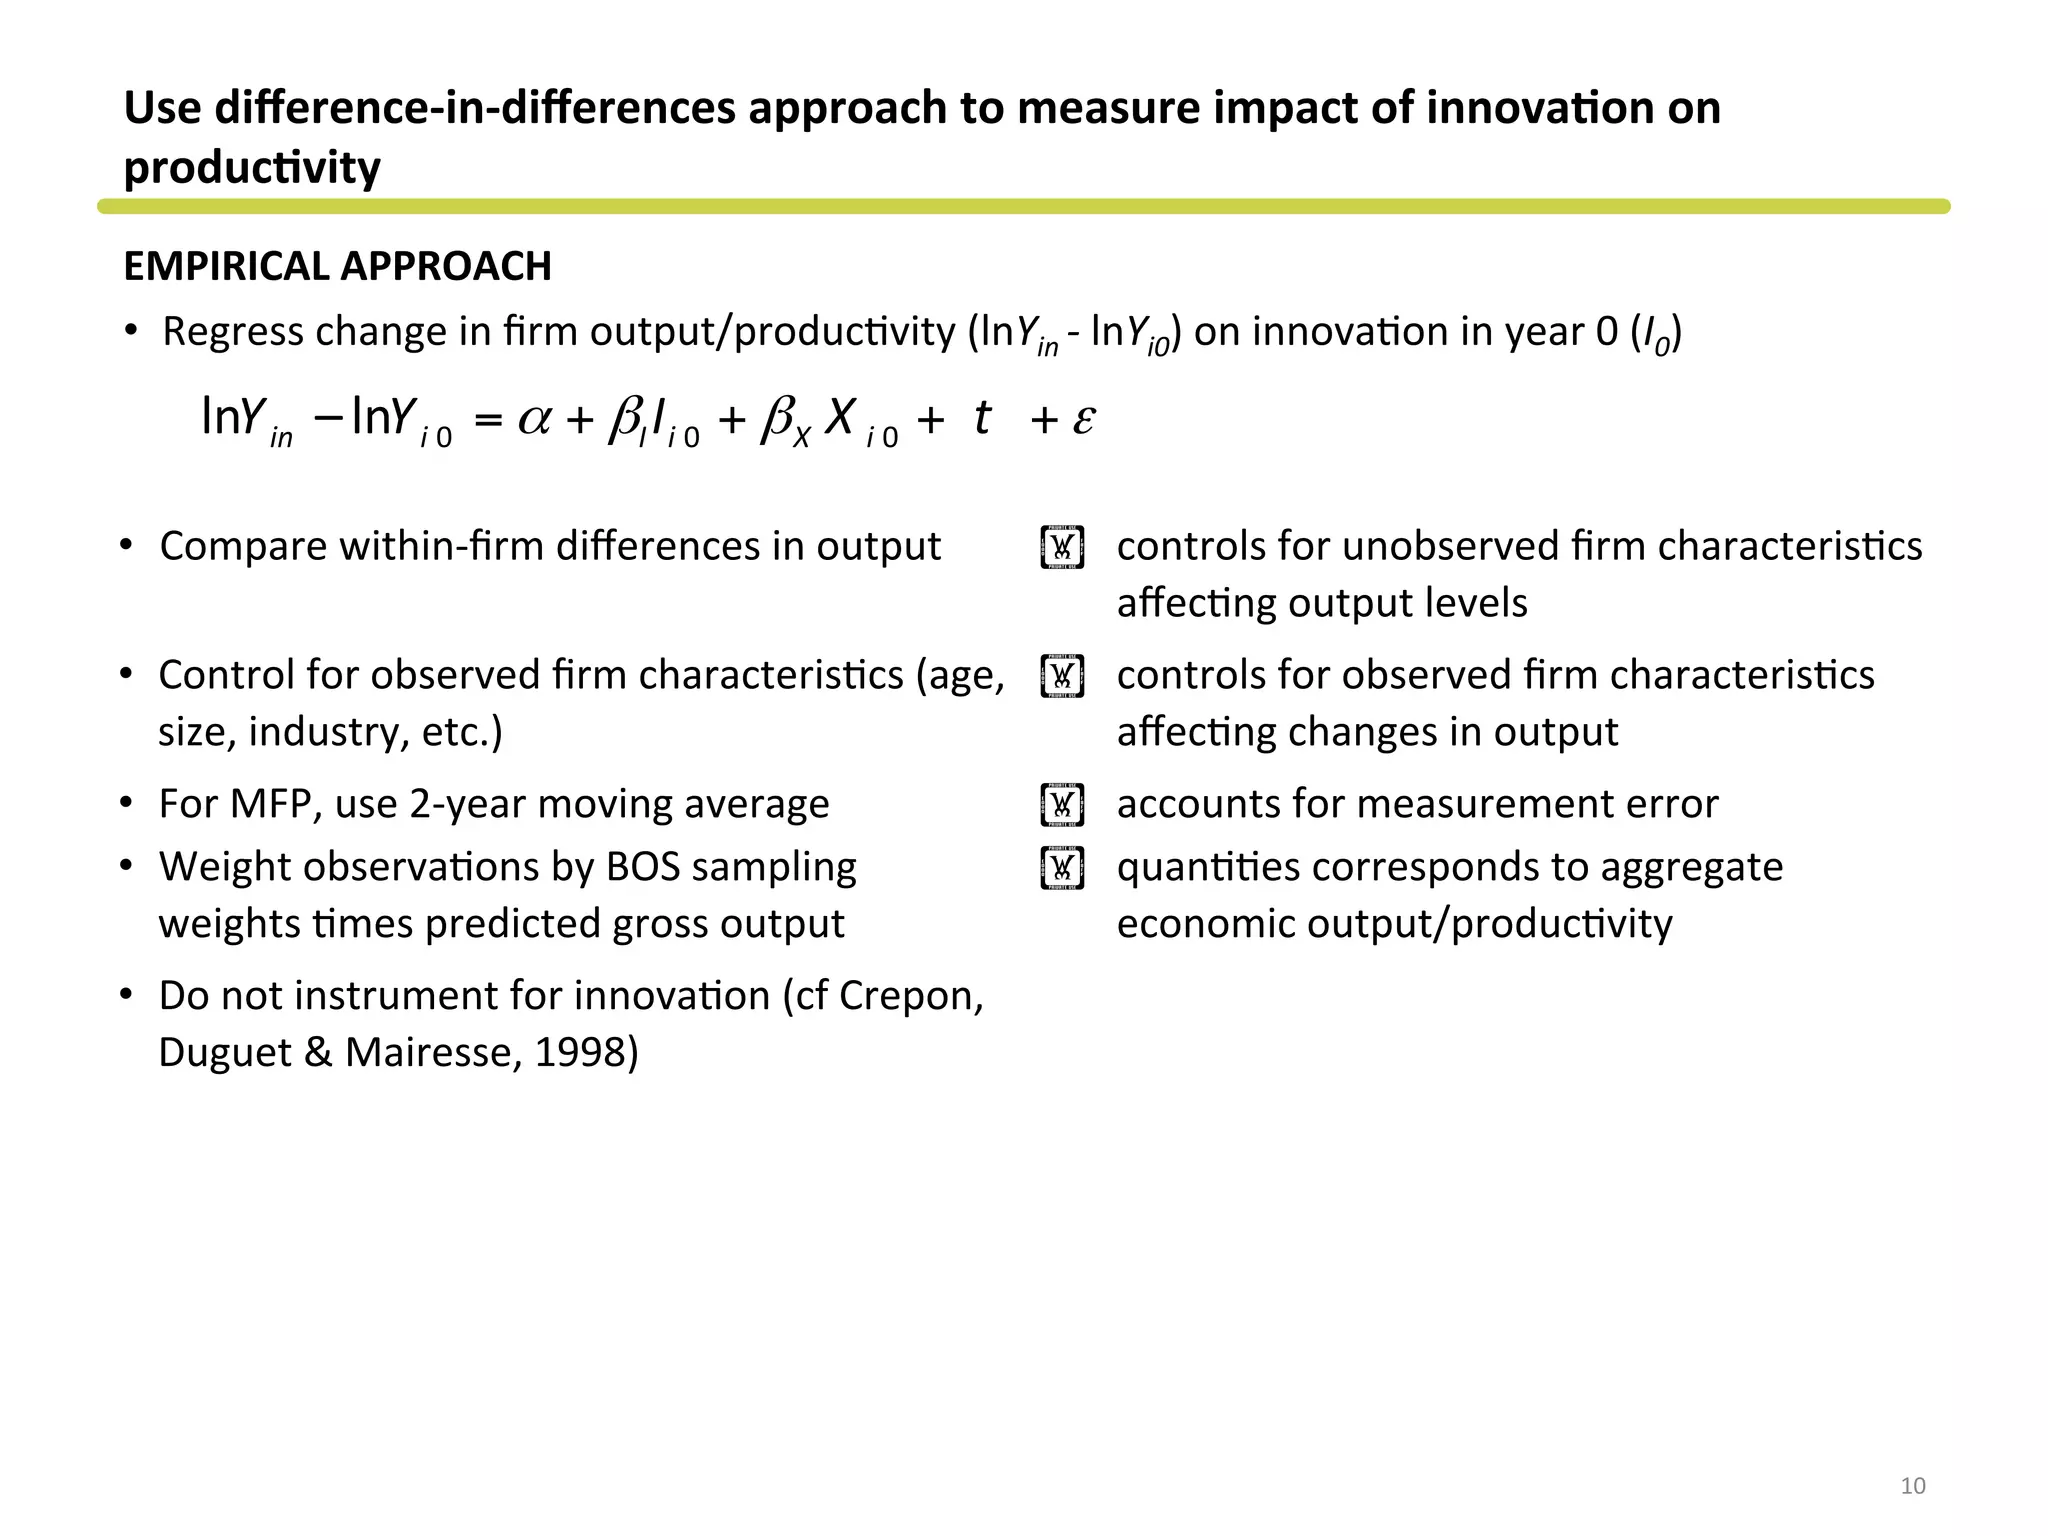
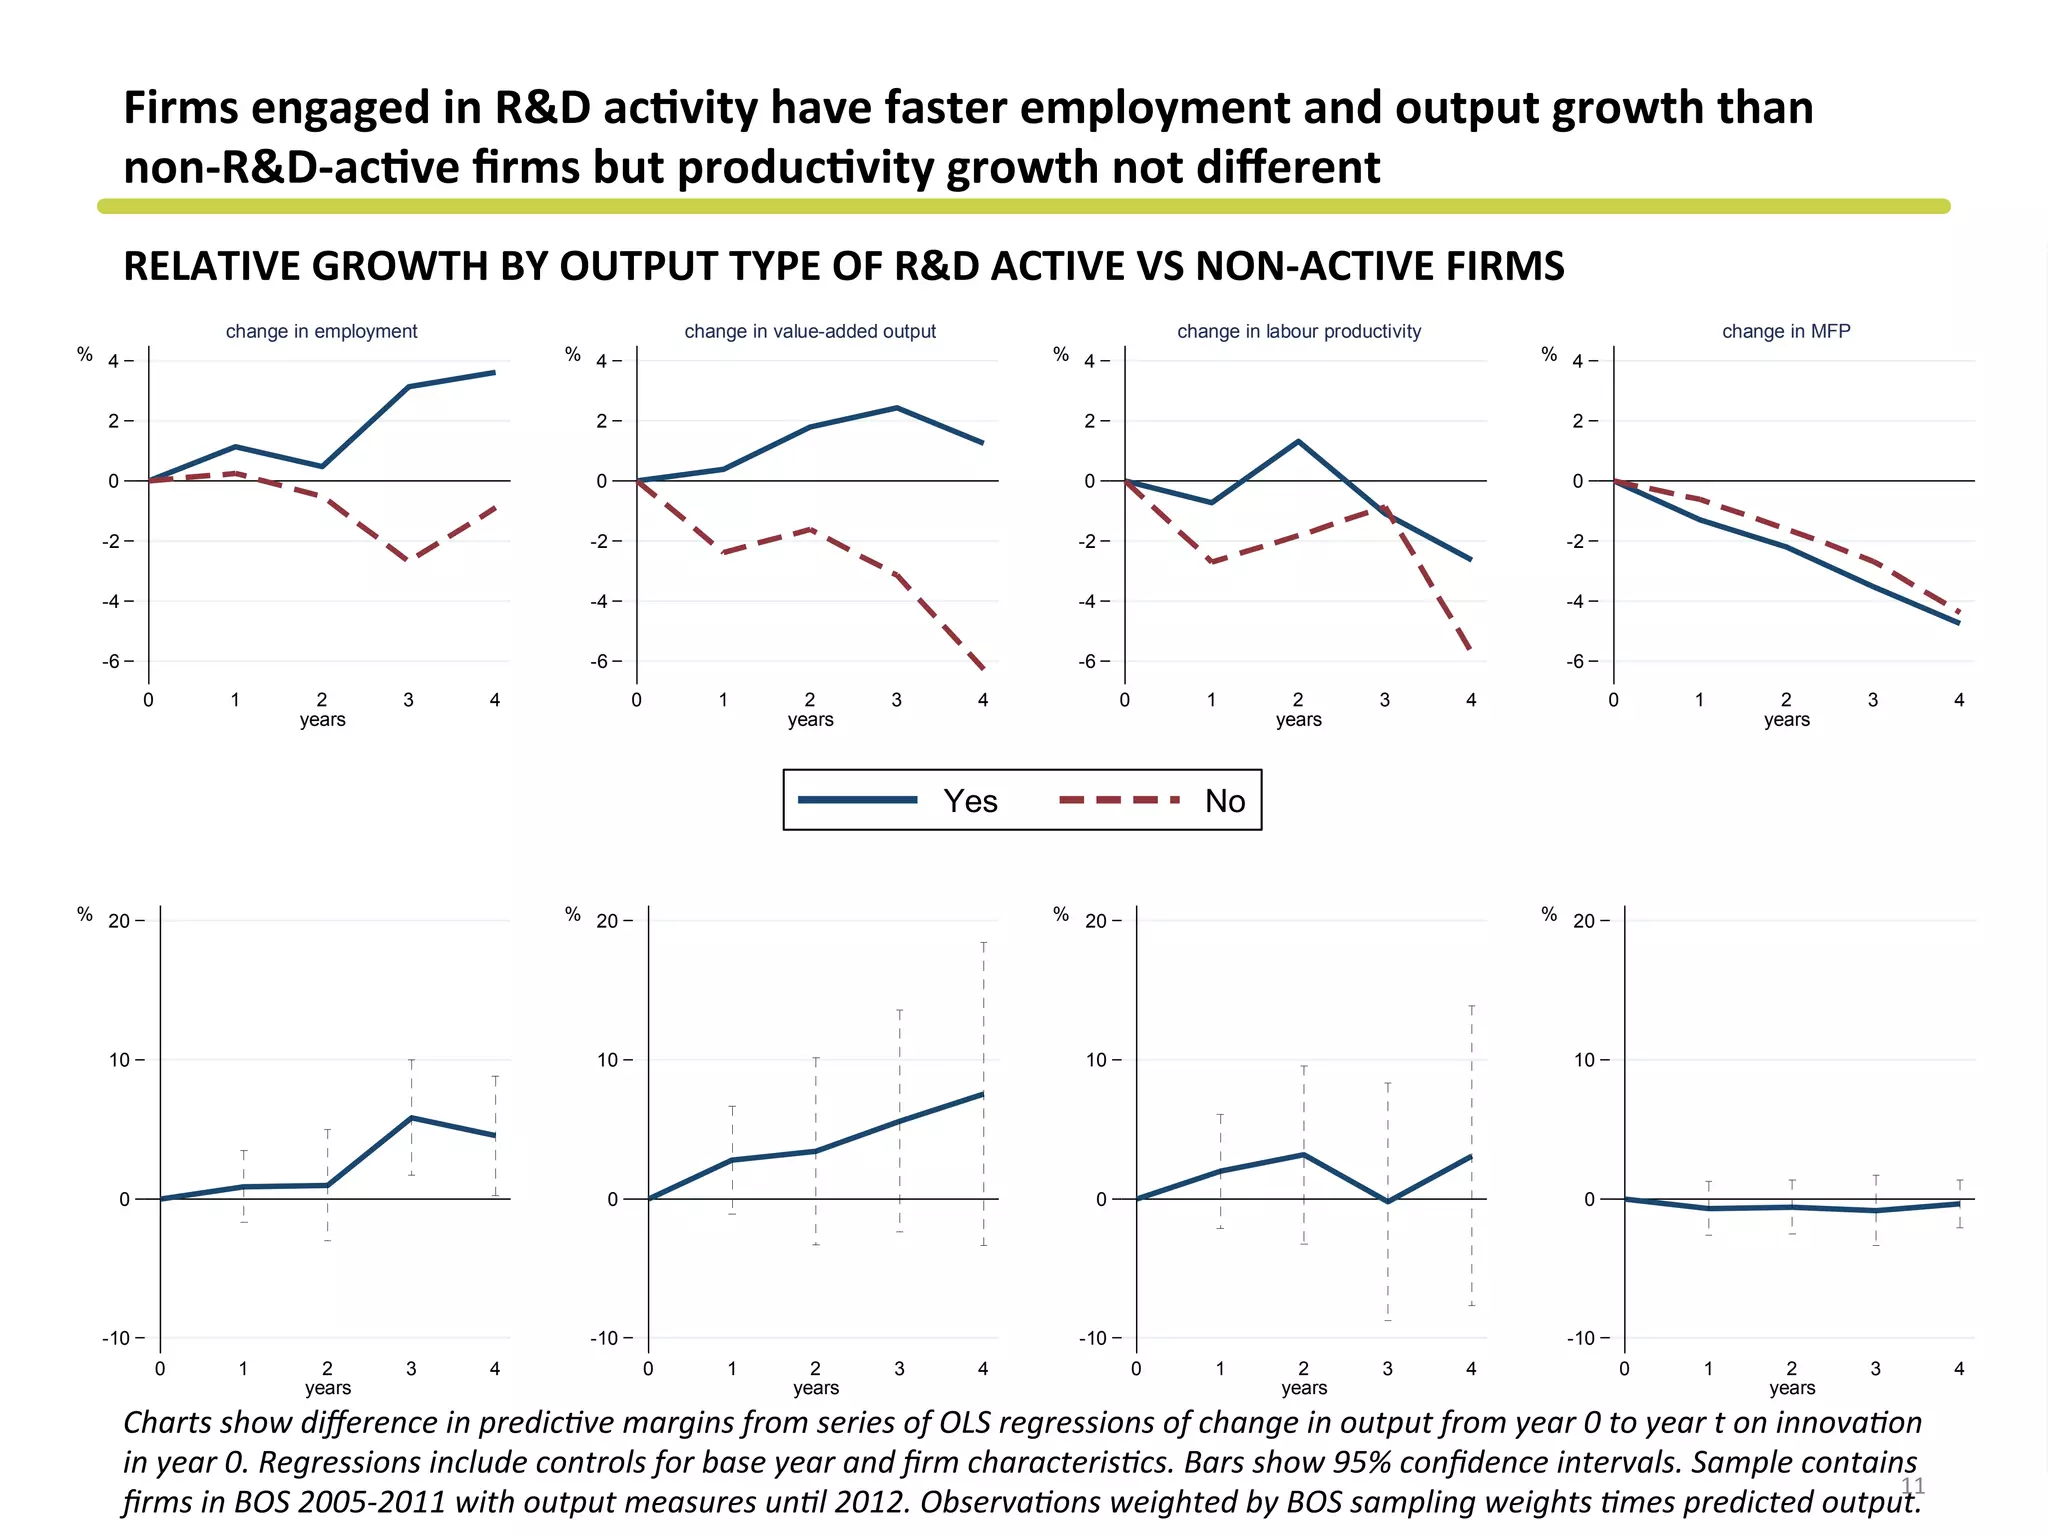
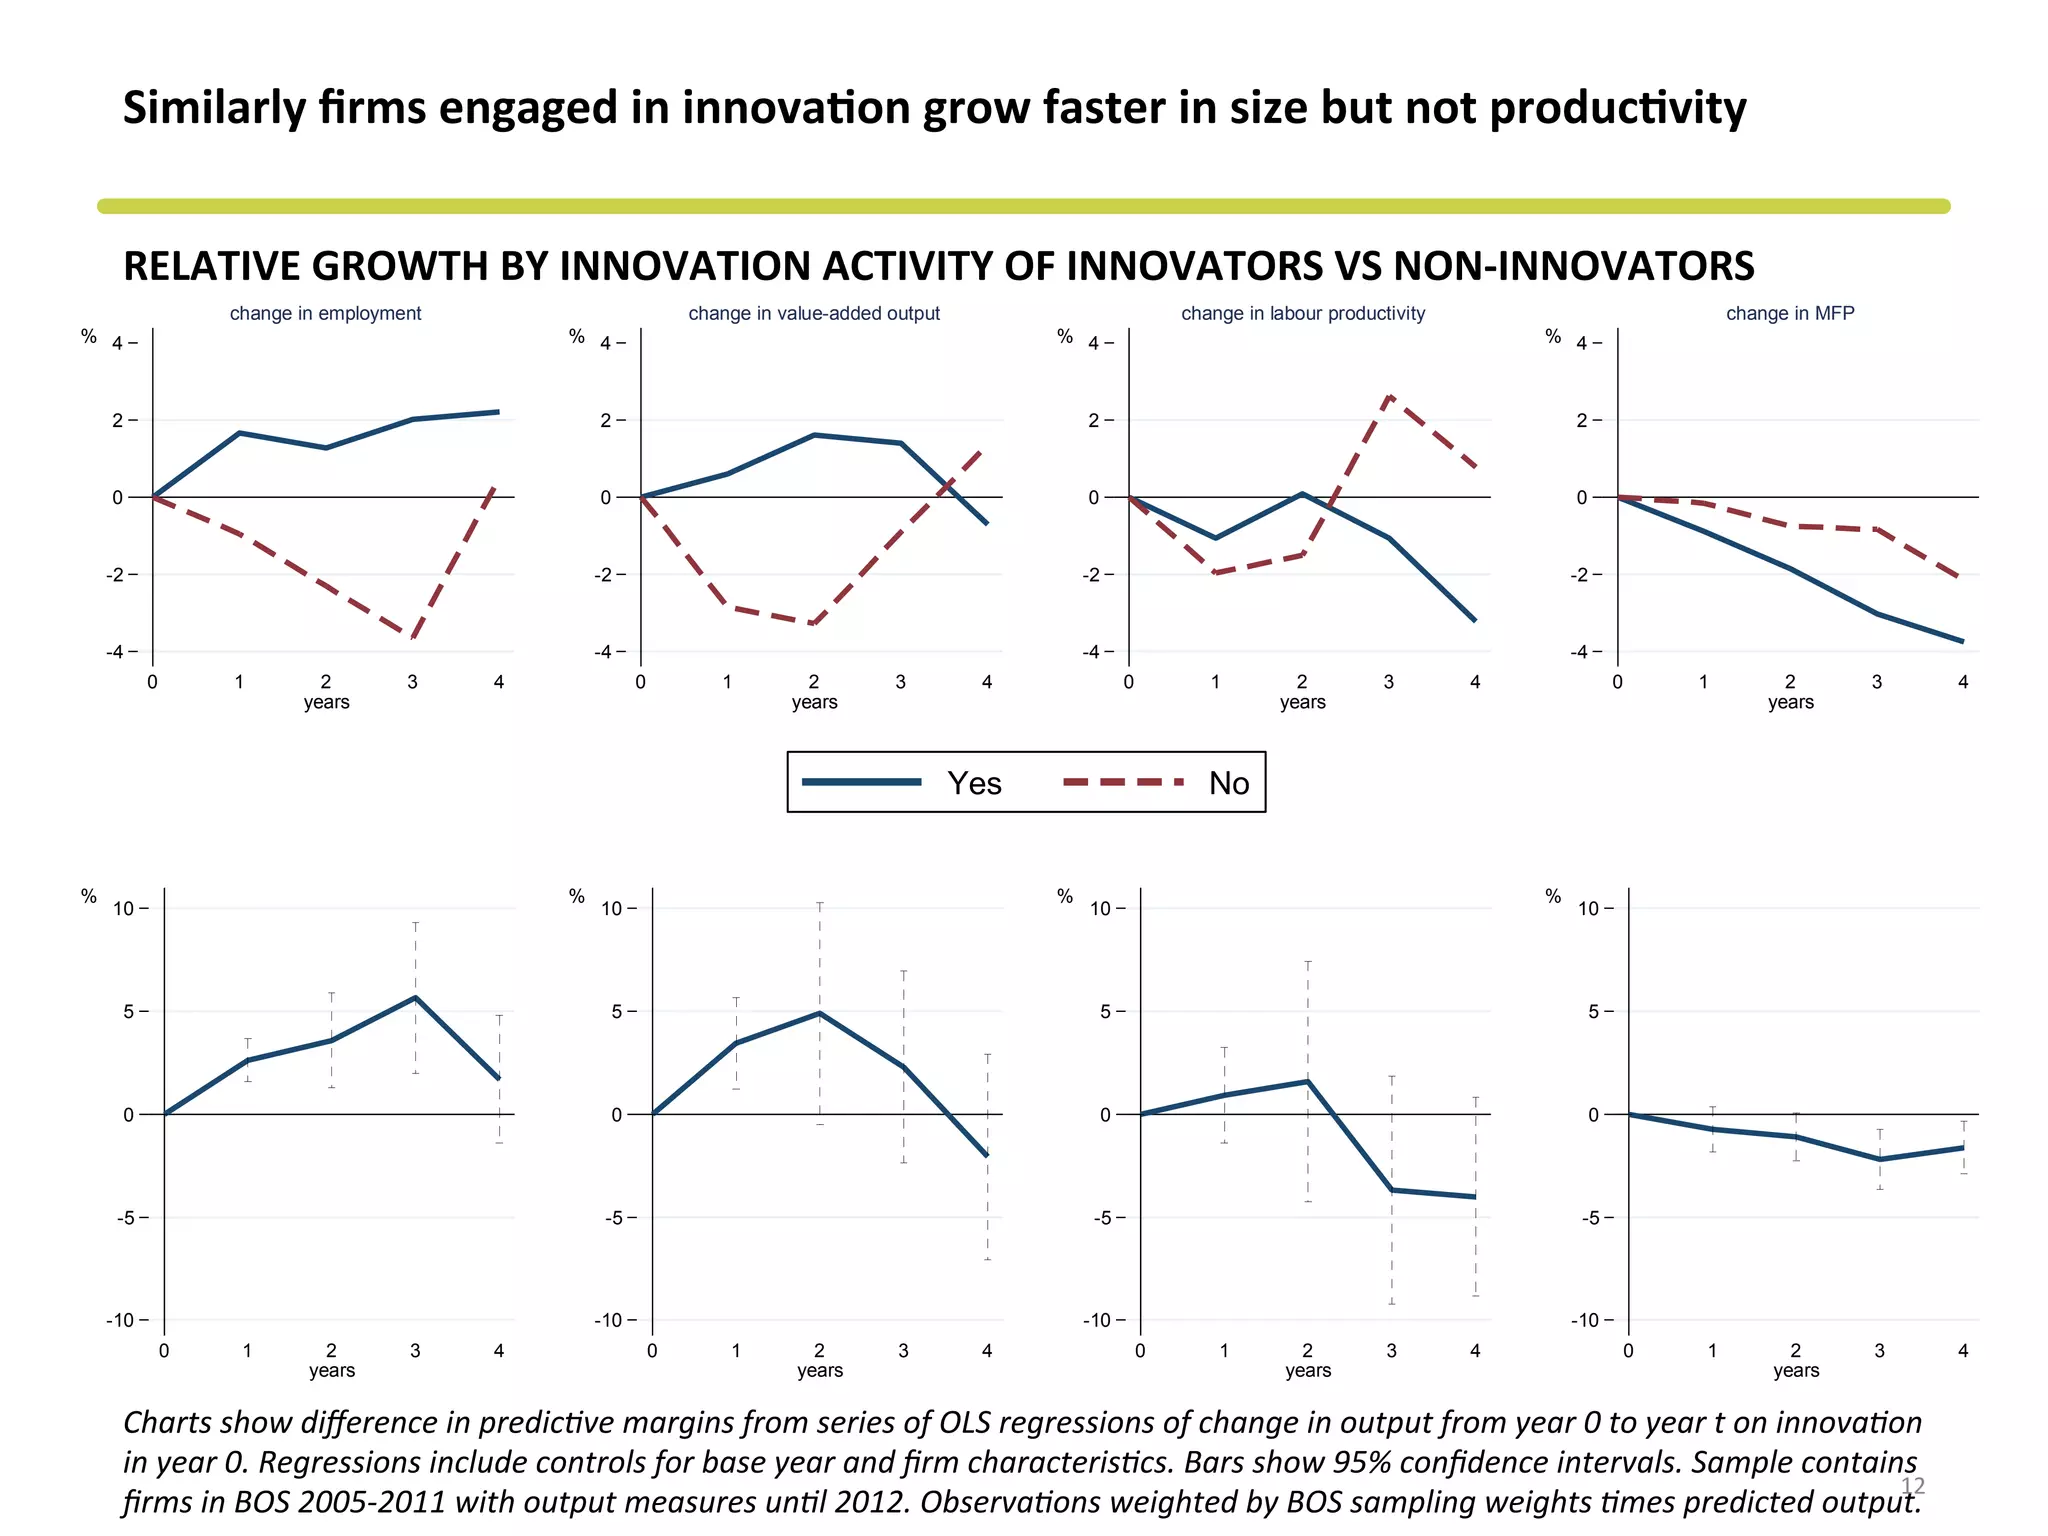
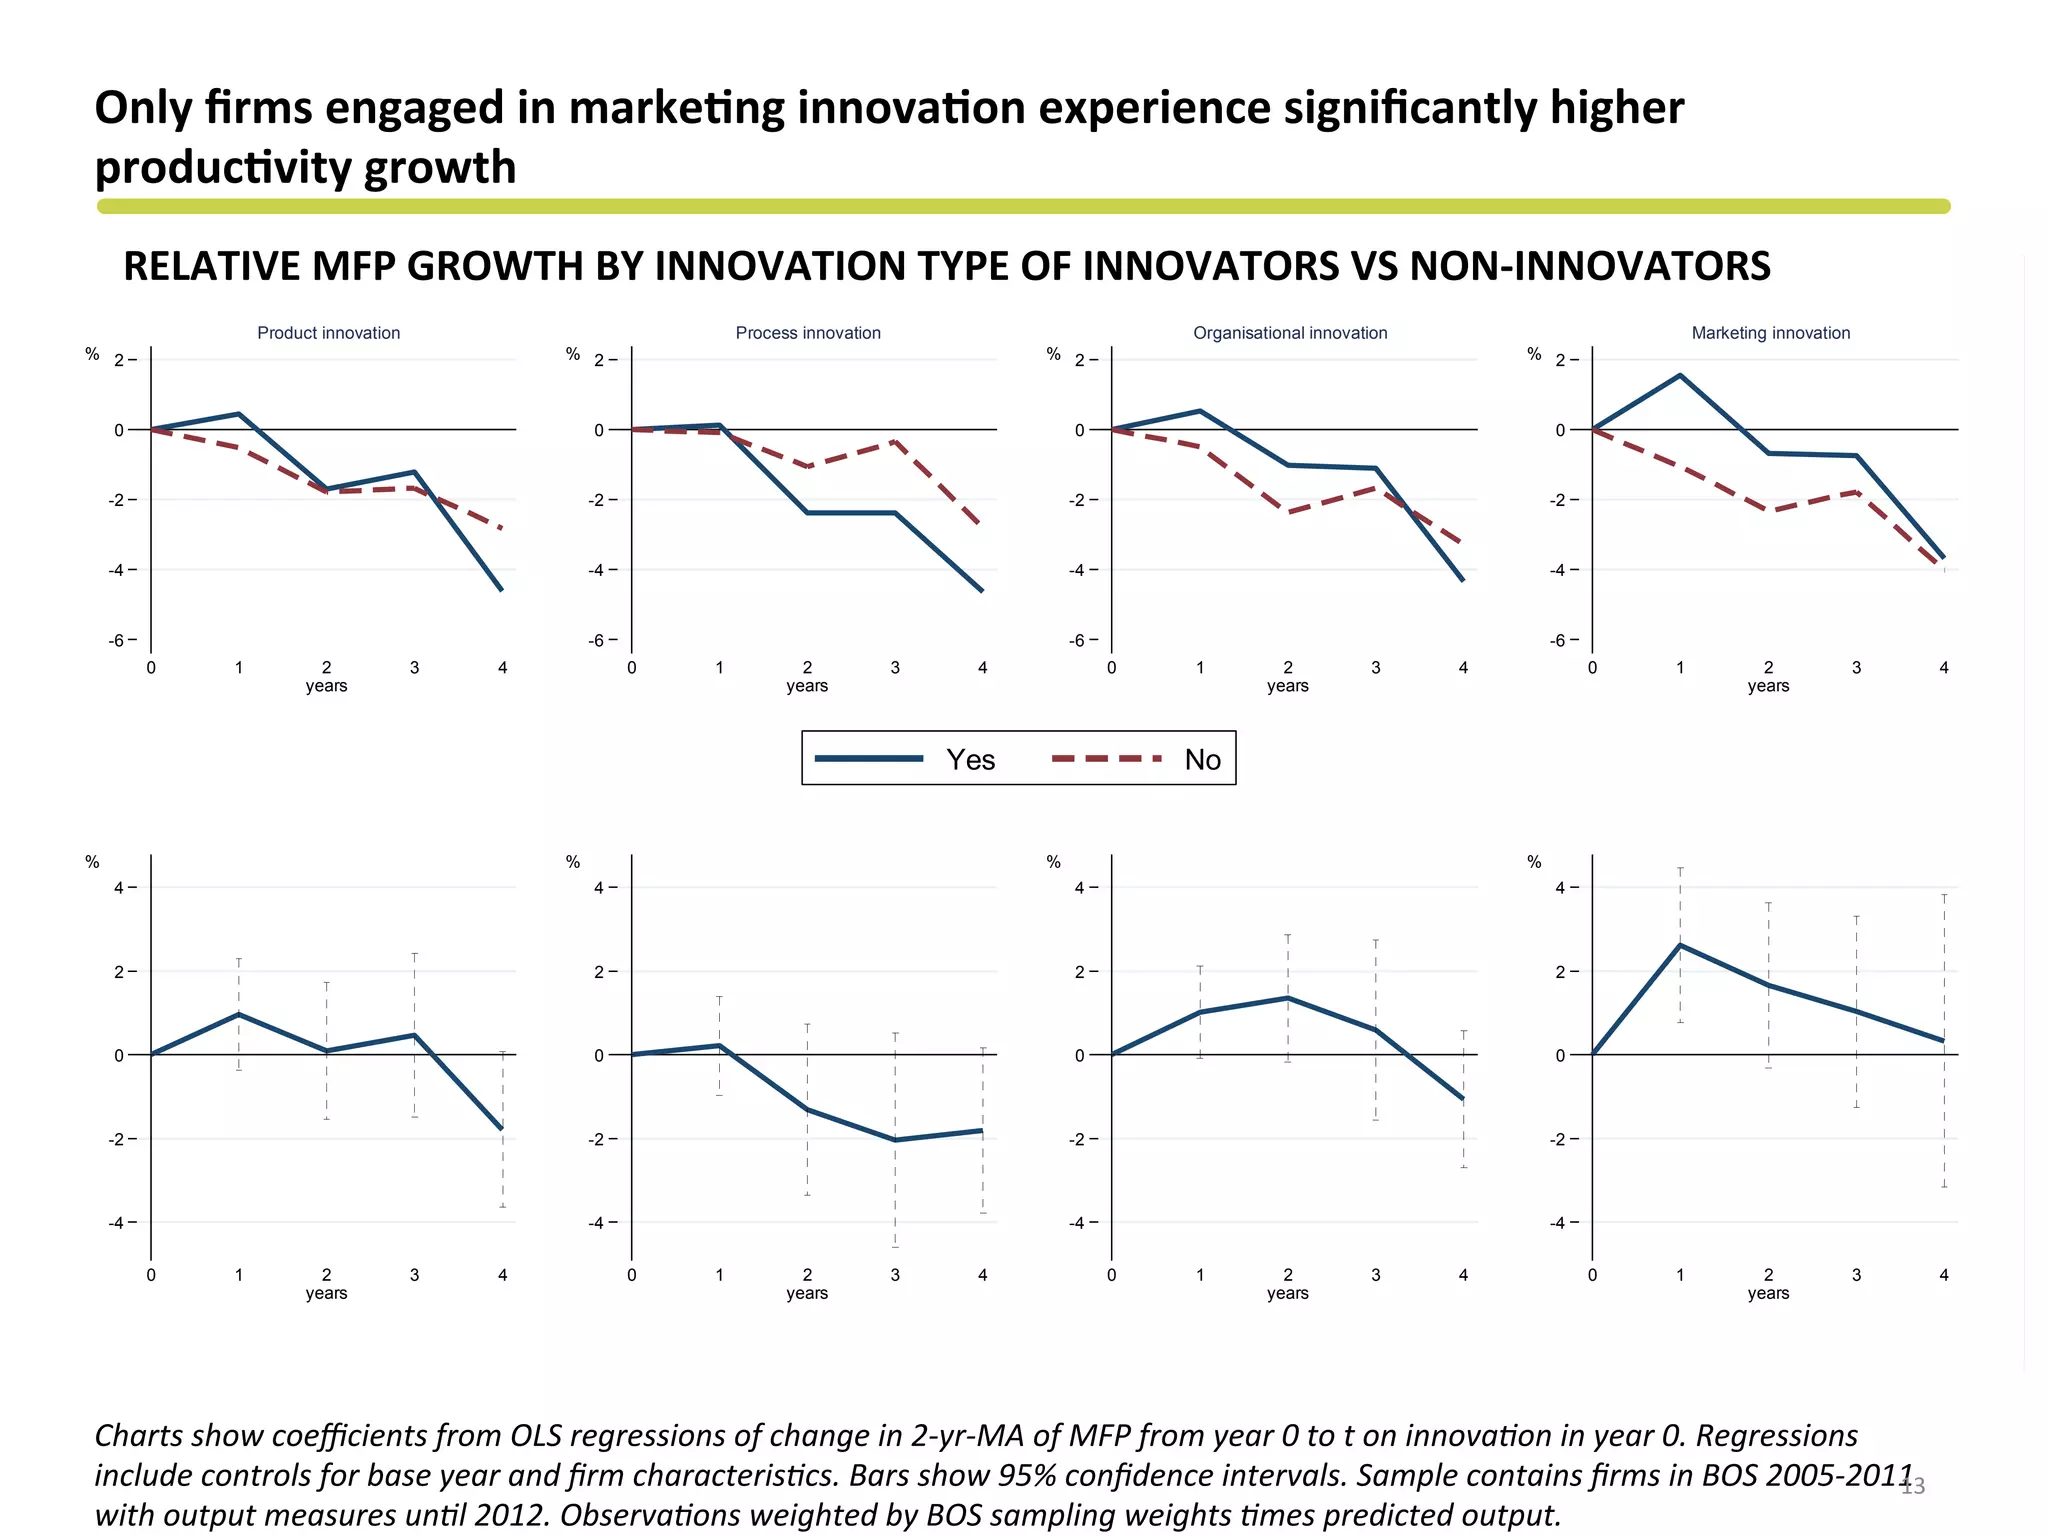
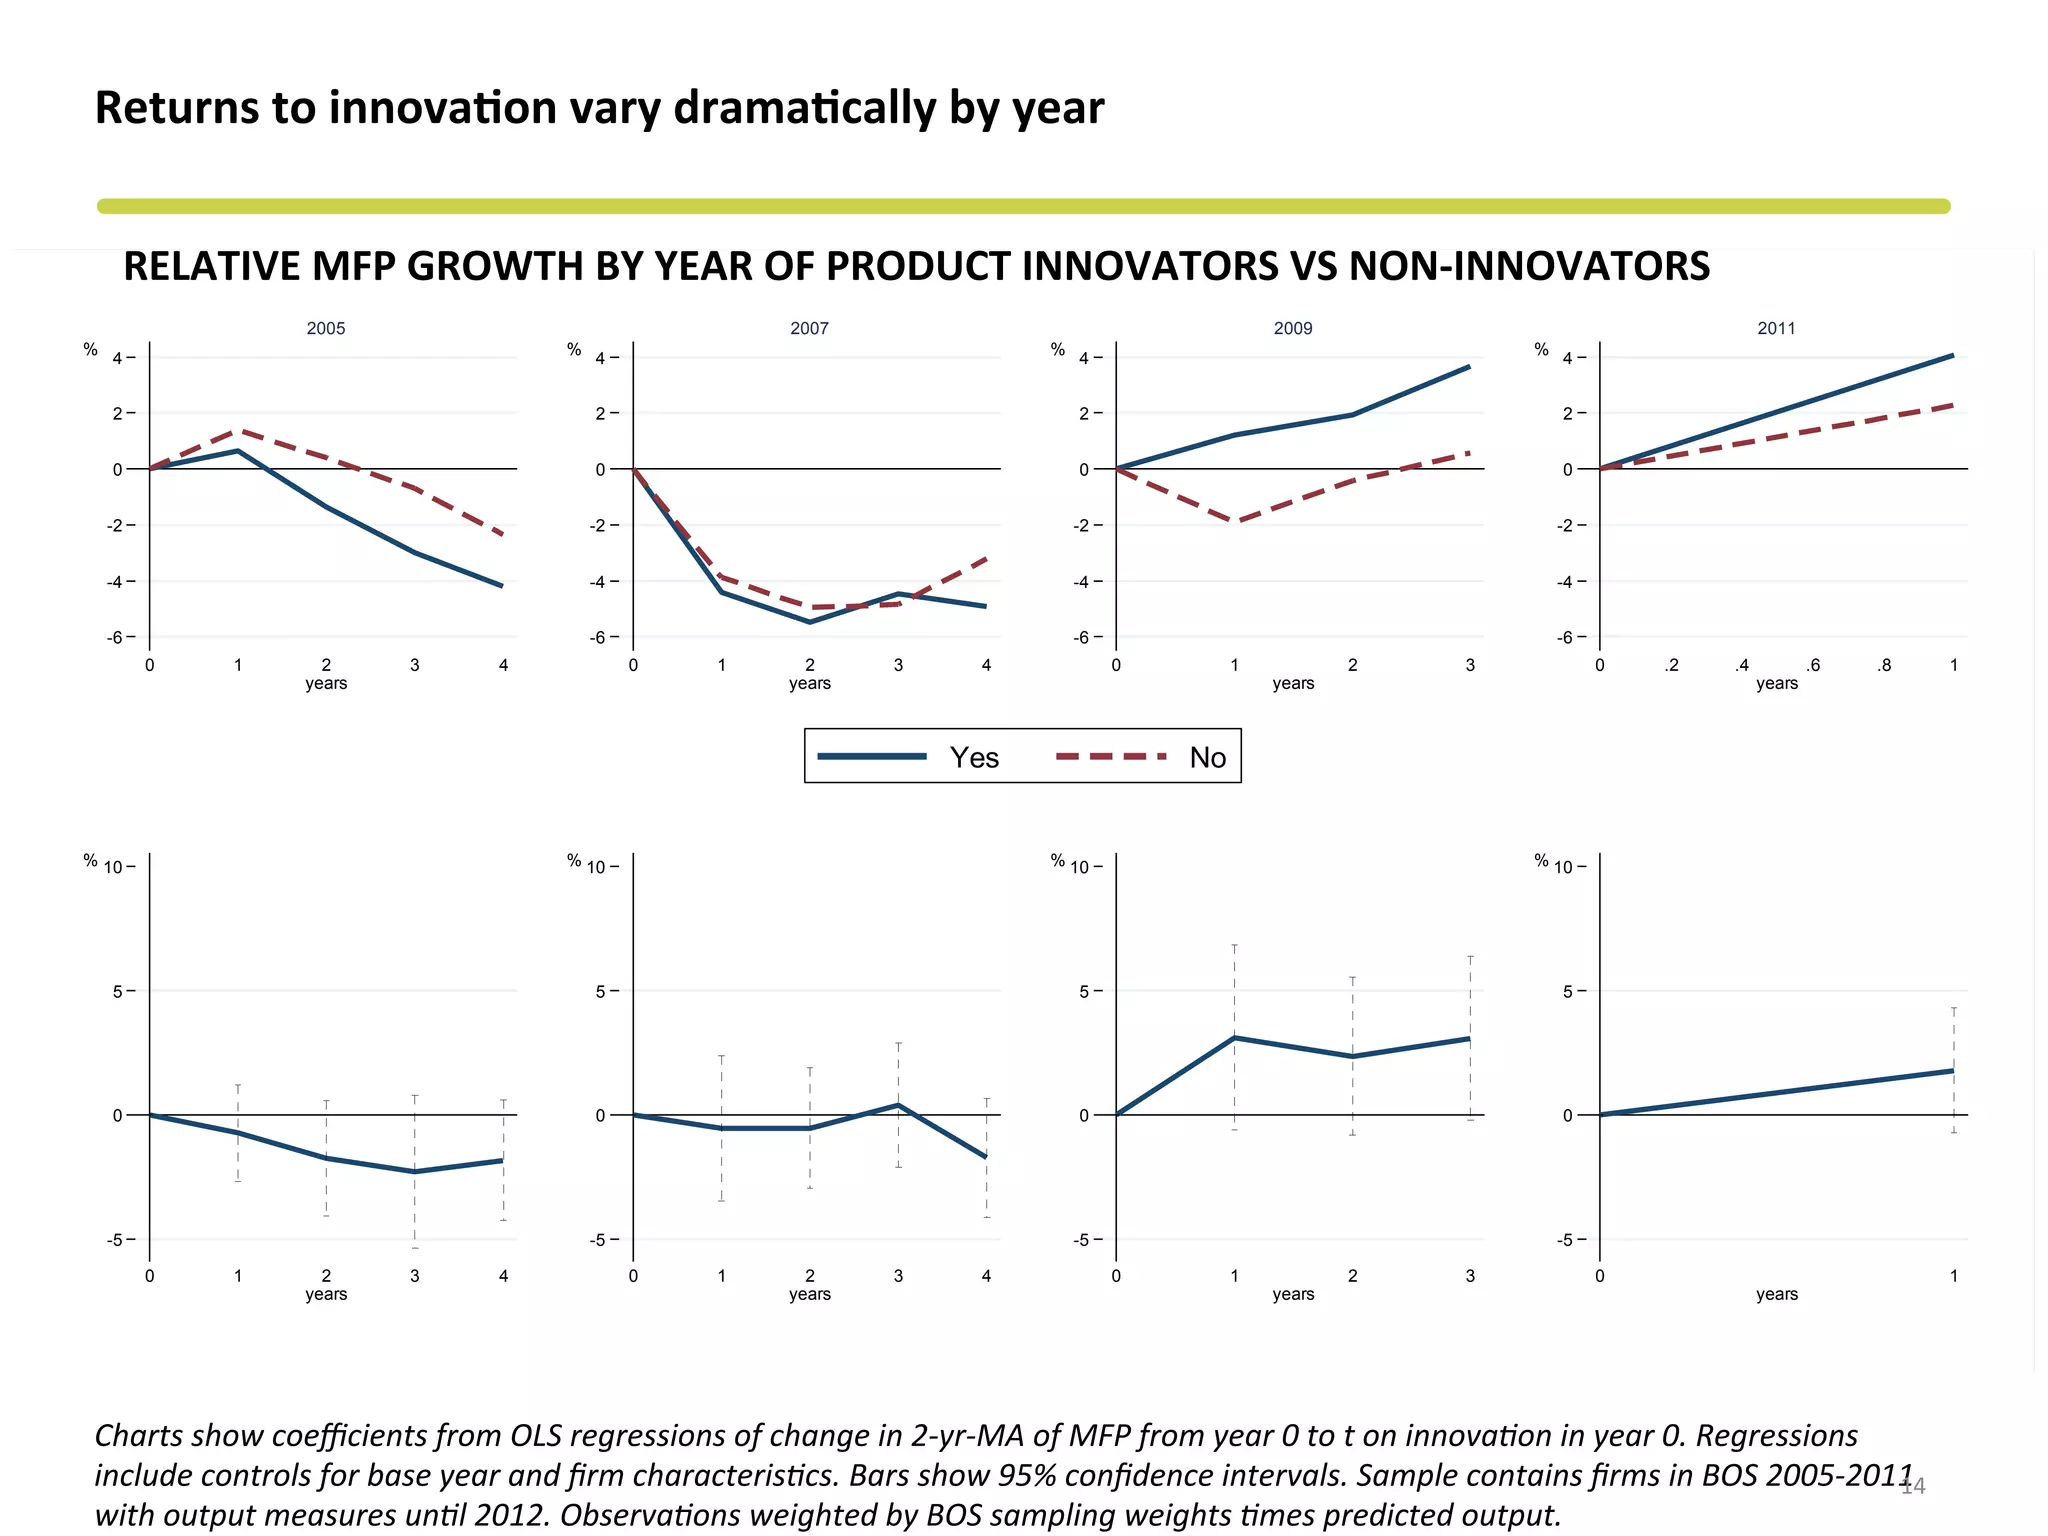
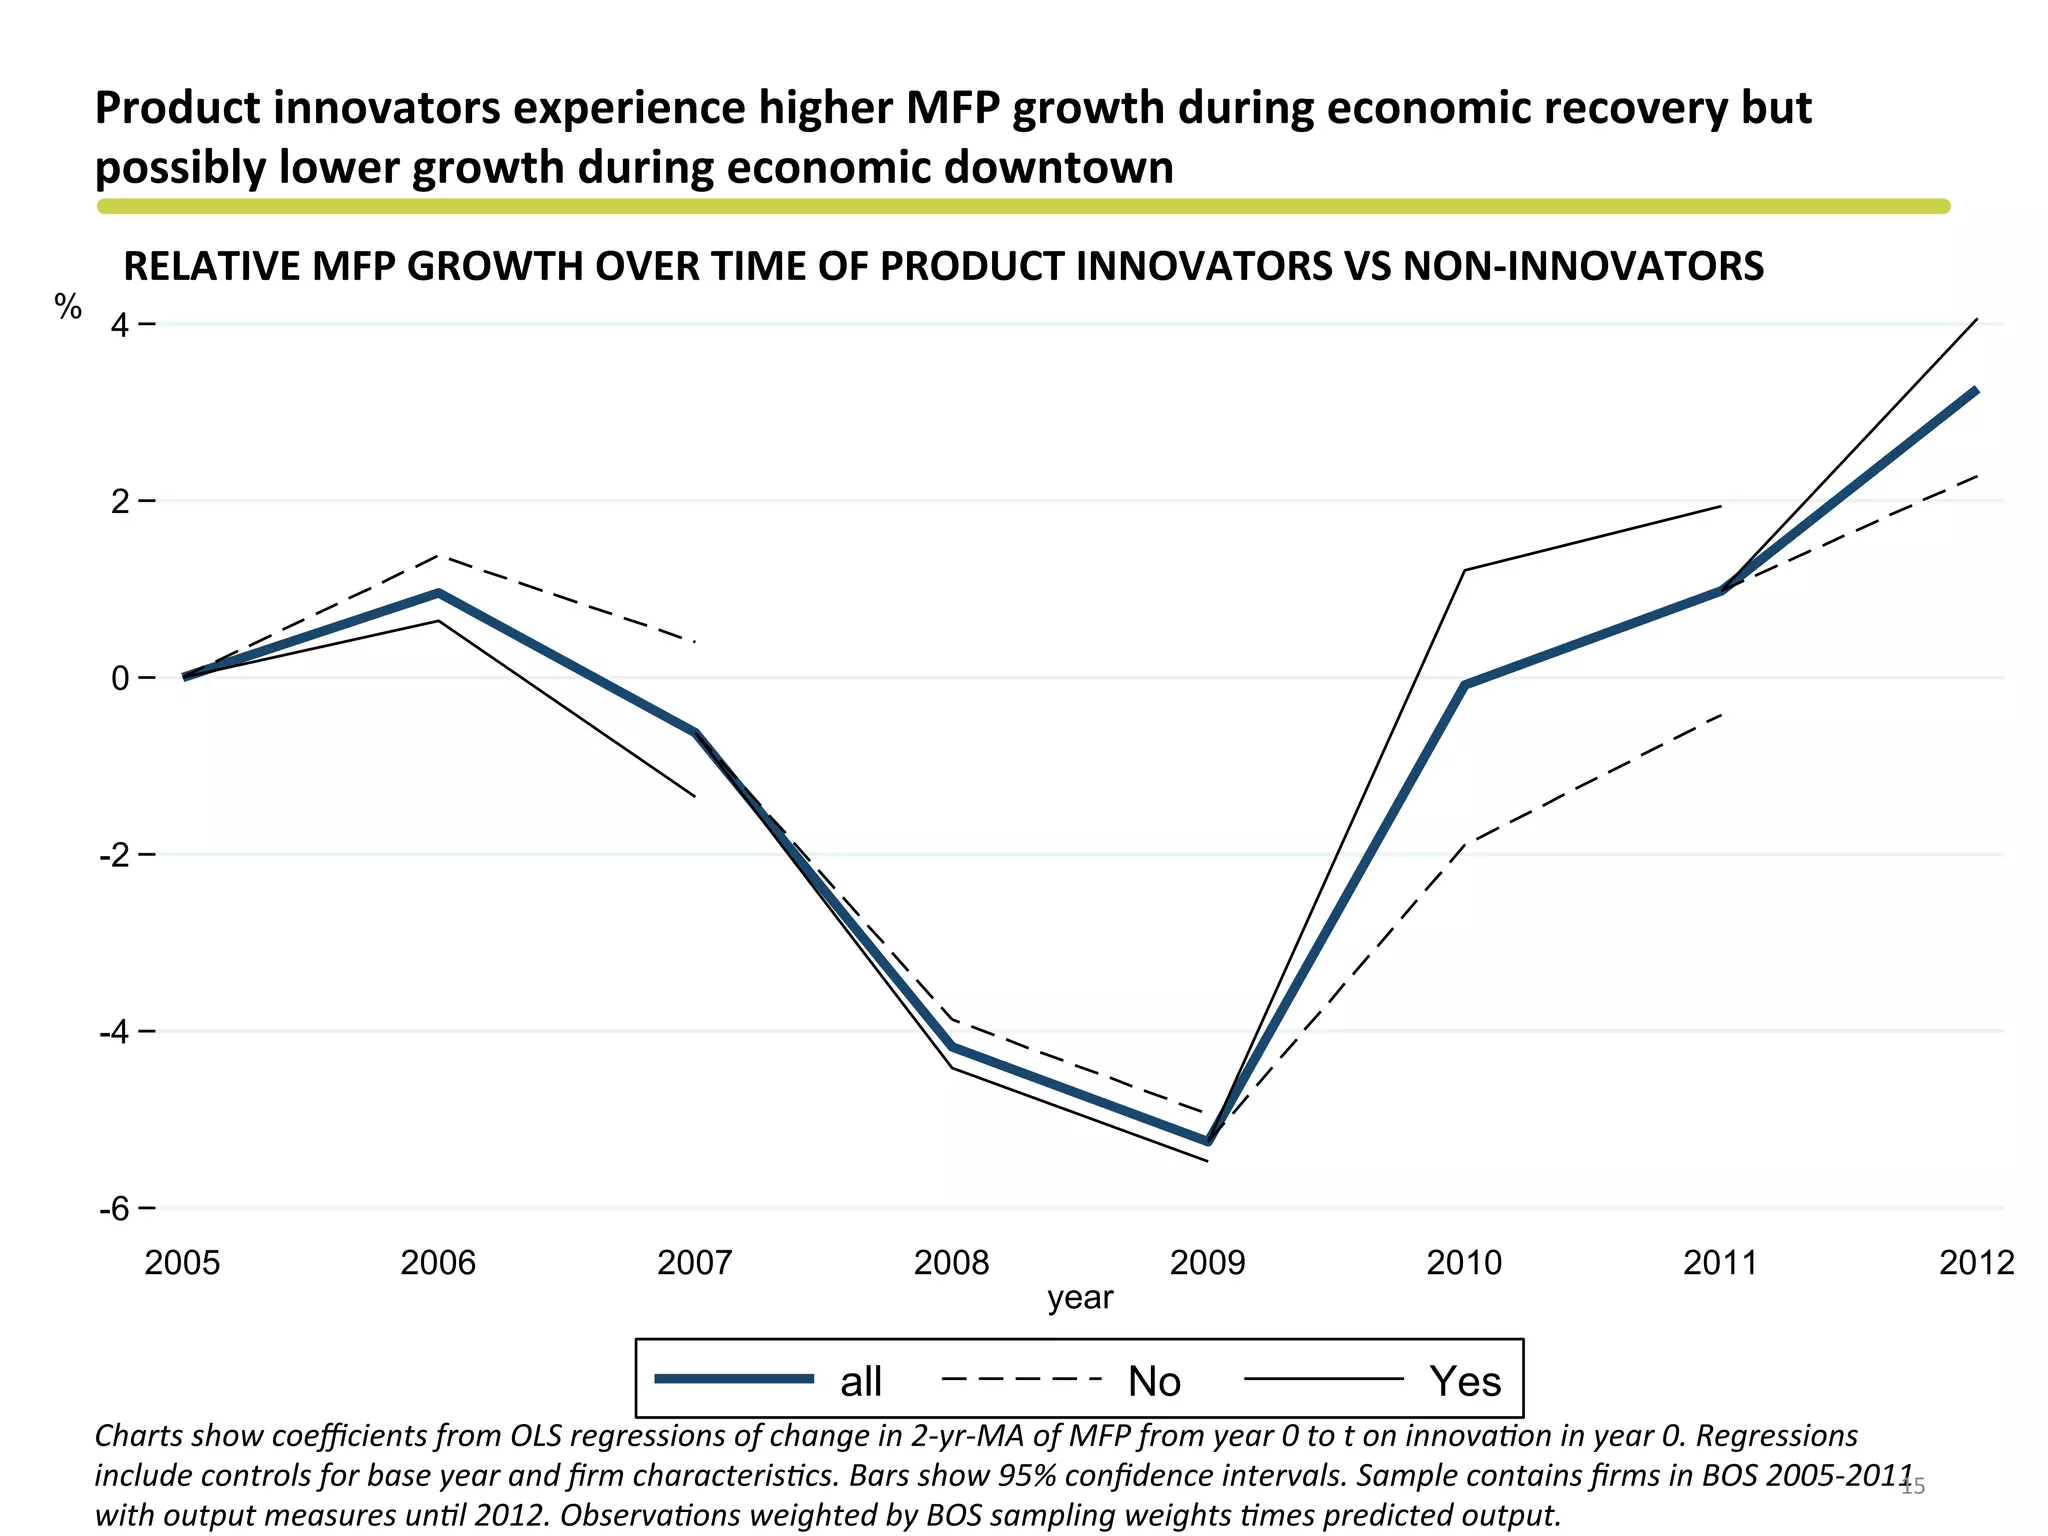
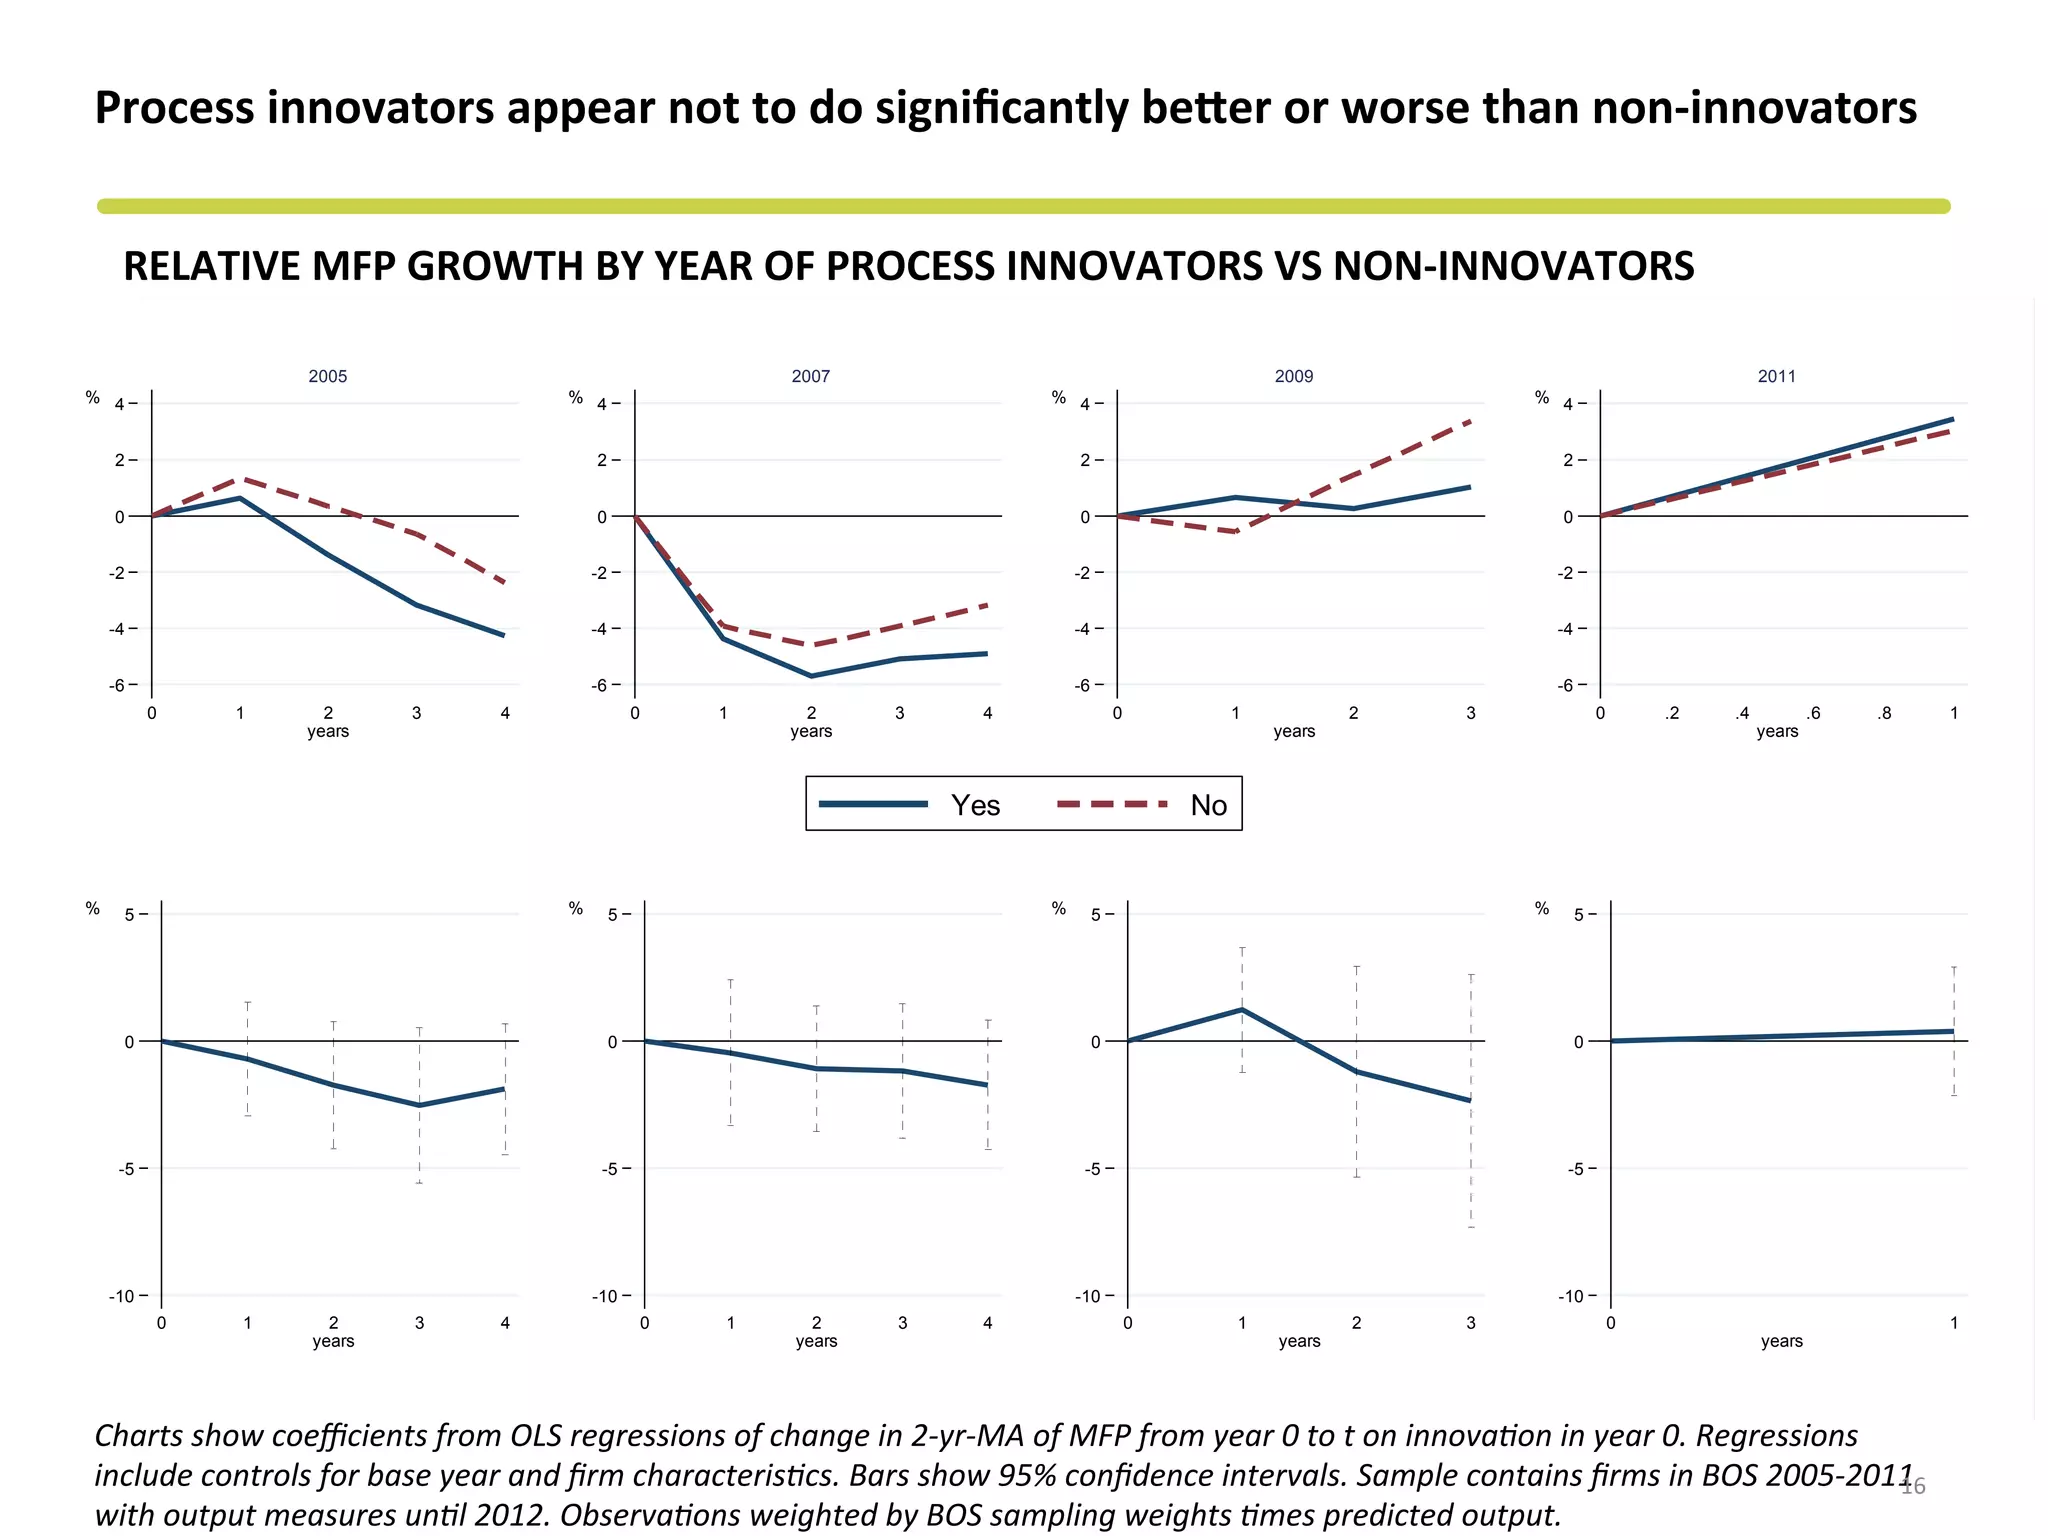
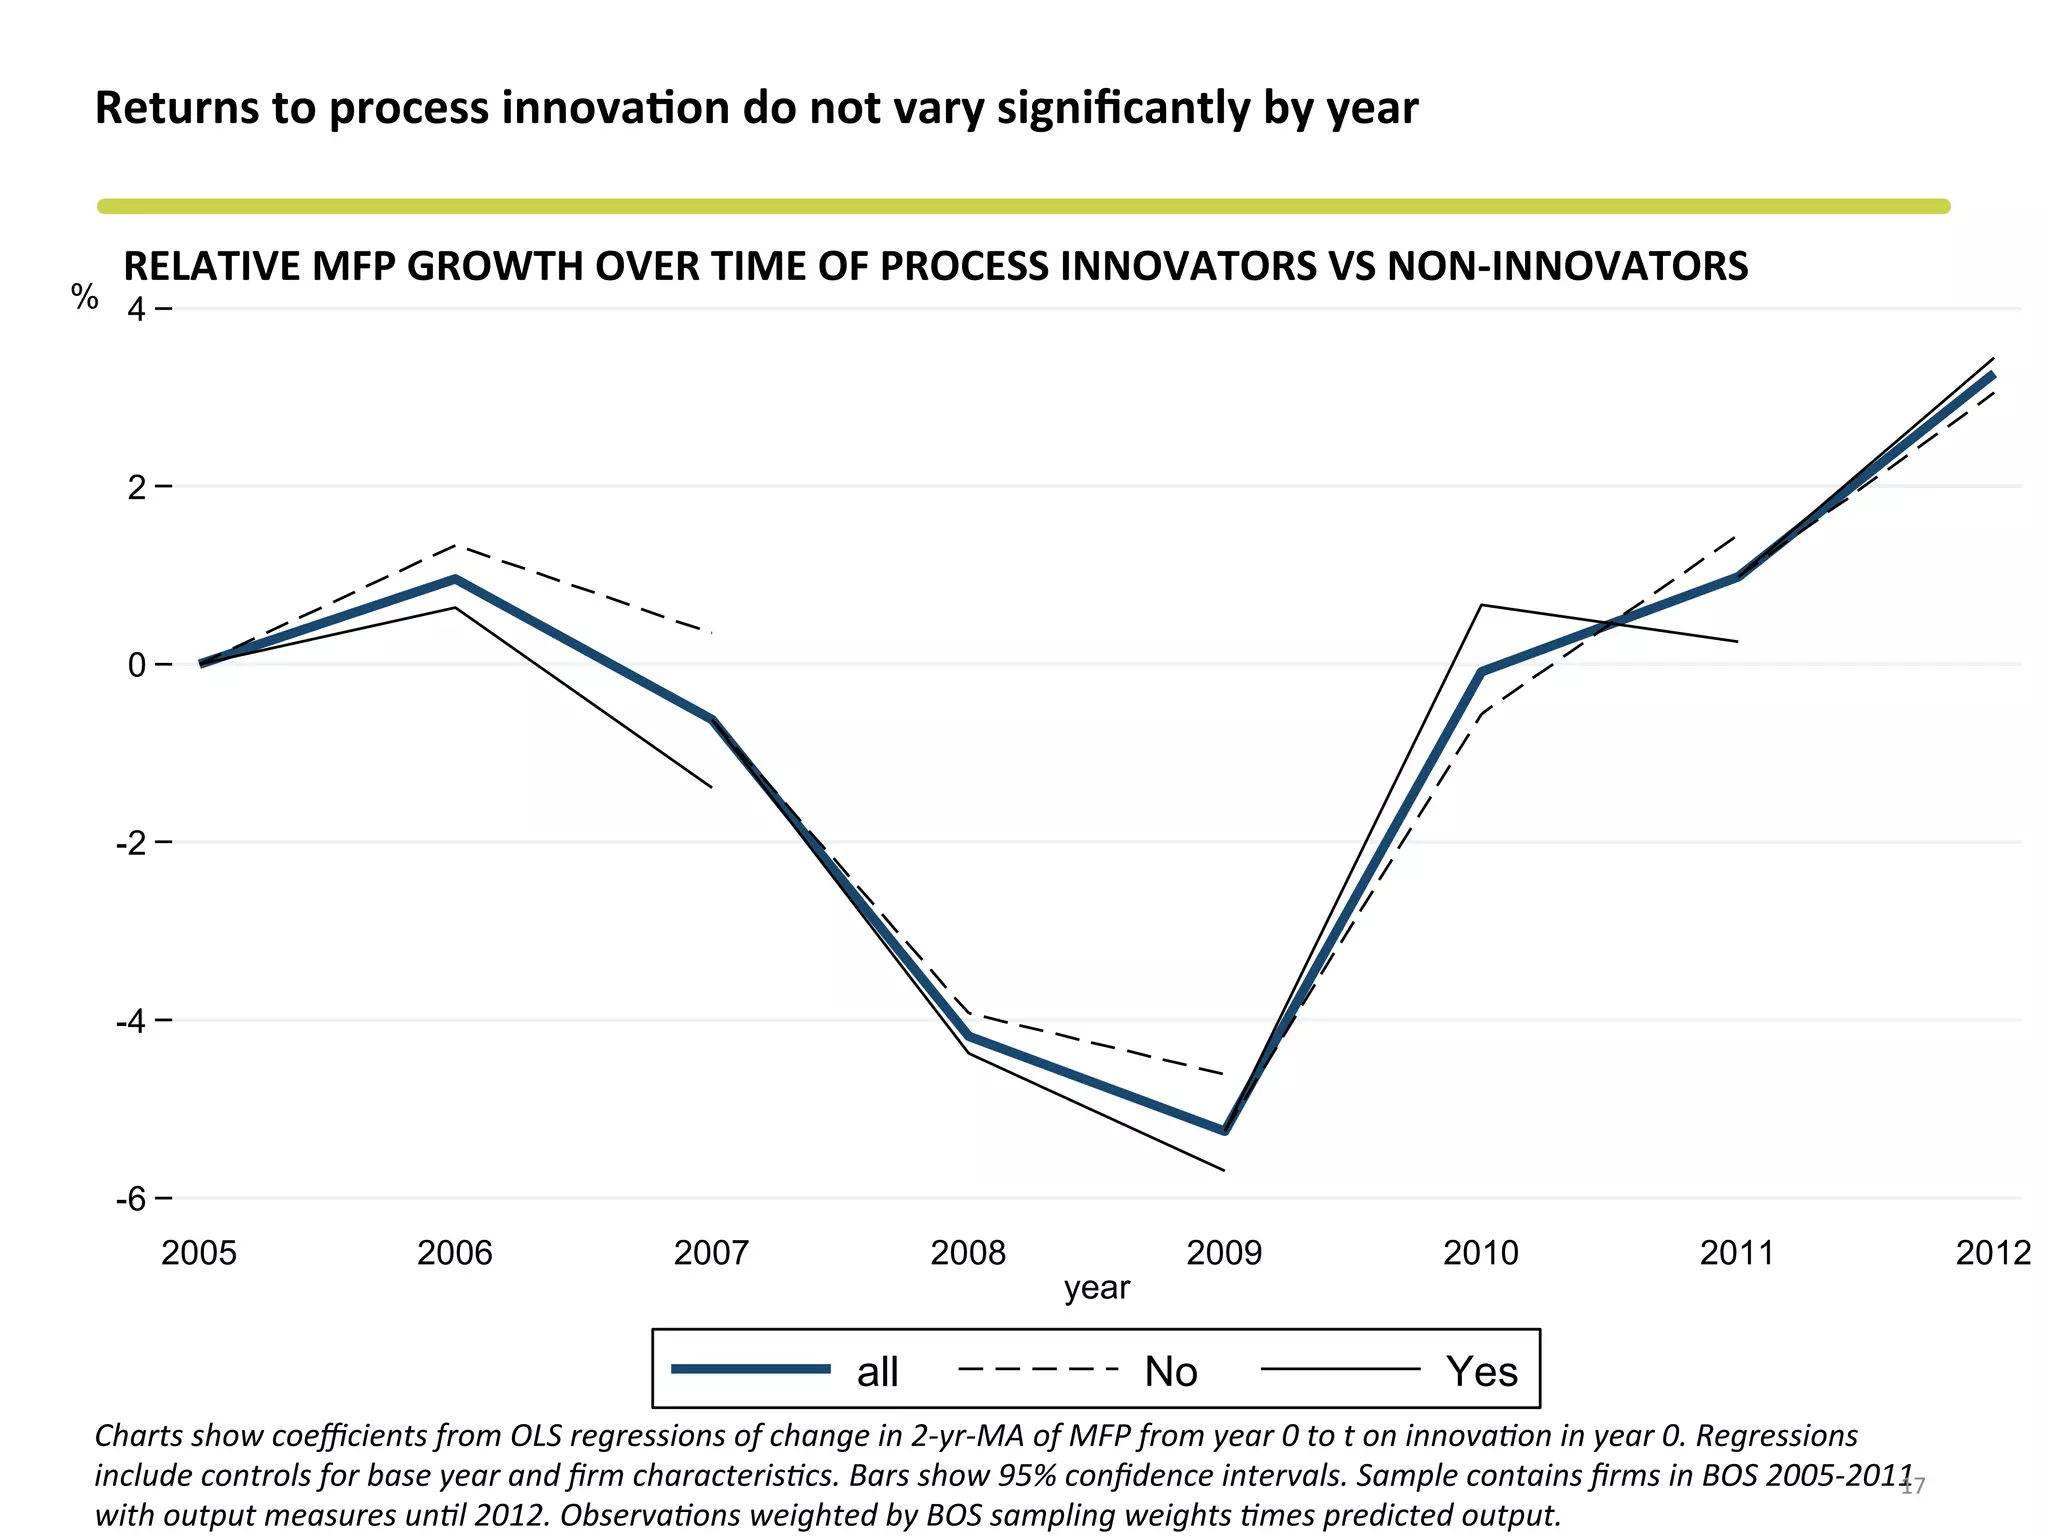
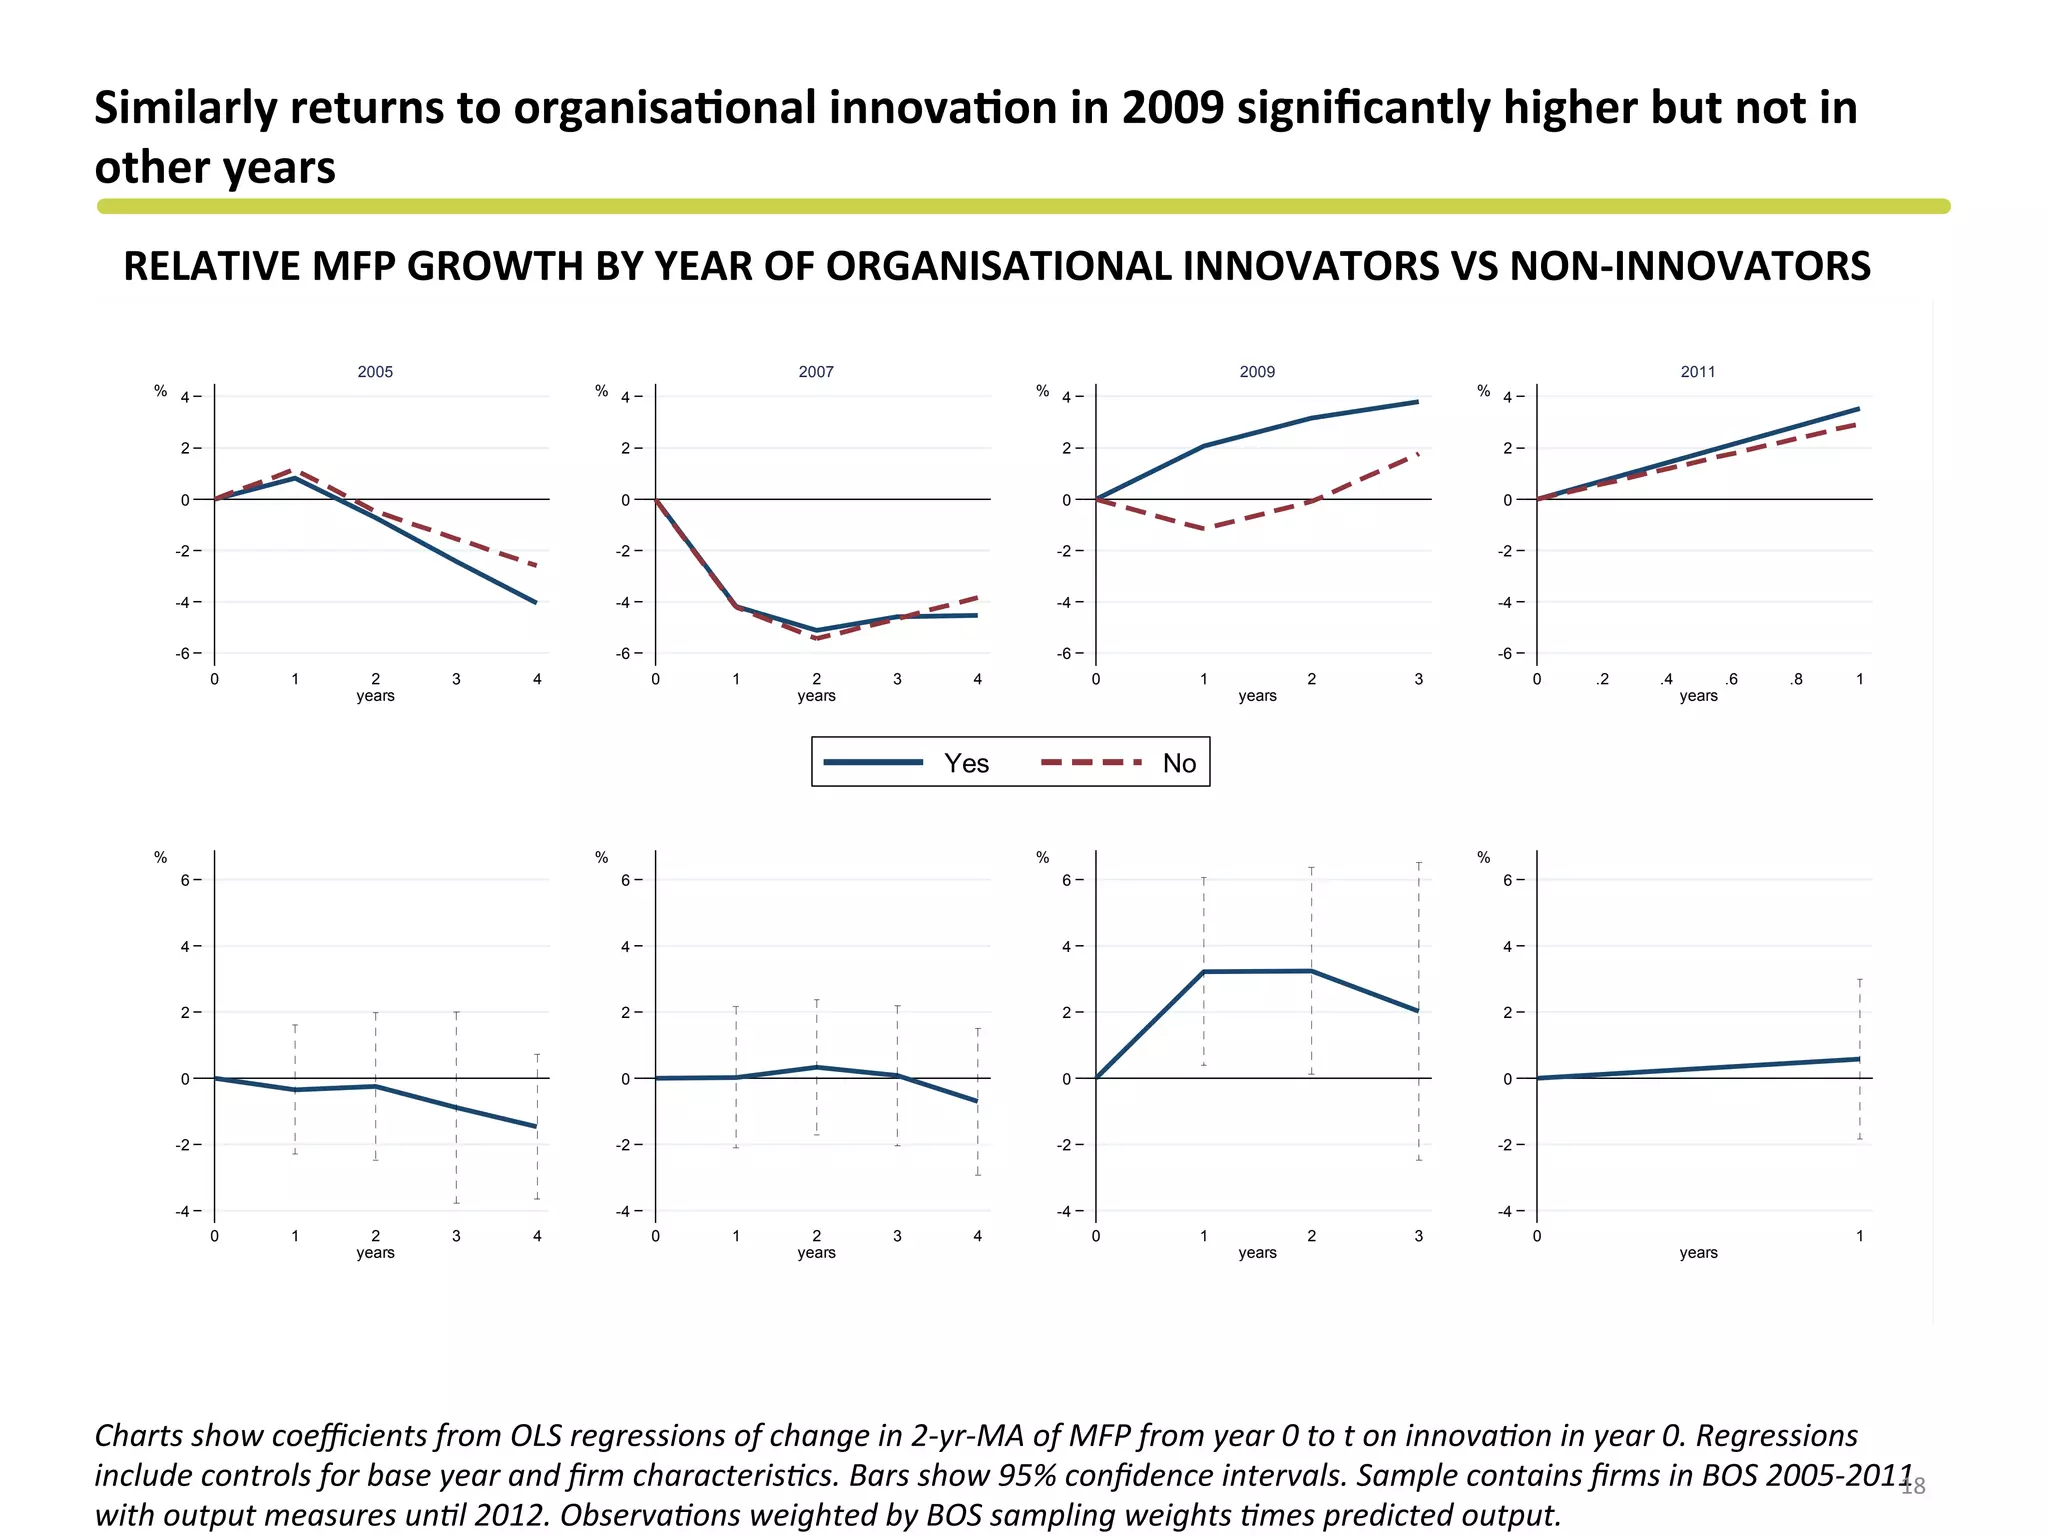
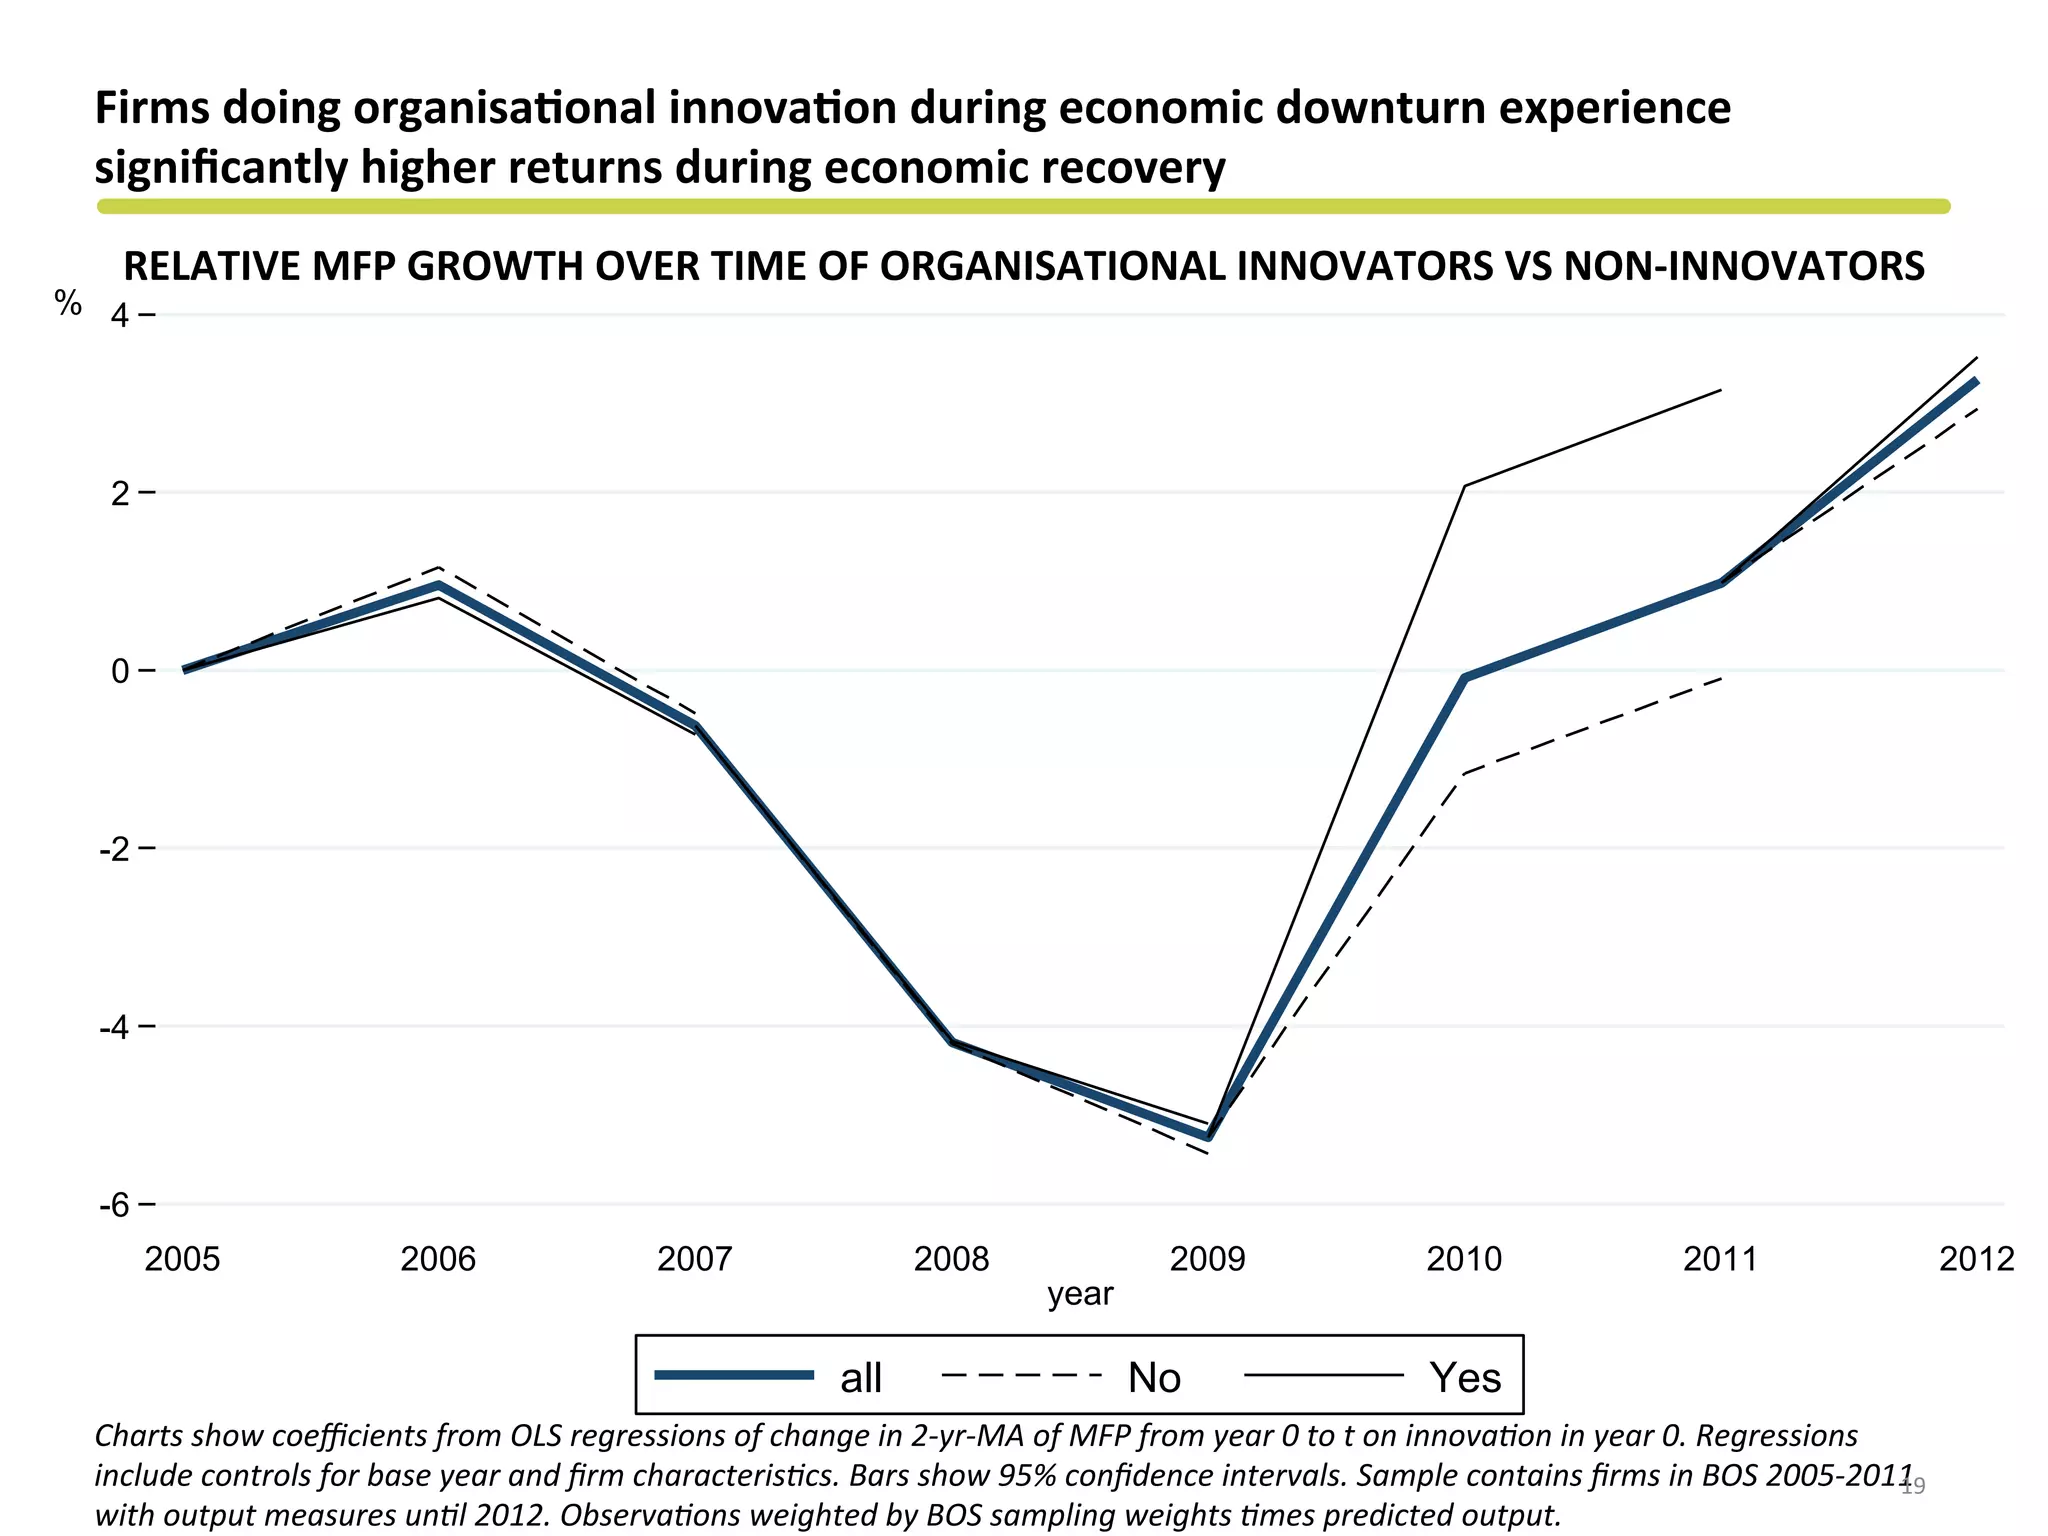
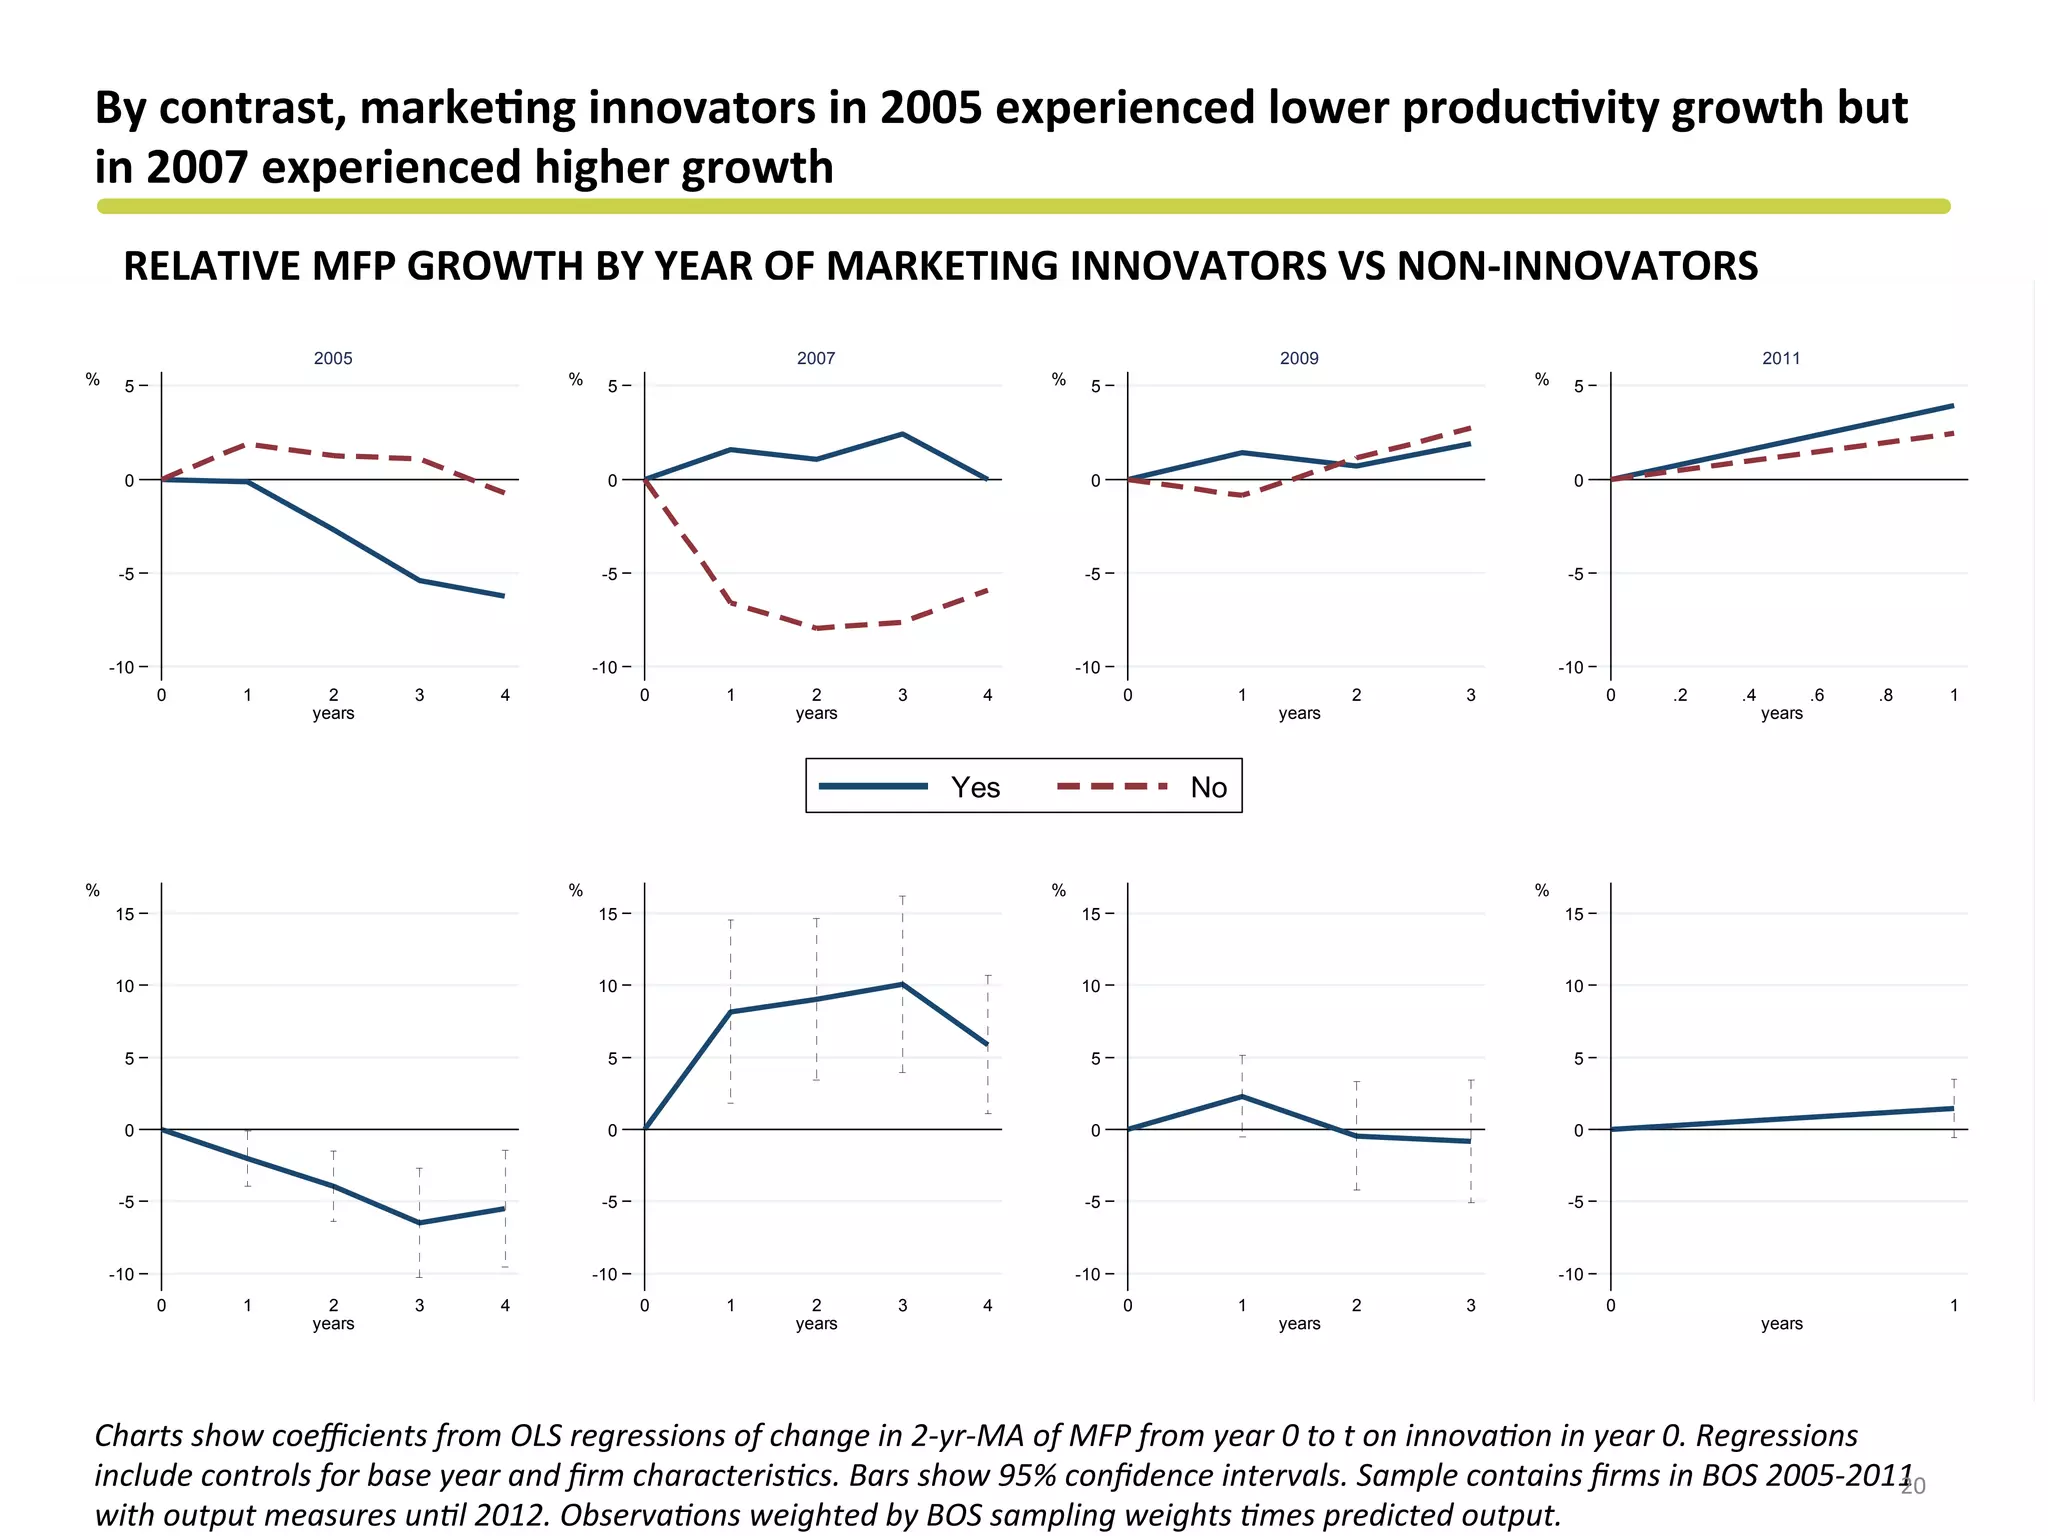
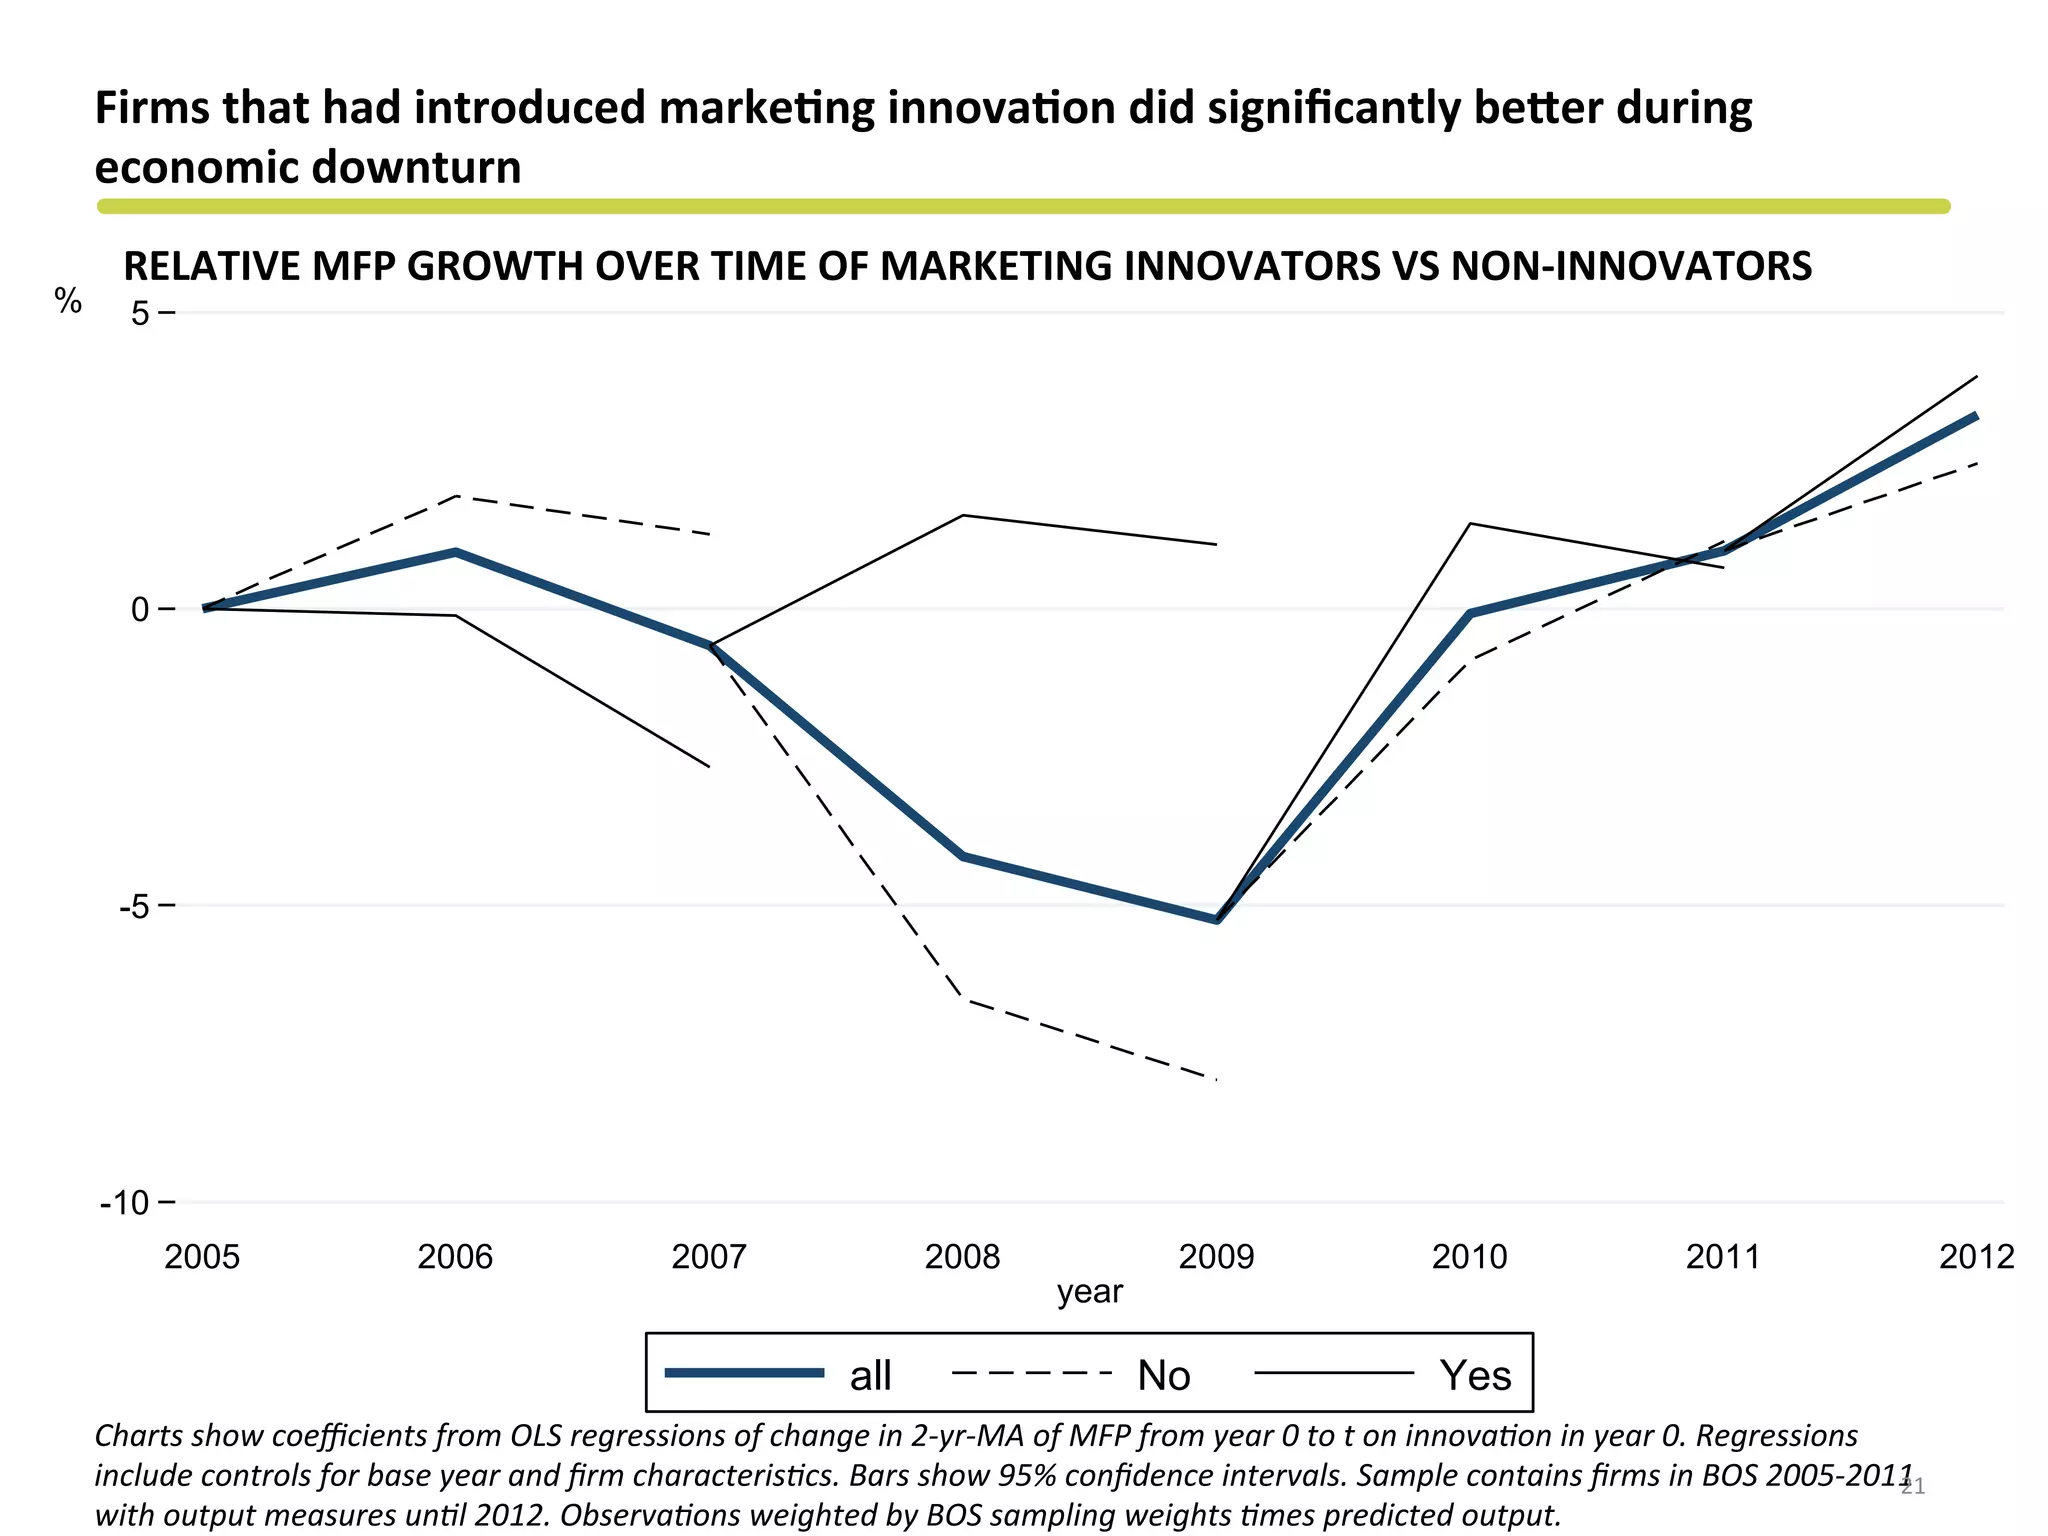
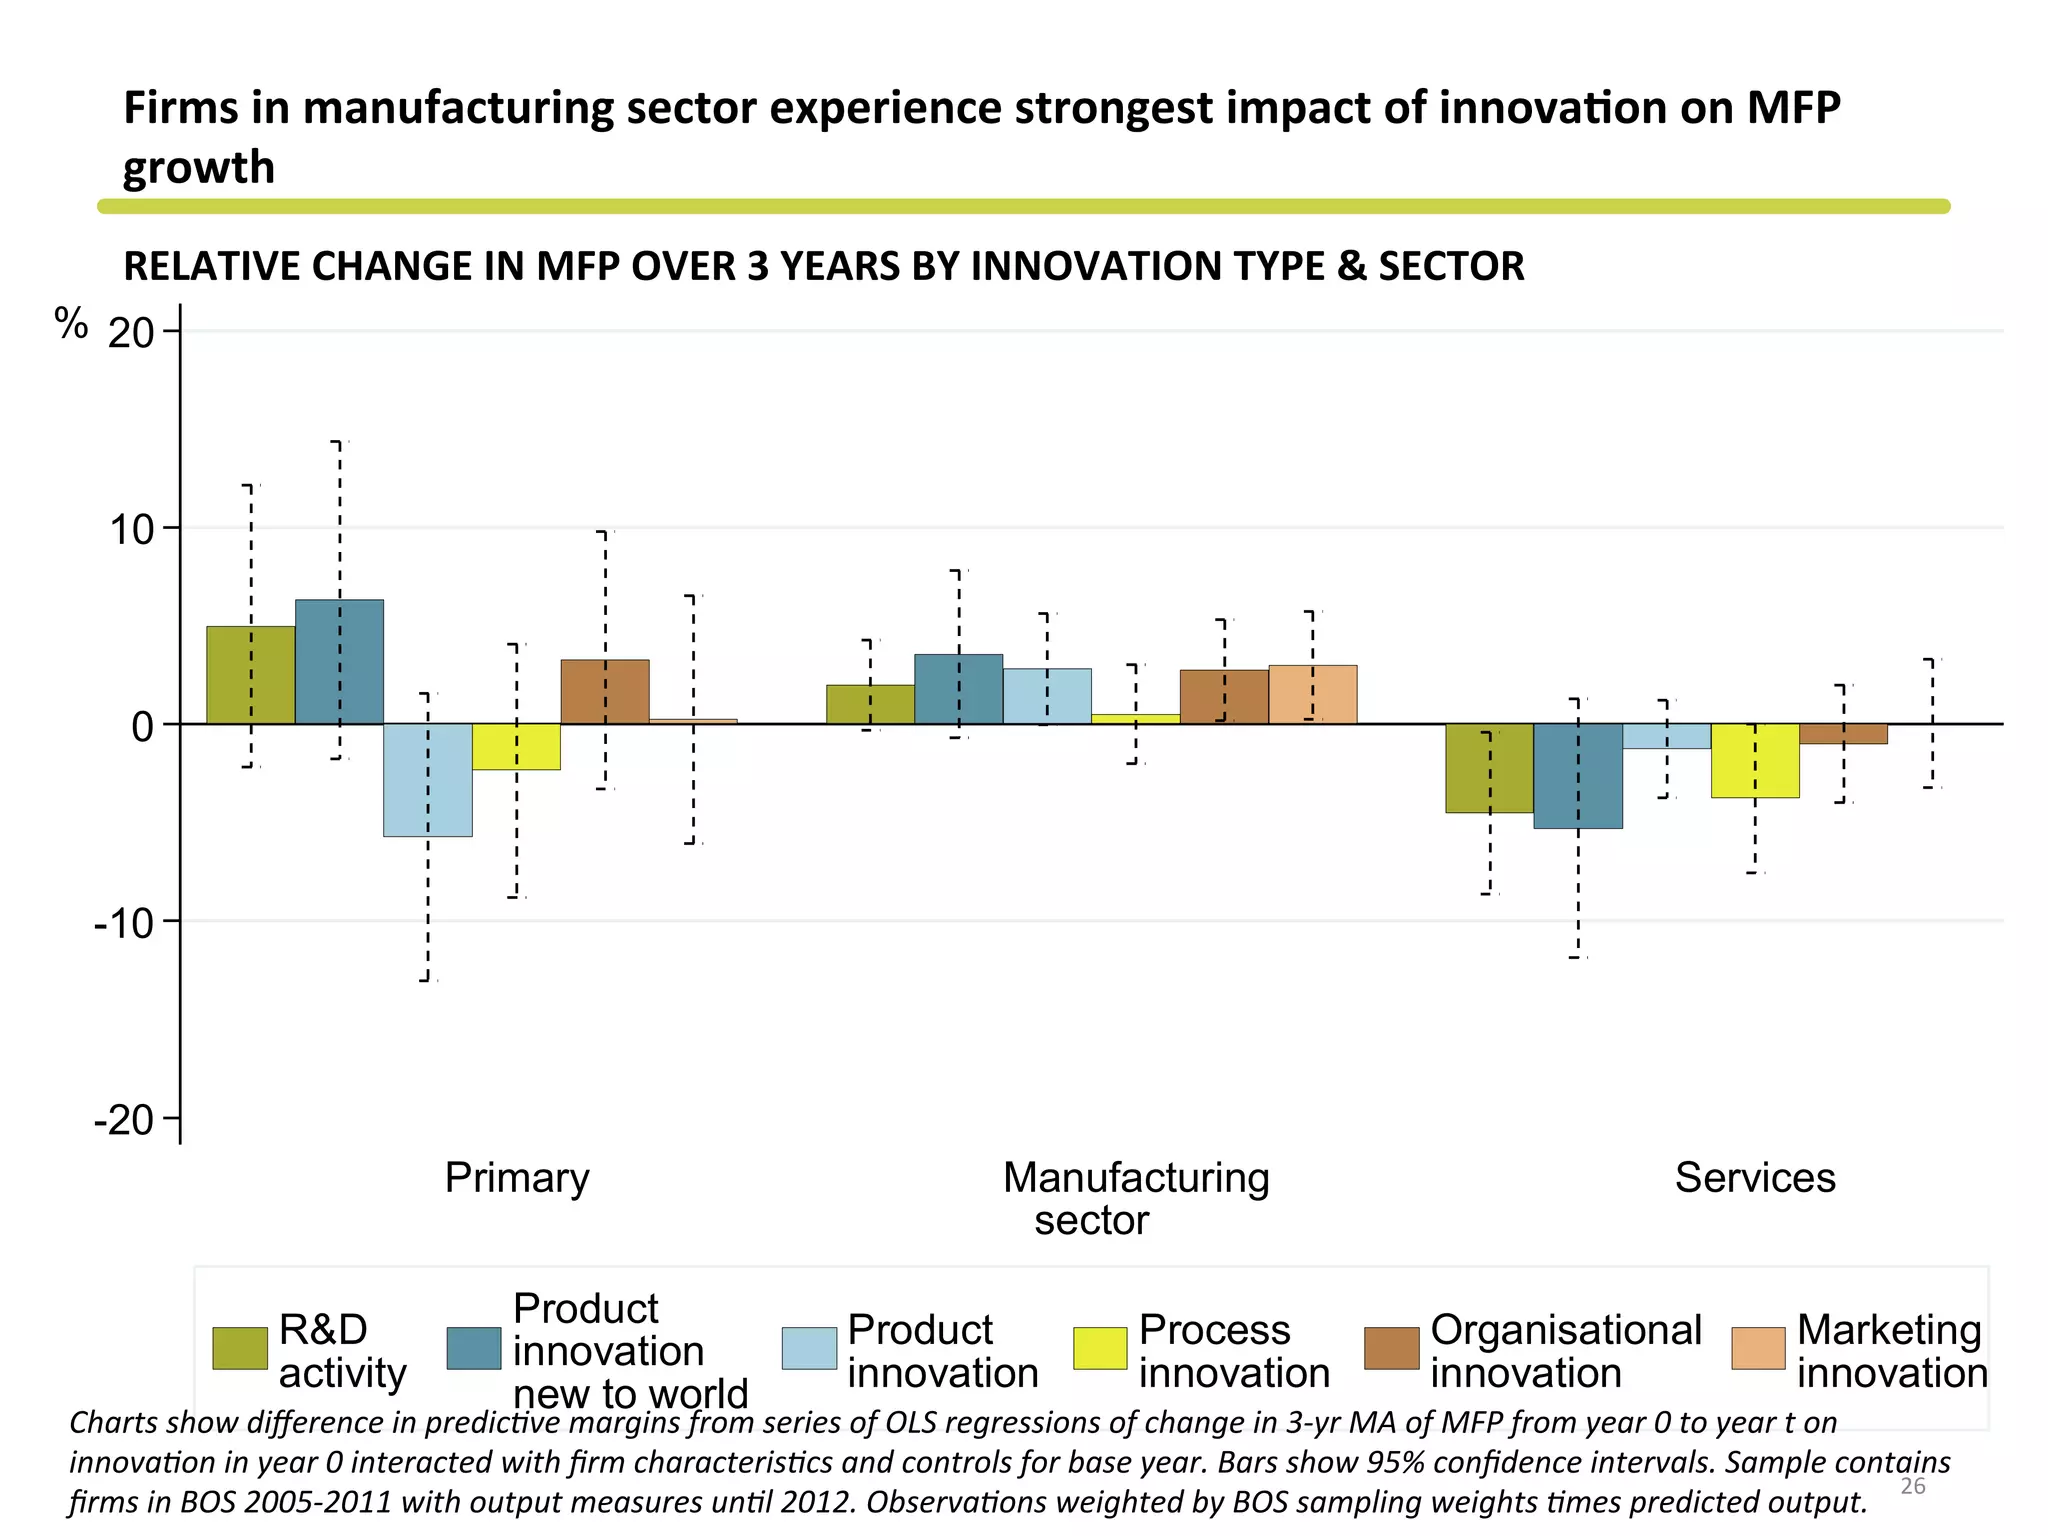
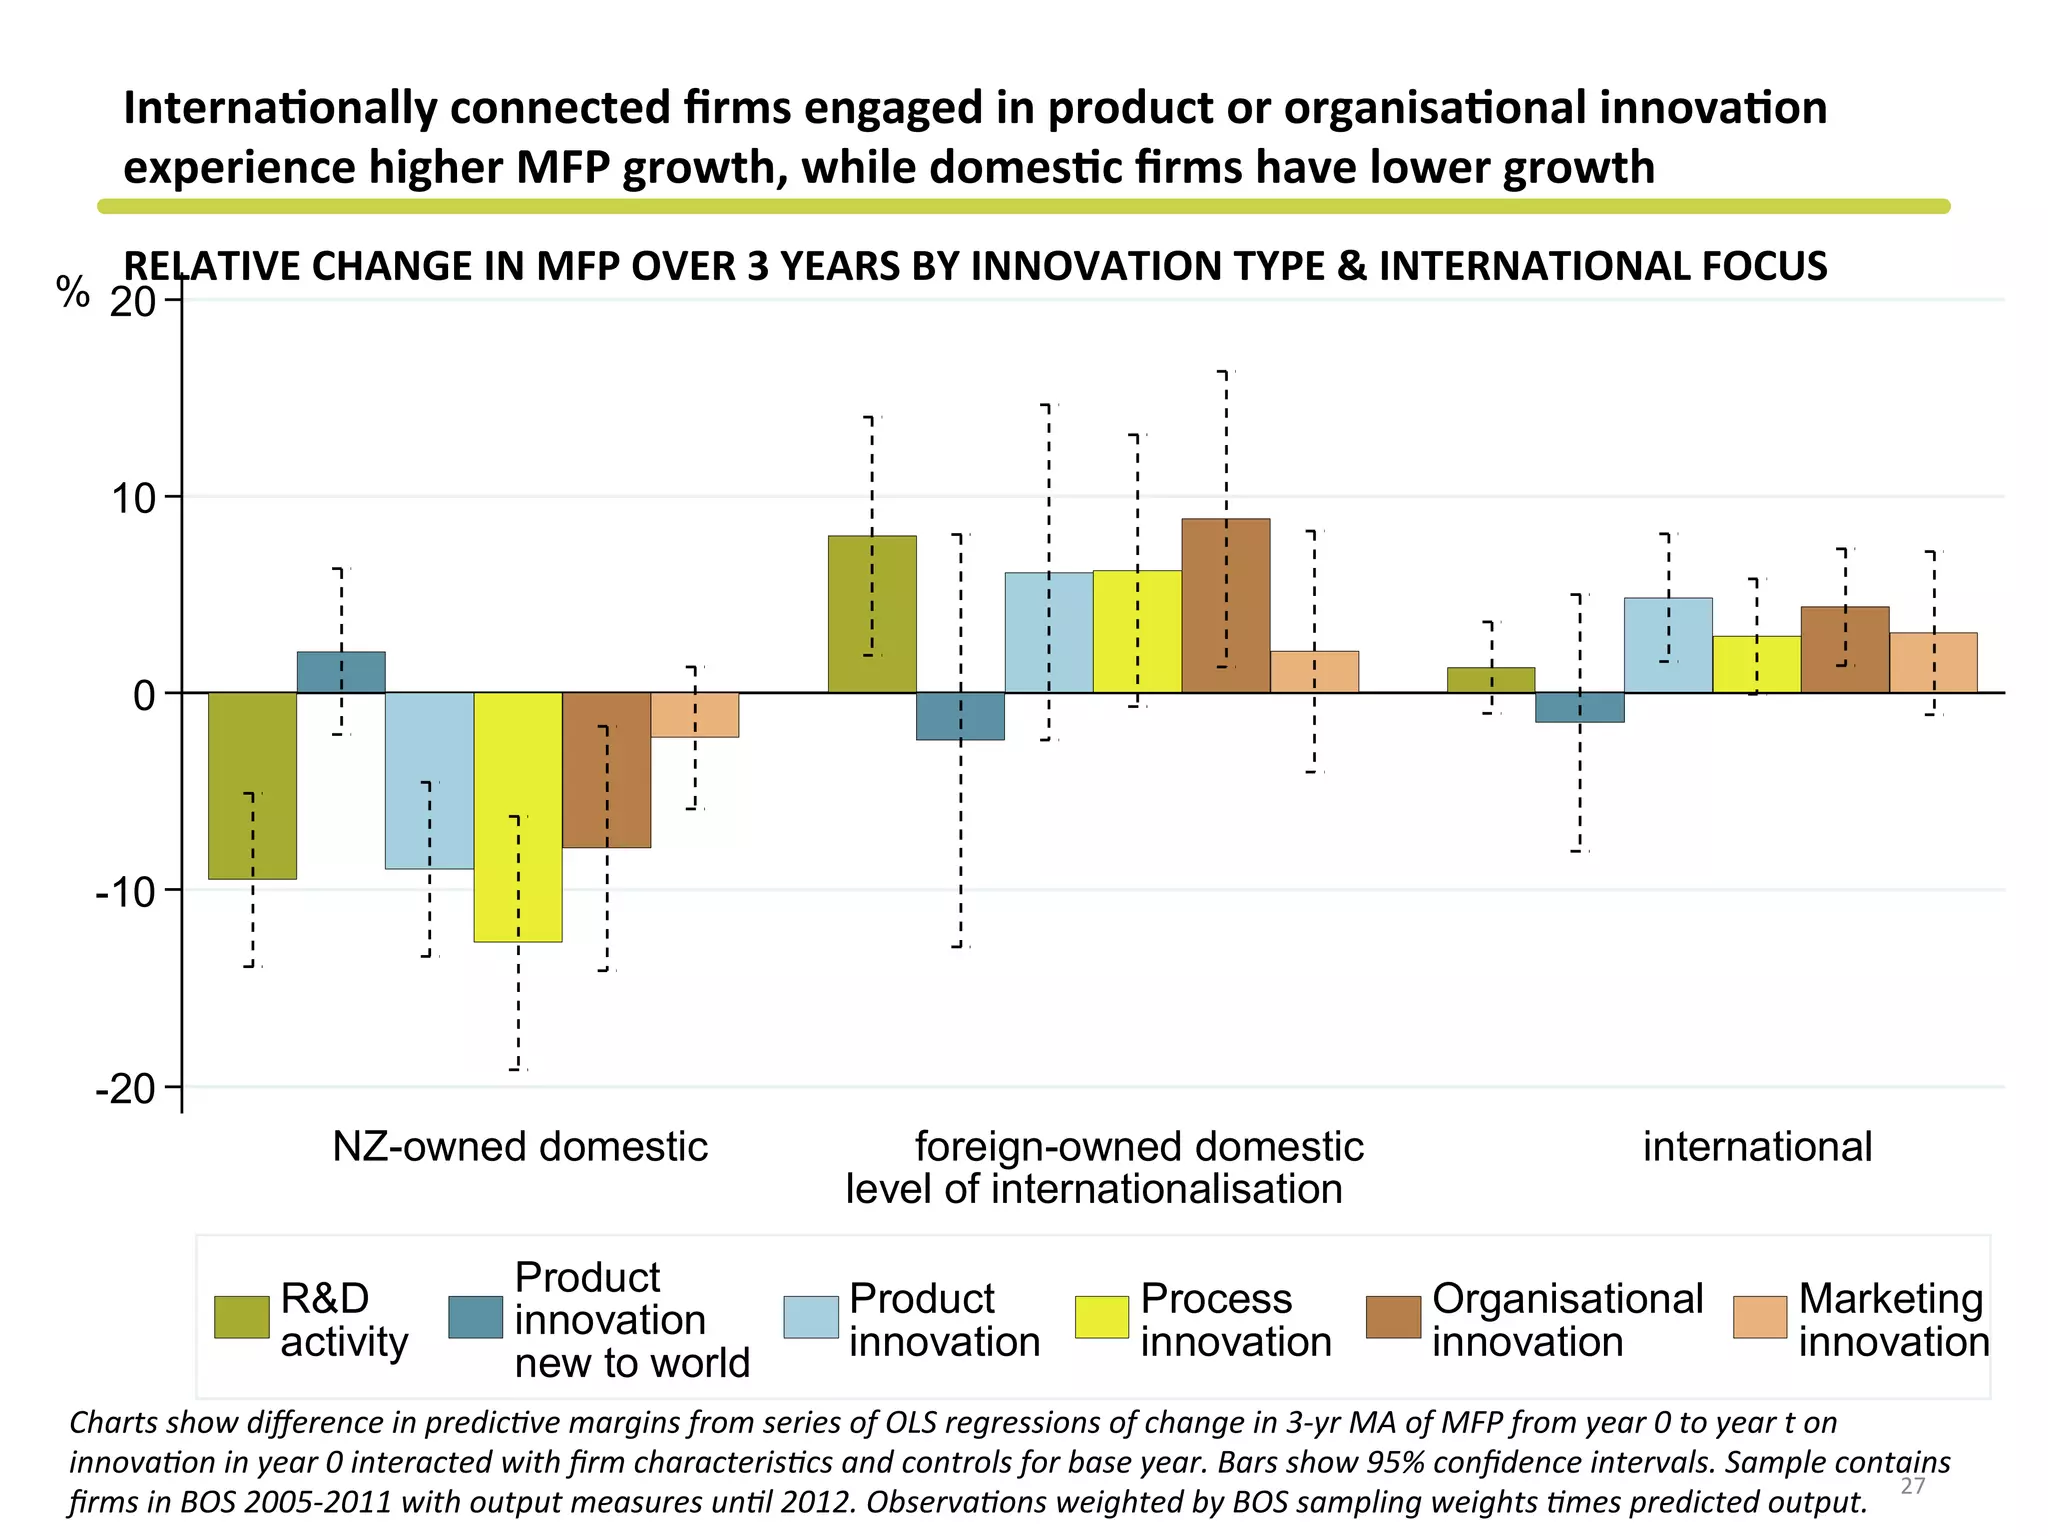
Innova&on	
  &	
  the	
  performance	
  of	
  	
  
New	
  Zealand	
  firms	
  
Simon	
  Wakeman	
  
NZAE	
  conference	
  
1	
  July	
  2016	
  
1	
  
Low	
  investment	
  in	
  knowledge-­‐based	
  capital	
  may	
  explain	
  up	
  to	
  40%	
  of	
  the	
  
produc&vity	
  gap	
  rela&ve	
  to	
  the	
  OECD	
  average	
  
2	
  
Source:	
  NZPC;	
  de	
  Serres	
  et	
  al.	
  (2014)	
  
Interna&onal	
  comparisons	
  show	
  NZ	
  near	
  top	
  of	
  OECD	
  rankings	
  in	
  genera&ng	
  science	
  
but	
  lower	
  ranked	
  in	
  commercialising	
  innova&on	
  
NZ’S	
  AVERAGE	
  RANKING	
  IN	
  TOP-­‐LEVEL	
  CATEGORIES	
  OF	
  OECD	
  STATISTICS	
  
3	
  
7	
  
11	
  
12	
  
20	
  
19	
  
26	
  
Science	
  base	
   Human	
  resources	
  
Internet	
  use	
  for	
  
innovaCon	
  
Business	
  R&D	
  and	
  
innovaCon	
  
Knowledge	
  flows	
  
and	
  
commercialisaCon	
   Entrepreneurship	
  
Source:	
  OECD	
  (2012).	
  Compara?ve	
  performance	
  of	
  na?onal	
  science	
  and	
  innova?on	
  systems	
  
Use	
  Sta&s&cs	
  NZ’s	
  Longitudinal	
  Business	
  Database	
  to	
  study	
  rela&onship	
  between	
  
innova&on	
  and	
  produc&vity	
  for	
  New	
  Zealand	
  firms	
  
DATA	
  SOURCES	
  
Innova&on	
  ac&vity	
  
- Business	
  Opera?ons	
  Survey	
  (BOS)	
  
- Intellectual	
  Property	
  Office	
  (IPONZ)	
  
Produc&vity	
  es&mates	
  
	
  (Fabling	
  &	
  Mare,	
  2015)	
  
Financial	
  data	
  
- Annual	
  Enterprise	
  Survey	
  (AES)	
  
- IR10	
  tax	
  returns	
  
Access	
  to	
  the	
  data	
  presented	
  was	
  managed	
  by	
  Sta?s?cs	
  New	
  Zealand	
  under	
  strict	
  micro-­‐data	
  access	
  protocols	
  
and	
  in	
  accordance	
  with	
  the	
  security	
  and	
  confiden?ality	
  provisions	
  of	
  the	
  Sta?s?c	
  Act	
  1975.	
  These	
  findings	
  are	
  
not	
  Official	
  Sta?s?cs.	
  The	
  opinions,	
  findings,	
  recommenda?ons,	
  and	
  conclusions	
  expressed	
  are	
  those	
  of	
  the	
  
author/researcher,	
  not	
  Sta?s?cs	
  New	
  Zealand	
  or	
  the	
  New	
  Zealand	
  Produc?vity	
  Commission.	
  
Longitudinal	
  
Business	
  
Database	
  
R&D	
  ac&vity	
  
- Business	
  R&D	
  Survey	
  
- Business	
  Opera?ons	
  Survey	
  (BOS)	
  
Government	
  assistance	
  
- Payments	
  from	
  government	
  
programmes	
  (incl.	
  R&D	
  grants)	
  
LBD	
  contains	
  a	
  range	
  of	
  measures	
  reflec&ng	
  different	
  aspects	
  of	
  innova&on	
  
MEASURES	
  OF	
  INNOVATIVE	
  ACTIVITY	
  
5	
  
Sample	
  contains	
  responses	
  to	
  Business	
  Opera?ons	
  Survey	
  (2005-­‐2013).	
  
0.0%	
   1.0%	
   2.0%	
   3.0%	
   4.0%	
   5.0%	
   6.0%	
   7.0%	
   8.0%	
   9.0%	
   10.0%	
  
0%	
   5%	
   10%	
   15%	
   20%	
   25%	
   30%	
   35%	
   40%	
   45%	
  
Engaged	
  in	
  R&D	
  
Product	
  development	
  expenditure	
  (R&D/design/
markeCng/other)	
  
Filed	
  patent	
  
Registered	
  trademark	
  
Any	
  innovaCon	
  
Product	
  innovaCon	
  
(new	
  to	
  world/NZ/firm)	
  
Sales	
  from	
  new	
  products	
  
Process	
  innovaCon	
  
OrganisaConal	
  innovaCon	
  
MarkeCng	
  innovaCon	
  
%	
  total	
  expenditure/sales	
  
%	
  firms	
  engaged	
  in	
  ac&vity	
  	
  
R&D	
  expenditure	
  is	
  not	
  a	
  good	
  proxy	
  for	
  innova&on	
  output	
  in	
  all	
  cases	
  
R&D	
  ACTIVITY	
  VS	
  INNOVATION	
  ACTIVITY	


TYPE	
  OF	
  INNOVATION	
  EXPENDITURE	
  BY	
  SECTOR	


6	
  
Ever	
  engaged	
  in	
  
innovaCon	


   No	
   Yes	
  
Ever	
  engaged	
  
in	
  R&D	
  
	
  No	
  	
   27.5%	
   54.7%	
  
	
  Yes	
  	
   1.5%	
   16.3%	
  
Sample	
  contains	
  firms	
  responding	
  to	
  Business	
  Opera?ons	
  Survey	
  Innova?on	
  module	
  in	
  2007,	
  2009	
  &	
  2011.	
  
Sample	
  contains	
  firms	
  responding	
  to	
  Business	
  Opera?ons	
  Survey	
  (2005-­‐2012).	
  
0%	
   2%	
   4%	
   6%	
   8%	
   10%	
   12%	
   14%	
  
Primary	
  
Manufacturing	
  
Services	
  
R&D	
  expenditure	
   Design	
  expenditure	
   MarkeCng	
  expenditure	
   Other	
  expenditure	
  
Use	
  approach	
  developed	
  by	
  Fabling	
  &	
  Mare	
  (2015)	
  to	
  es&mate	
  firm	
  produc&vity	
  
MEASURING	
  FIRM	
  PERFORMANCE	
  
7	
  
Labour	
  
(L)	
  
Raw	
  materials/	
  
inputs	
  (M)	
  
Capital	
  (K)	
  
ProducCon	
  
Output	
  
(GO)	
  
( ) ( ) ( ) ( )ln 	
   ln ln ln 	
  
where	
   , { , , }
r r s
it j r it rs it i
r s r
t i
r
G O X X X
r s L K M
α β δ γ ε
≠
+= + + +
∈
∑ ∑∑
( )∑
( ) ( ) ( )MFP:
Empl
	
  ln(
oyment:	
  
Valued	
  added:	
  
Labour	
  productivity
	
  ln ln ln ln
where	
   , { , , }
:	
  
)
it
it it
it it
it
r r s
it it r it rs it it
rr s r
GO
GO
MFP GO X X X
r s L K M
L
M
M
L
β δ
≠
−
∈
−
−
−
= ∑∑ ∑
0
20
40
60
80
% dif
Employment Value-added output Labour productivity MFP
output type
R&D
activity
Product
innovation
new to world
Product
innovation
Process
innovation
Organisational
innovation
Marketing
innovation
RELATIVE	
  OUTPUT	
  LEVEL	
  INNOVATORS	
  VS.	
  NON-­‐INNOVATORS	
  BY	
  INNOVATION	
  MEASURE	
  
On	
  average	
  innova&ng	
  firms	
  larger	
  but	
  less	
  produc&ve	
  than	
  non-­‐innova&ng	
  firms	
  in	
  year	
  
in	
  which	
  innova&on	
  occurs	
  
8	
  
Chart	
  shows	
  difference	
  in	
  performance	
  measure	
  predicted	
  from	
  series	
  of	
  OLS	
  regressions	
  of	
  output	
  level	
  in	
  year	
  0	
  on	
  innova?on	
  in	
  
year	
  0	
  with	
  controls	
  for	
  year	
  and	
  industry.	
  Bars	
  show	
  95%	
  confidence	
  intervals.	
  Sample	
  contains	
  firms	
  in	
  BOS	
  2005-­‐2011	
  with	
  
performance	
  measures	
  up	
  to	
  2012.	
  Observa?ons	
  weighted	
  by	
  BOS	
  sampling	
  weights.	
  
0
10
20
30
%
1 2 3 4 5 6 7 8 9 10
decile of mfp
Product innovation
(new to world)
1 2 3 4 5 6 7 8 9 10
decile of mfp
Product innovation
(new to NZ)
1 2 3 4 5 6 7 8 9 10
decile of mfp
Product innovation
(new to the firm)
1 2 3 4 5 6 7 8 9 10
decile of mfp
Process innovation
1 2 3 4 5 6 7 8 9 10
decile of mfp
Organisational innovation
1 2 3 4 5 6 7 8 9 10
decile of mfp
Marketing innovation
PROPORTION	
  OF	
  FIRMS	
  ENGAGED	
  IN	
  INNOVATION	
  BY	
  DECILE	
  OF	
  PRODUCTIVITY	
  IN	
  YEAR	
  0	
  
Most	
  produc&ve	
  firms	
  least	
  likely	
  to	
  innovate	
  
9	
  
Chart	
  shows	
  likelihood	
  of	
  firm	
  innova?on	
  predicted	
  from	
  probit	
  regression	
  of	
  innova?on	
  ac?vity	
  in	
  year	
  0	
  on	
  produc?vity	
  decile	
  in	
  
year	
  0.	
  Bars	
  show	
  95%	
  confidence	
  intervals.	
  Sample	
  contains	
  firms	
  in	
  BOS	
  2005-­‐2011.	
  Observa?ons	
  weighted	
  by	
  BOS	
  sampling	
  
weights	
  
Use	
  difference-­‐in-­‐differences	
  approach	
  to	
  measure	
  impact	
  of	
  innova&on	
  on	
  
produc&vity	
  
EMPIRICAL	
  APPROACH	
  
•  Regress	
  change	
  in	
  firm	
  output/producCvity	
  (lnYin	
  -­‐	
  lnYi0)	
  on	
  innovaCon	
  in	
  year	
  0	
  (I0)	
  
10	
  
0 0 0ln –ln 	


  in i I i X iY Y I X tα β β ε= + + + +
•  Compare	
  within-­‐firm	
  differences	
  in	
  output	
   ! controls	
  for	
  unobserved	
  firm	
  characterisCcs	
  
affecCng	
  output	
  levels	
  
•  Control	
  for	
  observed	
  firm	
  characterisCcs	
  (age,	
  
size,	
  industry,	
  etc.)	
  
! controls	
  for	
  observed	
  firm	
  characterisCcs	
  
affecCng	
  changes	
  in	
  output	
  
•  For	
  MFP,	
  use	
  2-­‐year	
  moving	
  average	
   ! accounts	
  for	
  measurement	
  error	
  
•  Weight	
  observaCons	
  by	
  BOS	
  sampling	
  
weights	
  Cmes	
  predicted	
  gross	
  output	
  
! quanCCes	
  corresponds	
  to	
  aggregate	
  
economic	
  output/producCvity	
  
•  Do	
  not	
  instrument	
  for	
  innovaCon	
  (cf	
  Crepon,	
  
Duguet	
  &	
  Mairesse,	
  1998)	


-6
-4
-2
0
2
4%
0 1 2 3 4
years
change in employment
-6
-4
-2
0
2
4%
0 1 2 3 4
years
change in value-added output
-6
-4
-2
0
2
4%
0 1 2 3 4
years
change in labour productivity
-6
-4
-2
0
2
4%
0 1 2 3 4
years
change in MFP
Yes No
-10
0
10
20%
0 1 2 3 4
years
-10
0
10
20%
0 1 2 3 4
years
-10
0
10
20%
0 1 2 3 4
years
-10
0
10
20%
0 1 2 3 4
years
RELATIVE	
  GROWTH	
  BY	
  OUTPUT	
  TYPE	
  OF	
  R&D	
  ACTIVE	
  VS	
  NON-­‐ACTIVE	
  FIRMS	
  
Firms	
  engaged	
  in	
  R&D	
  ac&vity	
  have	
  faster	
  employment	
  and	
  output	
  growth	
  than	
  
non-­‐R&D-­‐ac&ve	
  firms	
  but	
  produc&vity	
  growth	
  not	
  different	
  
Charts	
  show	
  difference	
  in	
  predic?ve	
  margins	
  from	
  series	
  of	
  OLS	
  regressions	
  of	
  change	
  in	
  output	
  from	
  year	
  0	
  to	
  year	
  t	
  on	
  innova?on	
  
in	
  year	
  0.	
  Regressions	
  include	
  controls	
  for	
  base	
  year	
  and	
  firm	
  characteris?cs.	
  Bars	
  show	
  95%	
  confidence	
  intervals.	
  Sample	
  contains	
  
firms	
  in	
  BOS	
  2005-­‐2011	
  with	
  output	
  measures	
  un?l	
  2012.	
  Observa?ons	
  weighted	
  by	
  BOS	
  sampling	
  weights	
  ?mes	
  predicted	
  output.	
  
11	
  
-4
-2
0
2
4%
0 1 2 3 4
years
change in employment
-4
-2
0
2
4%
0 1 2 3 4
years
change in value-added output
-4
-2
0
2
4%
0 1 2 3 4
years
change in labour productivity
-4
-2
0
2
4%
0 1 2 3 4
years
change in MFP
Yes No
-10
-5
0
5
10
%
0 1 2 3 4
years
-10
-5
0
5
10
%
0 1 2 3 4
years
-10
-5
0
5
10
%
0 1 2 3 4
years
-10
-5
0
5
10
%
0 1 2 3 4
years
RELATIVE	
  GROWTH	
  BY	
  INNOVATION	
  ACTIVITY	
  OF	
  INNOVATORS	
  VS	
  NON-­‐INNOVATORS	
  
Similarly	
  firms	
  engaged	
  in	
  innova&on	
  grow	
  faster	
  in	
  size	
  but	
  not	
  produc&vity	
  
Charts	
  show	
  difference	
  in	
  predic?ve	
  margins	
  from	
  series	
  of	
  OLS	
  regressions	
  of	
  change	
  in	
  output	
  from	
  year	
  0	
  to	
  year	
  t	
  on	
  innova?on	
  
in	
  year	
  0.	
  Regressions	
  include	
  controls	
  for	
  base	
  year	
  and	
  firm	
  characteris?cs.	
  Bars	
  show	
  95%	
  confidence	
  intervals.	
  Sample	
  contains	
  
firms	
  in	
  BOS	
  2005-­‐2011	
  with	
  output	
  measures	
  un?l	
  2012.	
  Observa?ons	
  weighted	
  by	
  BOS	
  sampling	
  weights	
  ?mes	
  predicted	
  output.	
  
12	
  
-6
-4
-2
0
2%
0 1 2 3 4
years
Product innovation
-6
-4
-2
0
2%
0 1 2 3 4
years
Process innovation
-6
-4
-2
0
2%
0 1 2 3 4
years
Organisational innovation
-6
-4
-2
0
2%
0 1 2 3 4
years
Marketing innovation
Yes No
-4
-2
0
2
4
%
0 1 2 3 4
years
-4
-2
0
2
4
%
0 1 2 3 4
years
-4
-2
0
2
4
%
0 1 2 3 4
years
-4
-2
0
2
4
%
0 1 2 3 4
years
RELATIVE	
  MFP	
  GROWTH	
  BY	
  INNOVATION	
  TYPE	
  OF	
  INNOVATORS	
  VS	
  NON-­‐INNOVATORS	
  
Only	
  firms	
  engaged	
  in	
  marke&ng	
  innova&on	
  experience	
  significantly	
  higher	
  
produc&vity	
  growth	
  
Charts	
  show	
  coefficients	
  from	
  OLS	
  regressions	
  of	
  change	
  in	
  2-­‐yr-­‐MA	
  of	
  MFP	
  from	
  year	
  0	
  to	
  t	
  on	
  innova?on	
  in	
  year	
  0.	
  Regressions	
  
include	
  controls	
  for	
  base	
  year	
  and	
  firm	
  characteris?cs.	
  Bars	
  show	
  95%	
  confidence	
  intervals.	
  Sample	
  contains	
  firms	
  in	
  BOS	
  2005-­‐2011	
  
with	
  output	
  measures	
  un?l	
  2012.	
  Observa?ons	
  weighted	
  by	
  BOS	
  sampling	
  weights	
  ?mes	
  predicted	
  output.	
  
13	
  
-6
-4
-2
0
2
4
%
0 1 2 3 4
years
2005
-6
-4
-2
0
2
4
%
0 1 2 3 4
years
2007
-6
-4
-2
0
2
4
%
0 1 2 3
years
2009
-6
-4
-2
0
2
4
%
0 .2 .4 .6 .8 1
years
2011
Yes No
-5
0
5
10%
0 1 2 3 4
years
-5
0
5
10%
0 1 2 3 4
years
-5
0
5
10%
0 1 2 3
years
-5
0
5
10%
0 1
years
RELATIVE	
  MFP	
  GROWTH	
  BY	
  YEAR	
  OF	
  PRODUCT	
  INNOVATORS	
  VS	
  NON-­‐INNOVATORS	
  
Returns	
  to	
  innova&on	
  vary	
  drama&cally	
  by	
  year	
  
Charts	
  show	
  coefficients	
  from	
  OLS	
  regressions	
  of	
  change	
  in	
  2-­‐yr-­‐MA	
  of	
  MFP	
  from	
  year	
  0	
  to	
  t	
  on	
  innova?on	
  in	
  year	
  0.	
  Regressions	
  
include	
  controls	
  for	
  base	
  year	
  and	
  firm	
  characteris?cs.	
  Bars	
  show	
  95%	
  confidence	
  intervals.	
  Sample	
  contains	
  firms	
  in	
  BOS	
  2005-­‐2011	
  
with	
  output	
  measures	
  un?l	
  2012.	
  Observa?ons	
  weighted	
  by	
  BOS	
  sampling	
  weights	
  ?mes	
  predicted	
  output.	
  
14	
  
-6
-4
-2
0
2
4
%
2005 2006 2007 2008 2009 2010 2011 2012
year
all No Yes
RELATIVE	
  MFP	
  GROWTH	
  OVER	
  TIME	
  OF	
  PRODUCT	
  INNOVATORS	
  VS	
  NON-­‐INNOVATORS	
  
Product	
  innovators	
  experience	
  higher	
  MFP	
  growth	
  during	
  economic	
  recovery	
  but	
  
possibly	
  lower	
  growth	
  during	
  economic	
  downtown	
  
Charts	
  show	
  coefficients	
  from	
  OLS	
  regressions	
  of	
  change	
  in	
  2-­‐yr-­‐MA	
  of	
  MFP	
  from	
  year	
  0	
  to	
  t	
  on	
  innova?on	
  in	
  year	
  0.	
  Regressions	
  
include	
  controls	
  for	
  base	
  year	
  and	
  firm	
  characteris?cs.	
  Bars	
  show	
  95%	
  confidence	
  intervals.	
  Sample	
  contains	
  firms	
  in	
  BOS	
  2005-­‐2011	
  
with	
  output	
  measures	
  un?l	
  2012.	
  Observa?ons	
  weighted	
  by	
  BOS	
  sampling	
  weights	
  ?mes	
  predicted	
  output.	
  
15	
  
RELATIVE	
  MFP	
  GROWTH	
  BY	
  YEAR	
  OF	
  PROCESS	
  INNOVATORS	
  VS	
  NON-­‐INNOVATORS	
  
Process	
  innovators	
  appear	
  not	
  to	
  do	
  significantly	
  becer	
  or	
  worse	
  than	
  non-­‐innovators	
  
Charts	
  show	
  coefficients	
  from	
  OLS	
  regressions	
  of	
  change	
  in	
  2-­‐yr-­‐MA	
  of	
  MFP	
  from	
  year	
  0	
  to	
  t	
  on	
  innova?on	
  in	
  year	
  0.	
  Regressions	
  
include	
  controls	
  for	
  base	
  year	
  and	
  firm	
  characteris?cs.	
  Bars	
  show	
  95%	
  confidence	
  intervals.	
  Sample	
  contains	
  firms	
  in	
  BOS	
  2005-­‐2011	
  
with	
  output	
  measures	
  un?l	
  2012.	
  Observa?ons	
  weighted	
  by	
  BOS	
  sampling	
  weights	
  ?mes	
  predicted	
  output.	
  
16	
  
-6
-4
-2
0
2
4%
0 1 2 3 4
years
2005
-6
-4
-2
0
2
4%
0 1 2 3 4
years
2007
-6
-4
-2
0
2
4%
0 1 2 3
years
2009
-6
-4
-2
0
2
4%
0 .2 .4 .6 .8 1
years
2011
Yes No
-10
-5
0
5%
0 1 2 3 4
years
-10
-5
0
5%
0 1 2 3 4
years
-10
-5
0
5%
0 1 2 3
years
-10
-5
0
5%
0 1
years
-6
-4
-2
0
2
4%
2005 2006 2007 2008 2009 2010 2011 2012
year
all No Yes
RELATIVE	
  MFP	
  GROWTH	
  OVER	
  TIME	
  OF	
  PROCESS	
  INNOVATORS	
  VS	
  NON-­‐INNOVATORS	
  
Returns	
  to	
  process	
  innova&on	
  do	
  not	
  vary	
  significantly	
  by	
  year	
  
Charts	
  show	
  coefficients	
  from	
  OLS	
  regressions	
  of	
  change	
  in	
  2-­‐yr-­‐MA	
  of	
  MFP	
  from	
  year	
  0	
  to	
  t	
  on	
  innova?on	
  in	
  year	
  0.	
  Regressions	
  
include	
  controls	
  for	
  base	
  year	
  and	
  firm	
  characteris?cs.	
  Bars	
  show	
  95%	
  confidence	
  intervals.	
  Sample	
  contains	
  firms	
  in	
  BOS	
  2005-­‐2011	
  
with	
  output	
  measures	
  un?l	
  2012.	
  Observa?ons	
  weighted	
  by	
  BOS	
  sampling	
  weights	
  ?mes	
  predicted	
  output.	
  
17	
  
RELATIVE	
  MFP	
  GROWTH	
  BY	
  YEAR	
  OF	
  ORGANISATIONAL	
  INNOVATORS	
  VS	
  NON-­‐INNOVATORS	
  
Similarly	
  returns	
  to	
  organisa&onal	
  innova&on	
  in	
  2009	
  significantly	
  higher	
  but	
  not	
  in	
  
other	
  years	
  	
  
Charts	
  show	
  coefficients	
  from	
  OLS	
  regressions	
  of	
  change	
  in	
  2-­‐yr-­‐MA	
  of	
  MFP	
  from	
  year	
  0	
  to	
  t	
  on	
  innova?on	
  in	
  year	
  0.	
  Regressions	
  
include	
  controls	
  for	
  base	
  year	
  and	
  firm	
  characteris?cs.	
  Bars	
  show	
  95%	
  confidence	
  intervals.	
  Sample	
  contains	
  firms	
  in	
  BOS	
  2005-­‐2011	
  
with	
  output	
  measures	
  un?l	
  2012.	
  Observa?ons	
  weighted	
  by	
  BOS	
  sampling	
  weights	
  ?mes	
  predicted	
  output.	
  
18	
  
-6
-4
-2
0
2
4%
0 1 2 3 4
years
2005
-6
-4
-2
0
2
4%
0 1 2 3 4
years
2007
-6
-4
-2
0
2
4%
0 1 2 3
years
2009
-6
-4
-2
0
2
4%
0 .2 .4 .6 .8 1
years
2011
Yes No
-4
-2
0
2
4
6
%
0 1 2 3 4
years
-4
-2
0
2
4
6
%
0 1 2 3 4
years
-4
-2
0
2
4
6
%
0 1 2 3
years
-4
-2
0
2
4
6
%
0 1
years
-6
-4
-2
0
2
4%
2005 2006 2007 2008 2009 2010 2011 2012
year
all No Yes
RELATIVE	
  MFP	
  GROWTH	
  OVER	
  TIME	
  OF	
  ORGANISATIONAL	
  INNOVATORS	
  VS	
  NON-­‐INNOVATORS	
  
Firms	
  doing	
  organisa&onal	
  innova&on	
  during	
  economic	
  downturn	
  experience	
  
significantly	
  higher	
  returns	
  during	
  economic	
  recovery	
  
Charts	
  show	
  coefficients	
  from	
  OLS	
  regressions	
  of	
  change	
  in	
  2-­‐yr-­‐MA	
  of	
  MFP	
  from	
  year	
  0	
  to	
  t	
  on	
  innova?on	
  in	
  year	
  0.	
  Regressions	
  
include	
  controls	
  for	
  base	
  year	
  and	
  firm	
  characteris?cs.	
  Bars	
  show	
  95%	
  confidence	
  intervals.	
  Sample	
  contains	
  firms	
  in	
  BOS	
  2005-­‐2011	
  
with	
  output	
  measures	
  un?l	
  2012.	
  Observa?ons	
  weighted	
  by	
  BOS	
  sampling	
  weights	
  ?mes	
  predicted	
  output.	
  
19	
  
RELATIVE	
  MFP	
  GROWTH	
  BY	
  YEAR	
  OF	
  MARKETING	
  INNOVATORS	
  VS	
  NON-­‐INNOVATORS	
  
By	
  contrast,	
  marke&ng	
  innovators	
  in	
  2005	
  experienced	
  lower	
  produc&vity	
  growth	
  but	
  
in	
  2007	
  experienced	
  higher	
  growth	
  
Charts	
  show	
  coefficients	
  from	
  OLS	
  regressions	
  of	
  change	
  in	
  2-­‐yr-­‐MA	
  of	
  MFP	
  from	
  year	
  0	
  to	
  t	
  on	
  innova?on	
  in	
  year	
  0.	
  Regressions	
  
include	
  controls	
  for	
  base	
  year	
  and	
  firm	
  characteris?cs.	
  Bars	
  show	
  95%	
  confidence	
  intervals.	
  Sample	
  contains	
  firms	
  in	
  BOS	
  2005-­‐2011	
  
with	
  output	
  measures	
  un?l	
  2012.	
  Observa?ons	
  weighted	
  by	
  BOS	
  sampling	
  weights	
  ?mes	
  predicted	
  output.	
  
20	
  
-10
-5
0
5%
0 1 2 3 4
years
2005
-10
-5
0
5%
0 1 2 3 4
years
2007
-10
-5
0
5%
0 1 2 3
years
2009
-10
-5
0
5%
0 .2 .4 .6 .8 1
years
2011
Yes No
-10
-5
0
5
10
15
%
0 1 2 3 4
years
-10
-5
0
5
10
15
%
0 1 2 3 4
years
-10
-5
0
5
10
15
%
0 1 2 3
years
-10
-5
0
5
10
15
%
0 1
years
-10
-5
0
5%
2005 2006 2007 2008 2009 2010 2011 2012
year
all No Yes
RELATIVE	
  MFP	
  GROWTH	
  OVER	
  TIME	
  OF	
  MARKETING	
  INNOVATORS	
  VS	
  NON-­‐INNOVATORS	
  
Firms	
  that	
  had	
  introduced	
  marke&ng	
  innova&on	
  did	
  significantly	
  becer	
  during	
  
economic	
  downturn	
  
Charts	
  show	
  coefficients	
  from	
  OLS	
  regressions	
  of	
  change	
  in	
  2-­‐yr-­‐MA	
  of	
  MFP	
  from	
  year	
  0	
  to	
  t	
  on	
  innova?on	
  in	
  year	
  0.	
  Regressions	
  
include	
  controls	
  for	
  base	
  year	
  and	
  firm	
  characteris?cs.	
  Bars	
  show	
  95%	
  confidence	
  intervals.	
  Sample	
  contains	
  firms	
  in	
  BOS	
  2005-­‐2011	
  
with	
  output	
  measures	
  un?l	
  2012.	
  Observa?ons	
  weighted	
  by	
  BOS	
  sampling	
  weights	
  ?mes	
  predicted	
  output.	
  
21	
  
-20
-10
0
10%
0 1 2 3 4
years
2005
0 1 2 3 4
years
2007
0 1 2 3
years
2009
0 .2 .4 .6 .8 1
years
2011
new to world new only to NZ new only to firm not new
RELATIVE	
  MFP	
  GROWTH	
  BY	
  YEAR	
  OF	
  PRODUCT	
  INNOVATORS	
  BY	
  NOVELTY	
  OF	
  PRODUCT	
  
Innova&on	
  followers	
  did	
  becer	
  than	
  innova&on	
  leaders	
  in	
  2005	
  &	
  2007	
  but	
  innova&on	
  
leaders	
  did	
  becer	
  in	
  2009	
  
Charts	
  show	
  coefficients	
  from	
  OLS	
  regressions	
  of	
  change	
  in	
  2-­‐yr-­‐MA	
  of	
  MFP	
  from	
  year	
  0	
  to	
  t	
  on	
  innova?on	
  in	
  year	
  0.	
  Regressions	
  
include	
  controls	
  for	
  base	
  year	
  and	
  firm	
  characteris?cs.	
  Bars	
  show	
  95%	
  confidence	
  intervals.	
  Sample	
  contains	
  firms	
  in	
  BOS	
  2005-­‐2011	
  
with	
  output	
  measures	
  un?l	
  2012.	
  Observa?ons	
  weighted	
  by	
  BOS	
  sampling	
  weights	
  ?mes	
  predicted	
  output.	
  
22	
  
-10
-5
0
5
10%
2005 2006 2007 2008 2009 2010 2011 2012
year
all new to world new only to NZ new only to firm not new
RELATIVE	
  MFP	
  GROWTH	
  OVER	
  TIME	
  OF	
  PRODUCT	
  INNOVATORS	
  BY	
  NOVELTY	
  OF	
  PRODUCT	
  
Innova&on	
  followers	
  performed	
  becer	
  during	
  economic	
  downtown	
  but	
  innova&on	
  
leaders	
  performed	
  becer	
  during	
  the	
  recovery	
  
Charts	
  show	
  coefficients	
  from	
  OLS	
  regressions	
  of	
  change	
  in	
  2-­‐yr-­‐MA	
  of	
  MFP	
  from	
  year	
  0	
  to	
  t	
  on	
  innova?on	
  in	
  year	
  0.	
  Regressions	
  
include	
  controls	
  for	
  base	
  year	
  and	
  firm	
  characteris?cs.	
  Bars	
  show	
  95%	
  confidence	
  intervals.	
  Sample	
  contains	
  firms	
  in	
  BOS	
  2005-­‐2011	
  
with	
  output	
  measures	
  un?l	
  2012.	
  Observa?ons	
  weighted	
  by	
  BOS	
  sampling	
  weights	
  ?mes	
  predicted	
  output.	
  
23	
  
-20
-10
0
10
20%
0-5
yrs
5-10
yrs
10-20
yrs
20-50
yrs
50+
yrs
age
R&D
activity
Product
innovation
Process
innovation
Organisational
innovation
Marketing
innovation
Younger	
  firms	
  experience	
  highest	
  boost	
  in	
  produc&vity	
  growth	
  following	
  innova&on	
  
RELATIVE	
  CHANGE	
  IN	
  MFP	
  OVER	
  3	
  YEARS	
  BY	
  INNOVATION	
  TYPE	
  &	
  AGE	
  
24	
  
Charts	
  show	
  difference	
  in	
  predic?ve	
  margins	
  from	
  series	
  of	
  OLS	
  regressions	
  of	
  change	
  in	
  3-­‐yr	
  MA	
  of	
  MFP	
  from	
  year	
  0	
  to	
  year	
  t	
  on	
  
innova?on	
  in	
  year	
  0	
  interacted	
  with	
  firm	
  characteris?cs	
  and	
  controls	
  for	
  base	
  year.	
  Bars	
  show	
  95%	
  confidence	
  intervals.	
  Sample	
  contains	
  
firms	
  in	
  BOS	
  2005-­‐2011	
  with	
  output	
  measures	
  un?l	
  2012.	
  Observa?ons	
  weighted	
  by	
  BOS	
  sampling	
  weights	
  ?mes	
  predicted	
  output.	
  
-10
-5
0
5
10%
0-20 20-50 50-100 100+
total employment
R&D
activity
Product
innovation
new to world
Product
innovation
Process
innovation
Organisational
innovation
Marketing
innovation
Small-­‐to-­‐medium	
  size	
  firms	
  appear	
  to	
  do	
  worse	
  if	
  they	
  innovate	
  	
  
RELATIVE	
  CHANGE	
  IN	
  MFP	
  OVER	
  3	
  YEARS	
  BY	
  INNOVATION	
  TYPE	
  &	
  FIRM	
  SIZE	
  
25	
  
Charts	
  show	
  difference	
  in	
  predic?ve	
  margins	
  from	
  series	
  of	
  OLS	
  regressions	
  of	
  change	
  in	
  3-­‐yr	
  MA	
  of	
  MFP	
  from	
  year	
  0	
  to	
  year	
  t	
  on	
  
innova?on	
  in	
  year	
  0	
  interacted	
  with	
  firm	
  characteris?cs	
  and	
  controls	
  for	
  base	
  year.	
  Bars	
  show	
  95%	
  confidence	
  intervals.	
  Sample	
  contains	
  
firms	
  in	
  BOS	
  2005-­‐2011	
  with	
  output	
  measures	
  un?l	
  2012.	
  Observa?ons	
  weighted	
  by	
  BOS	
  sampling	
  weights	
  ?mes	
  predicted	
  output.	
  
-20
-10
0
10
20%
Primary Manufacturing Services
sector
R&D
activity
Product
innovation
new to world
Product
innovation
Process
innovation
Organisational
innovation
Marketing
innovation
Firms	
  in	
  manufacturing	
  sector	
  experience	
  strongest	
  impact	
  of	
  innova&on	
  on	
  MFP	
  
growth	
  
RELATIVE	
  CHANGE	
  IN	
  MFP	
  OVER	
  3	
  YEARS	
  BY	
  INNOVATION	
  TYPE	
  &	
  SECTOR	
  
26	
  
Charts	
  show	
  difference	
  in	
  predic?ve	
  margins	
  from	
  series	
  of	
  OLS	
  regressions	
  of	
  change	
  in	
  3-­‐yr	
  MA	
  of	
  MFP	
  from	
  year	
  0	
  to	
  year	
  t	
  on	
  
innova?on	
  in	
  year	
  0	
  interacted	
  with	
  firm	
  characteris?cs	
  and	
  controls	
  for	
  base	
  year.	
  Bars	
  show	
  95%	
  confidence	
  intervals.	
  Sample	
  contains	
  
firms	
  in	
  BOS	
  2005-­‐2011	
  with	
  output	
  measures	
  un?l	
  2012.	
  Observa?ons	
  weighted	
  by	
  BOS	
  sampling	
  weights	
  ?mes	
  predicted	
  output.	
  
-20
-10
0
10
20%
NZ-owned domestic foreign-owned domestic international
level of internationalisation
R&D
activity
Product
innovation
new to world
Product
innovation
Process
innovation
Organisational
innovation
Marketing
innovation
Interna&onally	
  connected	
  firms	
  engaged	
  in	
  product	
  or	
  organisa&onal	
  innova&on	
  
experience	
  higher	
  MFP	
  growth,	
  while	
  domes&c	
  firms	
  have	
  lower	
  growth	
  
RELATIVE	
  CHANGE	
  IN	
  MFP	
  OVER	
  3	
  YEARS	
  BY	
  INNOVATION	
  TYPE	
  &	
  INTERNATIONAL	
  FOCUS	
  
27	
  
Charts	
  show	
  difference	
  in	
  predic?ve	
  margins	
  from	
  series	
  of	
  OLS	
  regressions	
  of	
  change	
  in	
  3-­‐yr	
  MA	
  of	
  MFP	
  from	
  year	
  0	
  to	
  year	
  t	
  on	
  
innova?on	
  in	
  year	
  0	
  interacted	
  with	
  firm	
  characteris?cs	
  and	
  controls	
  for	
  base	
  year.	
  Bars	
  show	
  95%	
  confidence	
  intervals.	
  Sample	
  contains	
  
firms	
  in	
  BOS	
  2005-­‐2011	
  with	
  output	
  measures	
  un?l	
  2012.	
  Observa?ons	
  weighted	
  by	
  BOS	
  sampling	
  weights	
  ?mes	
  predicted	
  output.	
  
Innova&on	
  macers	
  for	
  produc&vity,	
  but	
  more	
  for	
  some	
  firms	
  than	
  others	
  
FINDINGS	
  
•  R&D	
  and	
  innovaCon	
  associated	
  with	
  growth	
  in	
  size	
  but	
  not	
  necessarily	
  with	
  producCvity	
  
•  Firms	
  doing	
  markeCng	
  innovaCon	
  show	
  clearest	
  returns	
  overall,	
  especially	
  in	
  2007-­‐2009	
  
(economic	
  downturn)	
  
•  Firms	
  doing	
  product	
  and	
  organisaConal	
  innovaCon	
  performed	
  beeer	
  afer	
  2009	
  (economy	
  
recovery),	
  but	
  possibly	
  worse	
  before	
  
•  Younger	
  firms,	
  manufacturing	
  firms,	
  and	
  firms	
  with	
  internaConal	
  connecCons	
  have	
  highest	
  
returns	
  to	
  innovaCon	
  
CONCLUSIONS	
  
•  More	
  to	
  innovaCon	
  than	
  R&D	
  
•  Non-­‐technological-­‐types	
  of	
  innovaCon	
  maeer	
  as	
  much	
  if	
  not	
  more	
  
•  Market	
  condiCons	
  important	
  
•  Some	
  types	
  of	
  firms	
  get	
  more	
  value	
  out	
  of	
  innovaCon	
  than	
  others	
  
For	
  more	
  informa&on	
  
www.produc&vity.govt.nz	
  	
  
@Nzprocom	
  
28	
  

20160714 StrategyNZ - One-day Workshop - Simon Wakeman Powerpoint(2016)

  • 1.
    Innova&on  &  the  performance  of     New  Zealand  firms   Simon  Wakeman   NZAE  conference   1  July  2016   1  
  • 2.
    Low  investment  in  knowledge-­‐based  capital  may  explain  up  to  40%  of  the   produc&vity  gap  rela&ve  to  the  OECD  average   2   Source:  NZPC;  de  Serres  et  al.  (2014)  
  • 3.
    Interna&onal  comparisons  show  NZ  near  top  of  OECD  rankings  in  genera&ng  science   but  lower  ranked  in  commercialising  innova&on   NZ’S  AVERAGE  RANKING  IN  TOP-­‐LEVEL  CATEGORIES  OF  OECD  STATISTICS   3   7   11   12   20   19   26   Science  base   Human  resources   Internet  use  for   innovaCon   Business  R&D  and   innovaCon   Knowledge  flows   and   commercialisaCon   Entrepreneurship   Source:  OECD  (2012).  Compara?ve  performance  of  na?onal  science  and  innova?on  systems  
  • 4.
    Use  Sta&s&cs  NZ’s  Longitudinal  Business  Database  to  study  rela&onship  between   innova&on  and  produc&vity  for  New  Zealand  firms   DATA  SOURCES   Innova&on  ac&vity   - Business  Opera?ons  Survey  (BOS)   - Intellectual  Property  Office  (IPONZ)   Produc&vity  es&mates    (Fabling  &  Mare,  2015)   Financial  data   - Annual  Enterprise  Survey  (AES)   - IR10  tax  returns   Access  to  the  data  presented  was  managed  by  Sta?s?cs  New  Zealand  under  strict  micro-­‐data  access  protocols   and  in  accordance  with  the  security  and  confiden?ality  provisions  of  the  Sta?s?c  Act  1975.  These  findings  are   not  Official  Sta?s?cs.  The  opinions,  findings,  recommenda?ons,  and  conclusions  expressed  are  those  of  the   author/researcher,  not  Sta?s?cs  New  Zealand  or  the  New  Zealand  Produc?vity  Commission.   Longitudinal   Business   Database   R&D  ac&vity   - Business  R&D  Survey   - Business  Opera?ons  Survey  (BOS)   Government  assistance   - Payments  from  government   programmes  (incl.  R&D  grants)  
  • 5.
    LBD  contains  a  range  of  measures  reflec&ng  different  aspects  of  innova&on   MEASURES  OF  INNOVATIVE  ACTIVITY   5   Sample  contains  responses  to  Business  Opera?ons  Survey  (2005-­‐2013).   0.0%   1.0%   2.0%   3.0%   4.0%   5.0%   6.0%   7.0%   8.0%   9.0%   10.0%   0%   5%   10%   15%   20%   25%   30%   35%   40%   45%   Engaged  in  R&D   Product  development  expenditure  (R&D/design/ markeCng/other)   Filed  patent   Registered  trademark   Any  innovaCon   Product  innovaCon   (new  to  world/NZ/firm)   Sales  from  new  products   Process  innovaCon   OrganisaConal  innovaCon   MarkeCng  innovaCon   %  total  expenditure/sales   %  firms  engaged  in  ac&vity    
  • 6.
    R&D  expenditure  is  not  a  good  proxy  for  innova&on  output  in  all  cases   R&D  ACTIVITY  VS  INNOVATION  ACTIVITY                       TYPE  OF  INNOVATION  EXPENDITURE  BY  SECTOR                       6   Ever  engaged  in   innovaCon       No   Yes   Ever  engaged   in  R&D    No     27.5%   54.7%    Yes     1.5%   16.3%   Sample  contains  firms  responding  to  Business  Opera?ons  Survey  Innova?on  module  in  2007,  2009  &  2011.   Sample  contains  firms  responding  to  Business  Opera?ons  Survey  (2005-­‐2012).   0%   2%   4%   6%   8%   10%   12%   14%   Primary   Manufacturing   Services   R&D  expenditure   Design  expenditure   MarkeCng  expenditure   Other  expenditure  
  • 7.
    Use  approach  developed  by  Fabling  &  Mare  (2015)  to  es&mate  firm  produc&vity   MEASURING  FIRM  PERFORMANCE   7   Labour   (L)   Raw  materials/   inputs  (M)   Capital  (K)   ProducCon   Output   (GO)   ( ) ( ) ( ) ( )ln   ln ln ln   where   , { , , } r r s it j r it rs it i r s r t i r G O X X X r s L K M α β δ γ ε ≠ += + + + ∈ ∑ ∑∑ ( )∑ ( ) ( ) ( )MFP: Empl  ln( oyment:   Valued  added:   Labour  productivity  ln ln ln ln where   , { , , } :   ) it it it it it it r r s it it r it rs it it rr s r GO GO MFP GO X X X r s L K M L M M L β δ ≠ − ∈ − − − = ∑∑ ∑
  • 8.
    0 20 40 60 80 % dif Employment Value-addedoutput Labour productivity MFP output type R&D activity Product innovation new to world Product innovation Process innovation Organisational innovation Marketing innovation RELATIVE  OUTPUT  LEVEL  INNOVATORS  VS.  NON-­‐INNOVATORS  BY  INNOVATION  MEASURE   On  average  innova&ng  firms  larger  but  less  produc&ve  than  non-­‐innova&ng  firms  in  year   in  which  innova&on  occurs   8   Chart  shows  difference  in  performance  measure  predicted  from  series  of  OLS  regressions  of  output  level  in  year  0  on  innova?on  in   year  0  with  controls  for  year  and  industry.  Bars  show  95%  confidence  intervals.  Sample  contains  firms  in  BOS  2005-­‐2011  with   performance  measures  up  to  2012.  Observa?ons  weighted  by  BOS  sampling  weights.  
  • 9.
    0 10 20 30 % 1 2 34 5 6 7 8 9 10 decile of mfp Product innovation (new to world) 1 2 3 4 5 6 7 8 9 10 decile of mfp Product innovation (new to NZ) 1 2 3 4 5 6 7 8 9 10 decile of mfp Product innovation (new to the firm) 1 2 3 4 5 6 7 8 9 10 decile of mfp Process innovation 1 2 3 4 5 6 7 8 9 10 decile of mfp Organisational innovation 1 2 3 4 5 6 7 8 9 10 decile of mfp Marketing innovation PROPORTION  OF  FIRMS  ENGAGED  IN  INNOVATION  BY  DECILE  OF  PRODUCTIVITY  IN  YEAR  0   Most  produc&ve  firms  least  likely  to  innovate   9   Chart  shows  likelihood  of  firm  innova?on  predicted  from  probit  regression  of  innova?on  ac?vity  in  year  0  on  produc?vity  decile  in   year  0.  Bars  show  95%  confidence  intervals.  Sample  contains  firms  in  BOS  2005-­‐2011.  Observa?ons  weighted  by  BOS  sampling   weights  
  • 10.
    Use  difference-­‐in-­‐differences  approach  to  measure  impact  of  innova&on  on   produc&vity   EMPIRICAL  APPROACH   •  Regress  change  in  firm  output/producCvity  (lnYin  -­‐  lnYi0)  on  innovaCon  in  year  0  (I0)   10   0 0 0ln –ln              in i I i X iY Y I X tα β β ε= + + + + •  Compare  within-­‐firm  differences  in  output   ! controls  for  unobserved  firm  characterisCcs   affecCng  output  levels   •  Control  for  observed  firm  characterisCcs  (age,   size,  industry,  etc.)   ! controls  for  observed  firm  characterisCcs   affecCng  changes  in  output   •  For  MFP,  use  2-­‐year  moving  average   ! accounts  for  measurement  error   •  Weight  observaCons  by  BOS  sampling   weights  Cmes  predicted  gross  output   ! quanCCes  corresponds  to  aggregate   economic  output/producCvity   •  Do  not  instrument  for  innovaCon  (cf  Crepon,   Duguet  &  Mairesse,  1998)      
  • 11.
    -6 -4 -2 0 2 4% 0 1 23 4 years change in employment -6 -4 -2 0 2 4% 0 1 2 3 4 years change in value-added output -6 -4 -2 0 2 4% 0 1 2 3 4 years change in labour productivity -6 -4 -2 0 2 4% 0 1 2 3 4 years change in MFP Yes No -10 0 10 20% 0 1 2 3 4 years -10 0 10 20% 0 1 2 3 4 years -10 0 10 20% 0 1 2 3 4 years -10 0 10 20% 0 1 2 3 4 years RELATIVE  GROWTH  BY  OUTPUT  TYPE  OF  R&D  ACTIVE  VS  NON-­‐ACTIVE  FIRMS   Firms  engaged  in  R&D  ac&vity  have  faster  employment  and  output  growth  than   non-­‐R&D-­‐ac&ve  firms  but  produc&vity  growth  not  different   Charts  show  difference  in  predic?ve  margins  from  series  of  OLS  regressions  of  change  in  output  from  year  0  to  year  t  on  innova?on   in  year  0.  Regressions  include  controls  for  base  year  and  firm  characteris?cs.  Bars  show  95%  confidence  intervals.  Sample  contains   firms  in  BOS  2005-­‐2011  with  output  measures  un?l  2012.  Observa?ons  weighted  by  BOS  sampling  weights  ?mes  predicted  output.   11  
  • 12.
    -4 -2 0 2 4% 0 1 23 4 years change in employment -4 -2 0 2 4% 0 1 2 3 4 years change in value-added output -4 -2 0 2 4% 0 1 2 3 4 years change in labour productivity -4 -2 0 2 4% 0 1 2 3 4 years change in MFP Yes No -10 -5 0 5 10 % 0 1 2 3 4 years -10 -5 0 5 10 % 0 1 2 3 4 years -10 -5 0 5 10 % 0 1 2 3 4 years -10 -5 0 5 10 % 0 1 2 3 4 years RELATIVE  GROWTH  BY  INNOVATION  ACTIVITY  OF  INNOVATORS  VS  NON-­‐INNOVATORS   Similarly  firms  engaged  in  innova&on  grow  faster  in  size  but  not  produc&vity   Charts  show  difference  in  predic?ve  margins  from  series  of  OLS  regressions  of  change  in  output  from  year  0  to  year  t  on  innova?on   in  year  0.  Regressions  include  controls  for  base  year  and  firm  characteris?cs.  Bars  show  95%  confidence  intervals.  Sample  contains   firms  in  BOS  2005-­‐2011  with  output  measures  un?l  2012.  Observa?ons  weighted  by  BOS  sampling  weights  ?mes  predicted  output.   12  
  • 13.
    -6 -4 -2 0 2% 0 1 23 4 years Product innovation -6 -4 -2 0 2% 0 1 2 3 4 years Process innovation -6 -4 -2 0 2% 0 1 2 3 4 years Organisational innovation -6 -4 -2 0 2% 0 1 2 3 4 years Marketing innovation Yes No -4 -2 0 2 4 % 0 1 2 3 4 years -4 -2 0 2 4 % 0 1 2 3 4 years -4 -2 0 2 4 % 0 1 2 3 4 years -4 -2 0 2 4 % 0 1 2 3 4 years RELATIVE  MFP  GROWTH  BY  INNOVATION  TYPE  OF  INNOVATORS  VS  NON-­‐INNOVATORS   Only  firms  engaged  in  marke&ng  innova&on  experience  significantly  higher   produc&vity  growth   Charts  show  coefficients  from  OLS  regressions  of  change  in  2-­‐yr-­‐MA  of  MFP  from  year  0  to  t  on  innova?on  in  year  0.  Regressions   include  controls  for  base  year  and  firm  characteris?cs.  Bars  show  95%  confidence  intervals.  Sample  contains  firms  in  BOS  2005-­‐2011   with  output  measures  un?l  2012.  Observa?ons  weighted  by  BOS  sampling  weights  ?mes  predicted  output.   13  
  • 14.
    -6 -4 -2 0 2 4 % 0 1 23 4 years 2005 -6 -4 -2 0 2 4 % 0 1 2 3 4 years 2007 -6 -4 -2 0 2 4 % 0 1 2 3 years 2009 -6 -4 -2 0 2 4 % 0 .2 .4 .6 .8 1 years 2011 Yes No -5 0 5 10% 0 1 2 3 4 years -5 0 5 10% 0 1 2 3 4 years -5 0 5 10% 0 1 2 3 years -5 0 5 10% 0 1 years RELATIVE  MFP  GROWTH  BY  YEAR  OF  PRODUCT  INNOVATORS  VS  NON-­‐INNOVATORS   Returns  to  innova&on  vary  drama&cally  by  year   Charts  show  coefficients  from  OLS  regressions  of  change  in  2-­‐yr-­‐MA  of  MFP  from  year  0  to  t  on  innova?on  in  year  0.  Regressions   include  controls  for  base  year  and  firm  characteris?cs.  Bars  show  95%  confidence  intervals.  Sample  contains  firms  in  BOS  2005-­‐2011   with  output  measures  un?l  2012.  Observa?ons  weighted  by  BOS  sampling  weights  ?mes  predicted  output.   14  
  • 15.
    -6 -4 -2 0 2 4 % 2005 2006 20072008 2009 2010 2011 2012 year all No Yes RELATIVE  MFP  GROWTH  OVER  TIME  OF  PRODUCT  INNOVATORS  VS  NON-­‐INNOVATORS   Product  innovators  experience  higher  MFP  growth  during  economic  recovery  but   possibly  lower  growth  during  economic  downtown   Charts  show  coefficients  from  OLS  regressions  of  change  in  2-­‐yr-­‐MA  of  MFP  from  year  0  to  t  on  innova?on  in  year  0.  Regressions   include  controls  for  base  year  and  firm  characteris?cs.  Bars  show  95%  confidence  intervals.  Sample  contains  firms  in  BOS  2005-­‐2011   with  output  measures  un?l  2012.  Observa?ons  weighted  by  BOS  sampling  weights  ?mes  predicted  output.   15  
  • 16.
    RELATIVE  MFP  GROWTH  BY  YEAR  OF  PROCESS  INNOVATORS  VS  NON-­‐INNOVATORS   Process  innovators  appear  not  to  do  significantly  becer  or  worse  than  non-­‐innovators   Charts  show  coefficients  from  OLS  regressions  of  change  in  2-­‐yr-­‐MA  of  MFP  from  year  0  to  t  on  innova?on  in  year  0.  Regressions   include  controls  for  base  year  and  firm  characteris?cs.  Bars  show  95%  confidence  intervals.  Sample  contains  firms  in  BOS  2005-­‐2011   with  output  measures  un?l  2012.  Observa?ons  weighted  by  BOS  sampling  weights  ?mes  predicted  output.   16   -6 -4 -2 0 2 4% 0 1 2 3 4 years 2005 -6 -4 -2 0 2 4% 0 1 2 3 4 years 2007 -6 -4 -2 0 2 4% 0 1 2 3 years 2009 -6 -4 -2 0 2 4% 0 .2 .4 .6 .8 1 years 2011 Yes No -10 -5 0 5% 0 1 2 3 4 years -10 -5 0 5% 0 1 2 3 4 years -10 -5 0 5% 0 1 2 3 years -10 -5 0 5% 0 1 years
  • 17.
    -6 -4 -2 0 2 4% 2005 2006 20072008 2009 2010 2011 2012 year all No Yes RELATIVE  MFP  GROWTH  OVER  TIME  OF  PROCESS  INNOVATORS  VS  NON-­‐INNOVATORS   Returns  to  process  innova&on  do  not  vary  significantly  by  year   Charts  show  coefficients  from  OLS  regressions  of  change  in  2-­‐yr-­‐MA  of  MFP  from  year  0  to  t  on  innova?on  in  year  0.  Regressions   include  controls  for  base  year  and  firm  characteris?cs.  Bars  show  95%  confidence  intervals.  Sample  contains  firms  in  BOS  2005-­‐2011   with  output  measures  un?l  2012.  Observa?ons  weighted  by  BOS  sampling  weights  ?mes  predicted  output.   17  
  • 18.
    RELATIVE  MFP  GROWTH  BY  YEAR  OF  ORGANISATIONAL  INNOVATORS  VS  NON-­‐INNOVATORS   Similarly  returns  to  organisa&onal  innova&on  in  2009  significantly  higher  but  not  in   other  years     Charts  show  coefficients  from  OLS  regressions  of  change  in  2-­‐yr-­‐MA  of  MFP  from  year  0  to  t  on  innova?on  in  year  0.  Regressions   include  controls  for  base  year  and  firm  characteris?cs.  Bars  show  95%  confidence  intervals.  Sample  contains  firms  in  BOS  2005-­‐2011   with  output  measures  un?l  2012.  Observa?ons  weighted  by  BOS  sampling  weights  ?mes  predicted  output.   18   -6 -4 -2 0 2 4% 0 1 2 3 4 years 2005 -6 -4 -2 0 2 4% 0 1 2 3 4 years 2007 -6 -4 -2 0 2 4% 0 1 2 3 years 2009 -6 -4 -2 0 2 4% 0 .2 .4 .6 .8 1 years 2011 Yes No -4 -2 0 2 4 6 % 0 1 2 3 4 years -4 -2 0 2 4 6 % 0 1 2 3 4 years -4 -2 0 2 4 6 % 0 1 2 3 years -4 -2 0 2 4 6 % 0 1 years
  • 19.
    -6 -4 -2 0 2 4% 2005 2006 20072008 2009 2010 2011 2012 year all No Yes RELATIVE  MFP  GROWTH  OVER  TIME  OF  ORGANISATIONAL  INNOVATORS  VS  NON-­‐INNOVATORS   Firms  doing  organisa&onal  innova&on  during  economic  downturn  experience   significantly  higher  returns  during  economic  recovery   Charts  show  coefficients  from  OLS  regressions  of  change  in  2-­‐yr-­‐MA  of  MFP  from  year  0  to  t  on  innova?on  in  year  0.  Regressions   include  controls  for  base  year  and  firm  characteris?cs.  Bars  show  95%  confidence  intervals.  Sample  contains  firms  in  BOS  2005-­‐2011   with  output  measures  un?l  2012.  Observa?ons  weighted  by  BOS  sampling  weights  ?mes  predicted  output.   19  
  • 20.
    RELATIVE  MFP  GROWTH  BY  YEAR  OF  MARKETING  INNOVATORS  VS  NON-­‐INNOVATORS   By  contrast,  marke&ng  innovators  in  2005  experienced  lower  produc&vity  growth  but   in  2007  experienced  higher  growth   Charts  show  coefficients  from  OLS  regressions  of  change  in  2-­‐yr-­‐MA  of  MFP  from  year  0  to  t  on  innova?on  in  year  0.  Regressions   include  controls  for  base  year  and  firm  characteris?cs.  Bars  show  95%  confidence  intervals.  Sample  contains  firms  in  BOS  2005-­‐2011   with  output  measures  un?l  2012.  Observa?ons  weighted  by  BOS  sampling  weights  ?mes  predicted  output.   20   -10 -5 0 5% 0 1 2 3 4 years 2005 -10 -5 0 5% 0 1 2 3 4 years 2007 -10 -5 0 5% 0 1 2 3 years 2009 -10 -5 0 5% 0 .2 .4 .6 .8 1 years 2011 Yes No -10 -5 0 5 10 15 % 0 1 2 3 4 years -10 -5 0 5 10 15 % 0 1 2 3 4 years -10 -5 0 5 10 15 % 0 1 2 3 years -10 -5 0 5 10 15 % 0 1 years
  • 21.
    -10 -5 0 5% 2005 2006 20072008 2009 2010 2011 2012 year all No Yes RELATIVE  MFP  GROWTH  OVER  TIME  OF  MARKETING  INNOVATORS  VS  NON-­‐INNOVATORS   Firms  that  had  introduced  marke&ng  innova&on  did  significantly  becer  during   economic  downturn   Charts  show  coefficients  from  OLS  regressions  of  change  in  2-­‐yr-­‐MA  of  MFP  from  year  0  to  t  on  innova?on  in  year  0.  Regressions   include  controls  for  base  year  and  firm  characteris?cs.  Bars  show  95%  confidence  intervals.  Sample  contains  firms  in  BOS  2005-­‐2011   with  output  measures  un?l  2012.  Observa?ons  weighted  by  BOS  sampling  weights  ?mes  predicted  output.   21  
  • 22.
    -20 -10 0 10% 0 1 23 4 years 2005 0 1 2 3 4 years 2007 0 1 2 3 years 2009 0 .2 .4 .6 .8 1 years 2011 new to world new only to NZ new only to firm not new RELATIVE  MFP  GROWTH  BY  YEAR  OF  PRODUCT  INNOVATORS  BY  NOVELTY  OF  PRODUCT   Innova&on  followers  did  becer  than  innova&on  leaders  in  2005  &  2007  but  innova&on   leaders  did  becer  in  2009   Charts  show  coefficients  from  OLS  regressions  of  change  in  2-­‐yr-­‐MA  of  MFP  from  year  0  to  t  on  innova?on  in  year  0.  Regressions   include  controls  for  base  year  and  firm  characteris?cs.  Bars  show  95%  confidence  intervals.  Sample  contains  firms  in  BOS  2005-­‐2011   with  output  measures  un?l  2012.  Observa?ons  weighted  by  BOS  sampling  weights  ?mes  predicted  output.   22  
  • 23.
    -10 -5 0 5 10% 2005 2006 20072008 2009 2010 2011 2012 year all new to world new only to NZ new only to firm not new RELATIVE  MFP  GROWTH  OVER  TIME  OF  PRODUCT  INNOVATORS  BY  NOVELTY  OF  PRODUCT   Innova&on  followers  performed  becer  during  economic  downtown  but  innova&on   leaders  performed  becer  during  the  recovery   Charts  show  coefficients  from  OLS  regressions  of  change  in  2-­‐yr-­‐MA  of  MFP  from  year  0  to  t  on  innova?on  in  year  0.  Regressions   include  controls  for  base  year  and  firm  characteris?cs.  Bars  show  95%  confidence  intervals.  Sample  contains  firms  in  BOS  2005-­‐2011   with  output  measures  un?l  2012.  Observa?ons  weighted  by  BOS  sampling  weights  ?mes  predicted  output.   23  
  • 24.
    -20 -10 0 10 20% 0-5 yrs 5-10 yrs 10-20 yrs 20-50 yrs 50+ yrs age R&D activity Product innovation Process innovation Organisational innovation Marketing innovation Younger  firms  experience  highest  boost  in  produc&vity  growth  following  innova&on   RELATIVE  CHANGE  IN  MFP  OVER  3  YEARS  BY  INNOVATION  TYPE  &  AGE   24   Charts  show  difference  in  predic?ve  margins  from  series  of  OLS  regressions  of  change  in  3-­‐yr  MA  of  MFP  from  year  0  to  year  t  on   innova?on  in  year  0  interacted  with  firm  characteris?cs  and  controls  for  base  year.  Bars  show  95%  confidence  intervals.  Sample  contains   firms  in  BOS  2005-­‐2011  with  output  measures  un?l  2012.  Observa?ons  weighted  by  BOS  sampling  weights  ?mes  predicted  output.  
  • 25.
    -10 -5 0 5 10% 0-20 20-50 50-100100+ total employment R&D activity Product innovation new to world Product innovation Process innovation Organisational innovation Marketing innovation Small-­‐to-­‐medium  size  firms  appear  to  do  worse  if  they  innovate     RELATIVE  CHANGE  IN  MFP  OVER  3  YEARS  BY  INNOVATION  TYPE  &  FIRM  SIZE   25   Charts  show  difference  in  predic?ve  margins  from  series  of  OLS  regressions  of  change  in  3-­‐yr  MA  of  MFP  from  year  0  to  year  t  on   innova?on  in  year  0  interacted  with  firm  characteris?cs  and  controls  for  base  year.  Bars  show  95%  confidence  intervals.  Sample  contains   firms  in  BOS  2005-­‐2011  with  output  measures  un?l  2012.  Observa?ons  weighted  by  BOS  sampling  weights  ?mes  predicted  output.  
  • 26.
    -20 -10 0 10 20% Primary Manufacturing Services sector R&D activity Product innovation newto world Product innovation Process innovation Organisational innovation Marketing innovation Firms  in  manufacturing  sector  experience  strongest  impact  of  innova&on  on  MFP   growth   RELATIVE  CHANGE  IN  MFP  OVER  3  YEARS  BY  INNOVATION  TYPE  &  SECTOR   26   Charts  show  difference  in  predic?ve  margins  from  series  of  OLS  regressions  of  change  in  3-­‐yr  MA  of  MFP  from  year  0  to  year  t  on   innova?on  in  year  0  interacted  with  firm  characteris?cs  and  controls  for  base  year.  Bars  show  95%  confidence  intervals.  Sample  contains   firms  in  BOS  2005-­‐2011  with  output  measures  un?l  2012.  Observa?ons  weighted  by  BOS  sampling  weights  ?mes  predicted  output.  
  • 27.
    -20 -10 0 10 20% NZ-owned domestic foreign-owneddomestic international level of internationalisation R&D activity Product innovation new to world Product innovation Process innovation Organisational innovation Marketing innovation Interna&onally  connected  firms  engaged  in  product  or  organisa&onal  innova&on   experience  higher  MFP  growth,  while  domes&c  firms  have  lower  growth   RELATIVE  CHANGE  IN  MFP  OVER  3  YEARS  BY  INNOVATION  TYPE  &  INTERNATIONAL  FOCUS   27   Charts  show  difference  in  predic?ve  margins  from  series  of  OLS  regressions  of  change  in  3-­‐yr  MA  of  MFP  from  year  0  to  year  t  on   innova?on  in  year  0  interacted  with  firm  characteris?cs  and  controls  for  base  year.  Bars  show  95%  confidence  intervals.  Sample  contains   firms  in  BOS  2005-­‐2011  with  output  measures  un?l  2012.  Observa?ons  weighted  by  BOS  sampling  weights  ?mes  predicted  output.  
  • 28.
    Innova&on  macers  for  produc&vity,  but  more  for  some  firms  than  others   FINDINGS   •  R&D  and  innovaCon  associated  with  growth  in  size  but  not  necessarily  with  producCvity   •  Firms  doing  markeCng  innovaCon  show  clearest  returns  overall,  especially  in  2007-­‐2009   (economic  downturn)   •  Firms  doing  product  and  organisaConal  innovaCon  performed  beeer  afer  2009  (economy   recovery),  but  possibly  worse  before   •  Younger  firms,  manufacturing  firms,  and  firms  with  internaConal  connecCons  have  highest   returns  to  innovaCon   CONCLUSIONS   •  More  to  innovaCon  than  R&D   •  Non-­‐technological-­‐types  of  innovaCon  maeer  as  much  if  not  more   •  Market  condiCons  important   •  Some  types  of  firms  get  more  value  out  of  innovaCon  than  others   For  more  informa&on   www.produc&vity.govt.nz     @Nzprocom   28