Download to read offline
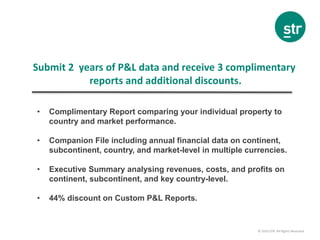


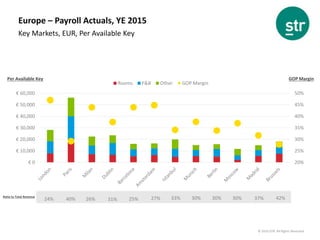
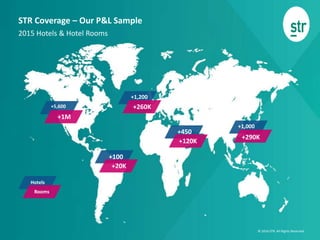


STR offers a profitability program for hotels to compare their financial performance against competitors by submitting two years of P&L data. Participants receive three complimentary reports, including an individual property comparison to market performance and financial summaries at multiple levels. The document also outlines key performance metrics and changes in revenue, costs, and profits for various European and Asia Pacific markets for the year 2015.


