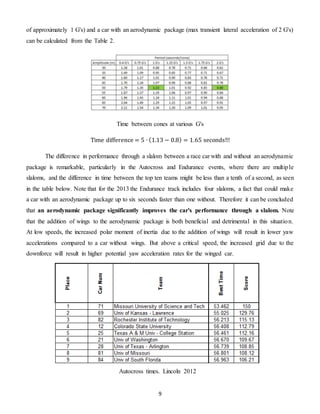
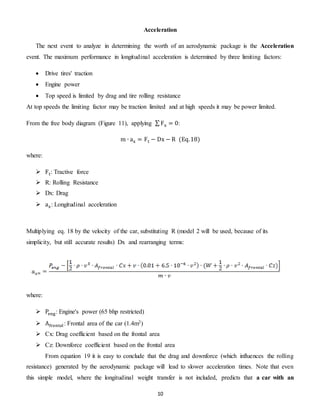
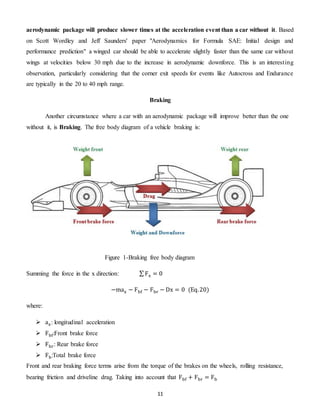
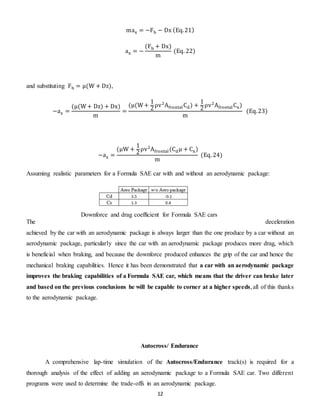
This document discusses how aerodynamics can improve vehicle performance in various racing events by increasing downforce. Downforce pushes the tires into the road, allowing for increased cornering ability without a significant weight penalty. Analysis of the skid pad, slalom, and acceleration events shows that a car with an aerodynamic package could achieve faster lap times by producing higher lateral and transient lateral forces. While drag also increases with downforce, the calculations show the engine power is sufficient to overcome these forces for the speeds in these events. Therefore, an aerodynamic package has the potential to significantly improve performance.
This document outlines the aerodynamic design process for a Formula Student race car. It discusses theory, conceptual wing designs, theoretical lift calculations, and experimental testing. The goal is to prove the benefits of front and rear wings for improving stability, braking, and cornering at low speeds. The design process involves baseline testing, flow visualization, selecting airfoil profiles, sizing wings, and conducting coast down and wind tunnel tests to evaluate downforce. Computational fluid dynamics simulations are also used to analyze pressure and velocity contours. The results will help determine the most effective wing designs for the low speeds of the Formula Student car.
This document discusses the field of aerodynamics and its application to vehicle design. Aerodynamics is the study of forces generated by air in motion or the motion of objects through air. It can be classified as external or internal, and applies to subsonic, supersonic and hypersonic speeds. Aerodynamics is important for vehicle design including automobiles, ships and bridges to reduce drag, lower fuel consumption, and improve vehicle stability and performance especially at higher speeds. The document outlines the historical development of aerodynamic design of vehicles and methods used to study aerodynamics, including computational modeling and wind tunnel testing.
This document discusses aerodynamics in car design and how it can reduce fuel consumption and increase top speed through reducing drag. It explains the key aerodynamic forces of drag, rear suction, lift and downforce and how streamlining a car can lower drag by reducing the wake formed behind a car. It also provides the formula for calculating aerodynamic drag which is influenced by factors like air density, frontal area, and velocity.
four wheel steering configurations with the types of four wheel steering. It also goes through zero turning radius, crab steering, low speed steering and high speed steering.
Antilock braking systems (ABS) monitor and control wheel slip during braking to improve vehicle control and reduce stopping distances. ABS works by limiting wheel slip and minimizing lockup through rapidly modulating brake pressure up to 15 times per second. This prevents wheel locking and maintains stability, with a target slip rate of 10-30%. ABS components include wheel speed sensors, a control module, hydraulic valves to control brake fluid pressure, and an accumulator to store fluid. ABS improves steering control and vehicle stability during braking compared to standard braking systems.
The document provides an overview of techniques for using Abaqus/Explicit for dynamic simulations. It discusses when to use Abaqus/Explicit, applications such as impact and crash simulations, defining the explicit procedure, quasi-static simulations using increased load rates or mass scaling, advanced capabilities like ALE adaptive meshing, and tips for managing large models and reducing CPU time. The presentation covers the basics of explicit dynamics, contact modeling, stable time increments, and evaluating quasi-static solutions.
Full Frontal, 40% & 20% Offset Impact Analysis on Ford Econoline.Vaibhav porwal
Full Frontal, 40%, and 20% impact analysis of Ford Econoline using LS-PrePost and LS-DYNA, including front airbags, side curtain airbag and a seatbelted to reduce the fatal injuries.
The document summarizes a student's final project on studying the frontal impact of a passenger bus. The aim was to simulate frontal impact and recommend safety improvements. The student conducted literature reviews, modeled the bus geometry, generated finite element models, and simulated frontal impact. Results showed peak loads could be reduced by 4% with crush initiators. Future work could involve simulating subsystems and injury parameters to further improve structural safety.
Posters summarizing dissertation research projects to date, presented by MA and MSc students at the Institute for Transport Studies (ITS), University of Leeds, April 2016.
http://bit.ly/1Yq5f8U
www.its.leeds.ac.uk/courses/masters/dissertation
This document is the driver's manual from the Registry of Motor Vehicles (RMV) in Massachusetts. It provides information about obtaining and keeping a driver's license in Massachusetts. It covers topics such as license classes and requirements, how to apply for a learner's permit and road test, license renewals and replacements, and consequences for traffic violations like suspensions or revocations. The introduction encourages readers to use the manual as a resource for interacting with the RMV by phone, website or in person.
This document discusses active suspension systems. It begins by outlining the requirements of a conventional suspension system, then classifies suspension systems as either active, passive, or semi-active. It describes how active suspension systems use actuators like hydraulics, pneumatics, or electromagnetics to control wheel position independently. Active suspension provides advantages like improved handling and ride quality but has higher costs and weight compared to conventional systems. The document concludes by discussing military applications of active suspension and the future potential of the technology.
Stress and fatigue analysis of landing gear axle of a trainer aircrafteSAT Journals
Abstract The undercarriage or landing gear of an aircraft is the structure that supports an aircraft on the ground and allows it to taxi, takeoff and land. Among the various parts of landing gear, axle is the most critical component where the loads (landing and ground loads) act on the axle first, then transferred to the structure. In this study stress and fatigue analysis of the axle is performed to meet the strength and life requirements. The modeling of the axle is done using UniGraphics (UG) software. Stress analysis is carried out using MSC Patran (pre-processing and post-processing)/Nastran (solver) for different landing loads (spin up, spring back, maximum vertical and drift) and ground handling loads (braking, taxing and turning). Stress analysis was carried out by both classical and FEM approaches and by comparing the results it was obvious that they were in correlation with one another. Fatigue analysis was also carried out for the axle using landing spectrum and ground handling spectrum to estimate the fatigue life. By the iteration process, the requirement of 10000 landings was satisfied. Keywords: Static, Fatigue, Axle, Fatigue life, UniGraphics, MSC Patran, MSC Nastran
The document provides an overview of the Ford Everest SUV, including its:
- Confident and capable stance with bold wheel arches and eye-catching design details.
- 3.0 liter diesel engine that provides 115kW of power and 380Nm of torque.
- Advanced safety features like ABS, dual front airbags, and side airbags.
- Interior versatility with a 7-seat configuration.
- Superior off-road capabilities supported by its 4x4 system.
The document discusses aerodynamics in cars. It defines key aerodynamic terms like drag, lift, and downforce. It explains how aerodynamic principles like frontal area and drag coefficient affect a car's performance. The document also discusses how car designers use computational fluid dynamics software and aerodynamic devices to reduce drag and optimize airflow over different parts of the vehicle. The goal is to achieve maximum fuel efficiency through improved aerodynamics.
This document discusses the global economic impact of accidents on the health care system. Some key points:
- 1.2 million people die each year in road traffic accidents, averaging 3242 daily deaths worldwide. 20-50 million more are injured or disabled.
- 90% of traffic deaths occur in low and middle-income countries, where roads are less safe and medical care is less accessible.
- Road accidents are predicted to rise to the 8th leading cause of death by 2030 if no action is taken, with an 83% increase in deaths projected in low-and middle-income nations.
- The total global economic cost is estimated at $518 billion annually, exceeding development assistance received by many
The document discusses the importance of crash investigation and black spot assessment to understand accident causation factors and save lives. It outlines JPRI's crash investigation methodology, which includes examining crash scenes and vehicles, analyzing CCTV footage, and estimating speeds. The Haddon Matrix is presented as a tool to systematically identify pre-crash, crash, and post-crash factors for humans, vehicles, and infrastructure. Case studies demonstrate how infrastructure factors like poor pedestrian facilities contribute to accidents. Black spots are identified, and infrastructure interventions like reducing crossing distances are recommended. Reliable crash data collection and analysis of contributing road environment issues are essential to assess road safety.
This tutorial introduces the basics of using Lotus Suspension Analysis. It describes how to start the application, create a new front double wishbone suspension model using default parameters, and manipulate the graphical 3D view. Basic functions like displaying results graphs, animating the suspension kinematics, and saving files are also covered to help users get started with the software.
The document discusses aerodynamic optimization techniques used in the design of Formula 1 cars. It covers the history of aerodynamic development in Formula 1, from early focus on drag reduction to modern emphasis on generating downforce. Key aerodynamic factors in F1 car design like wings, underbody tunnels, and bargeboards are examined. Computational fluid dynamics, wind tunnel testing, and on-track testing are described as the main methods used by F1 teams to develop aerodynamics. The document concludes that aerodynamics are crucial for high-speed stability and performance in Formula 1.
Design and analysis of undertray diffuser for a formula style racecareSAT Journals
Abstract The advancements in Formula one industry have clearly shown the importance of Aerodynamics and thus it was taken as an opportunity to design and develop a not much widely known aerodynamic component, a diffuser considering the myriad of benefits. This report explains the development of an undertray diffuser for an Formula Student (fsae) car. An undertray Diffuser is just as the front and back wing of race cars an aerodynamic package that generates Downforce. The hard part of designing an aerodynamic package for these cars is their top speed. The faster a car drives the more downforce is going to be generated. The Formula student race cars have a top speed around 130km/h. Due to this low top speed (Formula 1 cars reach top speeds of 370km/h), the wings of the car have to work with lower speeds and have to be larger. The undertray diffuser has to generate as much downforce as possible and as less drag as possible. The working principle of the undertray diffuser is explained later. The air under the undertray diffuser travels faster than on top of the undertray diffuser. When this happens a lower pressure is generated underneath the undertray diffuser and this lower pressure generates downforce. Keywords: Aerodynamics, downforce, speed, pressure.
Euro vi technologies and its implementationShiril Saju
The document discusses the transition from Euro IV to Euro VI emission standards for diesel vehicles in India. It outlines the key technologies needed, including diesel particulate filters and selective catalytic reduction, to significantly reduce particulate matter and nitrogen oxide emissions. Implementing these advanced technologies by 2020 to meet Euro VI standards will be a major challenge for automakers and will increase vehicle production costs considerably. The document also notes that India does not currently have limits on carbon dioxide emissions from vehicles.
The document discusses antilock braking systems (ABS). It describes how ABS monitors wheel slip and modulates brake pressure to prevent locking and maintain vehicle control during braking. It outlines the key components of ABS including sensors, control modules, valves and pumps. ABS improves stability and reduces braking distances on slippery surfaces. While effective for safety, ABS does increase maintenance costs compared to traditional braking systems.
This document discusses active suspension systems for vehicles. It begins with an introduction that describes vehicle suspension systems and the conflicts between ride comfort and handling. It then provides figures to illustrate contact patch deformation during cornering and bumps. The document discusses various suspension designs and their effects. Subsequent chapters will cover objectives, methodology, active suspension design including controller, software and hardware design, functions of active suspensions, examples like the Bose system, and recent developments.
This document provides an outline and overview of adaptive cruise control (ACC) in vehicles. It discusses the history and development of cruise control and ACC. The key components of ACC are described including sensors, processors and actuators that allow the vehicle to automatically adjust speed to maintain a safe distance from other vehicles. The benefits of ACC include relieving driver fatigue on long trips and potential to reduce accidents rates, while limitations are the higher costs and potential to encourage driver inattention. Future developments may include vehicle-to-vehicle communication to allow for cooperative adaptive cruise control systems.
Selection of powertrain for vehicle is depends upon vehicle type & application of vehicle. To achieve performance of vehicle, engine torque at maximum revolutions, Transmission ratio, Axle ratio & tire plays important role. In order to understand vehicle performance in theoretical calculation there should be proper selection of power train aggregates. All these aggregates technically will evaluate the actual vehicle performances. For example, trucks are seldom run at their rated maximum speed. In fact, they are usually operated with engine speed at maximum torque or at the speed where fuel consumption is minimized. In climbing hills, there may be occasions when the engine revolution is raised to its maximum to produce the maximum horsepower; however, the most efficient method of operation is to use the range of engine speed, which maximizes torque. If an engine's speed range, producing maximum torque, is extremely narrow, a slight increase of rpm will cause a substantial loss of power and sign of poor performance characteristic. In other words, engines with high maximum torque and horsepower are not necessarily the most "powerful engine." Factors other than the maximum values of the torque and horsepower must be evaluated in determining the practical performance of engines. Furthermore, a high performance engine must be combined with the correct transmission and differential in order to produce the desired running performance. It is necessary to understand the factors affecting its ease of operations. This Paper tells how to integrate powertrain and judge performance of vehicle according to application and type of vehicle by reading performance curves and calculation
Automatic control of aircraft and missiles 2nd ed john h. blakelockMaRwa Hamed
This document is the preface to the second edition of the book "Automatic Control of Aircraft and Missiles" by John H. Blakelock. The preface outlines the changes and additions made to the material in the second edition, including expanded coverage of topics like missile guidance systems, multivariable control systems, and modeling of human pilots. It also thanks those who provided assistance in preparing the second edition.
Formula 1 cars have evolved significantly over time through aerodynamic innovations. Early cars had no aerodynamic design knowledge and relied solely on engine power. Teams now spend tens of millions annually researching aerodynamics. Ground effects and wings generated downforce to increase cornering speeds. Later innovations like diffusers, bargeboards, and movable flaps further optimized airflow and reduced drag. The result is cars that can corner at over 3 G's and reach speeds of over 200 mph through revolutionary aerodynamic design.
Here are the key steps in designing a major/minor priority junction according to the guidance:
1. Choose the most appropriate type of junction based on operational, economic and environmental factors. Consider major/minor, roundabout, signals or grade separation.
2. Choose the most appropriate form and size of major/minor priority junction from those described in Chapter 1, based on design year traffic flows, vehicle types, capacity, delays and accident costs.
3. Address safety issues, consider road user requirements, and develop a preliminary landscape design. Assess key geometric parameters.
4. Check junction capacity is adequate, considering potential future traffic variations.
5. Perform a "driveability" check to assess smooth assembly of
This document discusses vehicle aerodynamics and the various road loads that affect a vehicle's performance and fuel efficiency. It covers topics such as aerodynamic drag, lift forces, pressure distributions, rolling resistance, and how factors like air density, drag coefficients, tire design and crosswinds influence a vehicle's handling and energy usage. The goal of vehicle aerodynamics is to optimize these elements to reduce wind resistance, improve stability, and minimize fuel consumption during driving.
Final Year Paper-Designing the 2016 RMIT Aero Package - Hashan MendisHashan Mendis
This document summarizes a student project to design an aerodynamic package for a Formula SAE race car. The objective was to maximize points gained in competition by increasing downforce. An analytical approach was used to determine that a coefficient of lift (Cl) of 1.7 across events could gain 38 points. A decision matrix determined resources should focus on front and rear wings. Simulations in ANSYS evaluated wing profiles and validated the design could achieve the target Cl of 1.8 in a straight line with center of pressure 10% forward of the center of gravity, improving handling over the previous car design. The package was able to increase downforce as required while keeping the competition position of RMIT University.
This document summarizes a study that used scale model wind tunnel experiments to characterize the slipstream velocity profile behind a NASCAR vehicle. The goal was to determine the optimal distance for an overtaking car to position itself within the slipstream during cornering to maintain sufficient downforce for control. Calculations determined that a velocity of 53 mph within the slipstream was needed to generate the minimum 887 lbs of downforce required for cornering. CFD analysis of an F1 car estimated this velocity occurred around 0.5 car lengths behind. Wind tunnel experiments with Pitot tubes were planned to validate this distance for NASCAR vehicles.
عرض تقديمي لتصميم طريق وكيفية ابعاد الطريقssuser09e10f
This document discusses road-vehicle performance and its impact on highway engineering and design. It covers the following key points:
- Vehicle capabilities like acceleration/braking and human factors like reaction time form the basis of roadway design guidelines.
- Tractive effort and resistance are opposing forces that determine vehicle performance. The three major sources of resistance are aerodynamic, rolling, and grade.
- Aerodynamic resistance increases with speed squared and power required increases with speed cubed. Rolling resistance depends on factors like tire and surface properties. Grade resistance depends on road slope.
- Maximum tractive effort is limited by the coefficient of road adhesion and weight transfer during acceleration or braking. Braking performance is important
الحقيبة التعليمية لمادة ميكانيك السيارات للمرحلة الثانية لقسم المكائن والمعدات - معهد اعداد المدربين التقنيين - العراق- بغداد
من اعداد المهندس : صلاح مهدي خليل
Anti lock braking (ABS) Model based Design in MATLAB-SimulinkOmkar Rane
This document describes the modeling and simulation of an anti-lock braking system (ABS) using Simulink. It includes models of vehicle dynamics, wheel dynamics, and a simplified ABS controller. The vehicle model accounts for mass, friction forces, and acceleration. The wheel model includes torque from braking and friction. Simulation results show wheel slip and stopping distance with and without the ABS controller engaged. The ABS system helps maintain optimal slip to minimize stopping distance.
This document summarizes an aerodynamic analysis of a car model conducted using computational fluid dynamics (CFD) software to reduce drag force. The original Swift Dzire car model and two modified models - a "fastback" design with a sloped rear and a model with a rear spoiler - were simulated at 144 km/hr. The original model had a drag coefficient of 0.375. The fastback design had a lower drag coefficient of 0.335 due to delayed flow separation at the rear. The spoiler model had an even lower drag coefficient of 0.35, as the inverted wing spoiler produced downward force to increase traction at high speeds. CFD analysis provided insight into pressure and velocity contours to understand
IRJET- Aerodynamics of High Performance VehiclesIRJET Journal
This document discusses the aerodynamics of high performance vehicles like racing cars. It explains that racing cars are designed to reduce drag and enhance downforce through careful aerodynamic design. Computational fluid dynamics (CFD) is used to analyze fluid flows and optimize aerodynamic design. Key forces on vehicles in aerodynamics are discussed, including lift, thrust, drag, downforce, and weight. Downforce is important for racing cars as it increases grip and stability, allowing higher cornering speeds. The document provides details on drag coefficient, downforce generation, and the importance of balancing aerodynamic forces across the vehicle.
This document describes the design and validation of a slip-based traction control system using co-simulation between ADAMS and MATLAB/SIMULINK. The objectives are to develop a traction control scheme to enhance vehicle stability under changing road conditions. A sliding mode controller is designed in SIMULINK and a vehicle model is created in ADAMS. Co-simulation is performed to validate that the controller can robustly control wheel slip as road parameters and vehicle mass vary. Simulation results demonstrate the controller tracks the desired slip ratios under different road surfaces and mass values, improving vehicle stability compared to open-loop control.
The formula cars need high tire grip on racing challenge by reducing rolling displacement at corner or
double change lands. In this case study, the paper clarifies some issues related to suspension system with
inerter to reduce displacement and rolling angle under impact from road disturbance on Formula SAE
Car. We propose some new designs, which have an advance for suspension system by improving dynamics.
We optimize design of model based on the minimization of cost functions for roll dynamics, by reducing the
displacement transfer and the energy consumed by the inerter. Base on a passive suspension model that we
carried out quarter-car and half-car model for different parameters which show the benefit of the inerter.
The important advantage of the proposed solution is its integration a new mechanism, the inerter, this
system can increase advance in development and have effects on the vehicle dynamics in stability vehicle.
This chapter discusses the requirements, peculiarities, space constraints, and performance of power plants for combat vehicles like tanks. It covers the required power levels for steady speed, acceleration, climbing gradients, and more. It also examines factors like power-to-weight ratio, efficiency calculations, and the layout of power plants in various modern main battle tanks.
Design of Rear wing for high performance cars and Simulation using Computatio...IJTET Journal
The performance of a sports car is not only limited to its engine power but also to aerodynamic properties of the car. By decreasing the drag force it is possible to reduce the engine power required to achieve same top speed thus decreasing the fuel requirement. The stability of a sports car is considerably important at high speed. The provision of a rear wing increases the downforce thus reducing the rear axle lift and provides increased traction. In this study an optimum rear wing is designed for the high performance car so as to decrease drag and increase downforce. The CAD designed baseline model with or without rear wing is being analyzed in computational fluid dynamics software. The lift and drag coefficient are calculated for all the design thus an optimum rear wing is designed for the considered baseline model.
Optimum Design of 1st Gear Ratio for 4WD Vehicles Based on Vehicle Dynamic Be...yarmohammadisadegh
This paper presents an approach that allows optimizing gear ratio and vehicle dimension to achieve optimum gear transmission. Therefore,augmented Lagrangian multiplier method, defined as classical method, is utilized to find the optimum gear ratios and the corresponding number of gear teeth applied to all epicyclical gears. The new method is able to calculate and also to optimize the gear ratio based on dynamics of 4WD vehicles. Therefore, 4WD vehicles dynamic equations are employed as suming that the rear wheels or the front wheels are at the point of slip. In addition, a genetic algorithm is modified to preserve feasibility of the encountered solutions. The basic dimension of a sample commercial vehicle (2009 hummer H34 dr AWDSUV) and its gear box are optimized, and then the effects of changing slip angle, wheelbase, and engine torque on optimum vehicle dimension are analyzed.
IRJET- Determination of Critical Downforce Coefficient of a Vehicle for Optim...IRJET Journal
This document describes a study to determine the critical downforce coefficient of a vehicle for optimal aerodynamic performance. The researchers used a Formula SAE race car and the Buddh International Circuit track for simulations. They simulated increasing levels of downforce coefficient and measured the effect on lap times. They found that downforce initially improved lap times by increasing cornering ability. However, beyond a critical point, the increased drag from higher downforce began to outweigh the benefits, slowing lap times. The goal was to determine this critical downforce coefficient value through analytical calculations and simulations using OptimumLap software.
Longitudinal Vehicle Dynamics
-Maximum tractive effort of two-axle and track-semitrailer vehicles.
-The braking force of a two-axle vehicle.
-Acceleration time and distance.
-Relationship between engine torque and thrust force.
-Relationship between engine speed and vehicle speed
This document summarizes a seminar presentation on the design and analysis of a regenerative braking system. The presentation identifies the problem of reducing vehicle emissions and increasing fuel efficiency. It reviews literature showing that braking wastes 21-24% of energy and regenerative braking can recover 30-66% of that wasted energy. The objectives are to study regenerative braking system design, analyze its costs and efficiency, and test a prototype. Forces on vehicles during driving and braking are analyzed, and a Toyota Camry is modeled in Simulink. Calculations show potential to improve fuel economy by 7% through regenerative braking recovering 30% of braking energy.
IRJET- Design and Simulation of Aerodynamic Wings of Formula One Racing CarIRJET Journal
This document describes the design and simulation of aerodynamic wings for a Formula One racing car. It begins with introductions to aerodynamics concepts and how they apply specifically to automotive design. The document then details the design of airfoils used for the wings in Solidworks software. Simulations are run on the front and rear wing designs to analyze forces, pressures, temperatures, velocities and other parameters to evaluate wing performance in producing downforce and drag. The simulations indicate the front wing design produces over 1600N of downforce and around 600N of drag, while meeting other analysis criteria.
This document presents a mathematical model of a vehicle experiencing a tire blowout. It describes developing a simplified four-wheel vehicle model using equations of motion and a Dugoff tire model. It then outlines modifying the model to account for factors during a tire blowout, such as decreasing tire radius and effective radius over 0.8 seconds, and increasing rolling resistance and decreasing cornering stiffness. Simulation results are presented to verify the basic model and behavior during a tire blowout. The goal is to model vehicle behavior during this scenario to assist with controller design for lane keeping.
Stability analysis of a Rigid Vehicle Modelsaeid ghaffari
The lateral stability of a two axle vehicle with open loop control will be studied in this project. A 3 dof model is adopted to evaluate the curvature gain and the root loci as a function of the vehicle speed V. Moreover, the dynamic response of the vehicle considering the step steer manoeuvre will be analysed according to the ISO norm. The side slip angle and the yaw rate are evaluated as a function of time, while the trajectory of the center of gravity G of the vehicle with respect to the inertial reference frame (OXY Z) is plotted during step steer maneuver. Inasmuch as the change of cornering stiffness on tires due to the different condition are small, we cannot see the difference between the trajectories, shedding light on the steering angles, however, we can understand what is happening in various conditions. In this study, both the effect of traction force on the front and rear axle and transversal load transfer on the front and rear axle are investigated.
*only the first 10 pages of the main project are presented here. If you are interested to go through the rest of this document please contact me via saeid.ghaffari@studenti.polito.it.
INTEGRATED INERTER DESIGN AND APPLICATION TO OPTIMAL VEHICLE SUSPENSION SYSTEMijcax
The formula cars need high tire grip on racing challenge by reducing rolling displacement at corner or double change lands. In this case study, the paper clarifies some issues related to suspension system with inerter to reduce displacement and rolling angle under impact from road disturbance on Formula SAE Car. We propose some new designs, which have an advance for suspension system by improving dynamics.
We optimize design of model based on the minimization of cost functions for roll dynamics, by reducing the displacement transfer and the energy consumed by the inerter. Base on a passive suspension model that we carried out quarter-car and half-car model for different parameters which show the benefit of the inerter. The important advantage of the proposed solution is its integration a new mechanism, the inerter, this system can increase advance in development and have effects on the vehicle dynamics in stability vehicle.
INTEGRATED INERTER DESIGN AND APPLICATION TO OPTIMAL VEHICLE SUSPENSION SYSTEM
2015-Aerodynamics-Design binder
1. 1
Aerodynamics
TABLE OF CONTENTS:
Do we need aerodynamics?-----------------------------------------1
o Vehicle Dynamics Analysis---------------------------------1
o Slalom-----------------------------------------------------------7
o Acceleration event------------------------------------------10
o Braking---------------------------------------------------------11
o Autocross/Endurance--------------------------------------12
o Summary------------------------------------------------------20
Design requirements-------------------------------------------------20
Flow over the front tires---------------------------------------------20
Rear wing optimization-----------------------------------------------22
2. 2
Do we need aerodynamics?
Vehicle Dynamics Analysis
In a race car, driving, braking and cornering forces are created at the contact patch between the tire
and the road. These friction forces are strongly affected by the vertical forces applied on the tires and are
limited by a friction coefficient, this means that a car can turn up to a given maximum speed, but once it
exceeds this speed, the car will slide, this is a result of exceeding the limit of the tire adhesion coefficient.
Based on this idea, if we could increase the normal tire force by pushing the tire more against the road, then
the cornering force could be increased too, without the risk of sliding. Aerodynamic downforce increases
the load on the tires by increasing the vehicle's weight very little, the result is increased cornering ability
with little weight penalty, which gives a reduction in lap times.
The lateral balance of a car can be illustrated by a simple expression (assuming steady-state cornering):
μ(mg + Dz) =
mV2
ρ
(Eq.1)
where:
μ: coefficient of adhesion of the tires
g: gravity (9.81m/s2)
Dz: downforce
m: mass of the car (215.5kg)
V: velocity
ρ: radius of curvature
The left hand side of eq.1 represents the lateral force that the car can sustain before sliding. Dividing both
terms by the mass, the equation can be rewritten as;
G′
s =
Vmax
2
ρ
(Eq.2)
where:
G's: Lateral "g's" at which the tires will slip in steady state cornering (mg+Dz).
Rearranging eq.2:
Vmax = √G′s ∙ ρ (Eq.3)
3. 3
This equation is particularly important, since it describes the lateral dynamic of the car in Skid Pad.
The time required to complete a lap at the Skid Pad contest is given by;
tSP =
2πρSP
Vmax
(Eq. 4)
where:
tSP: time to complete a lap at the Skid Pad contest
ρSP: radius of curvature at the Skid Pad contest (9.125m)
Combining equations 3 & 4:
tSP = 2π√
ρSP
G′s
= f(G′
s) (Eq.5)
therefore the lap times and speed at the Skid Pad event can be calculated in terms of the G's;
Based on the vehicle requirements specified in section 1.7 (Steady state lateral acceleration of 1.48
G's), the expected time is 4.96 seconds and the velocity achieved will be 25.8mph. It is important to note
that in the Skid Pad event the first cars can be measured in less than tenths of a second, therefore the ability
to produce the required downforce is critical. This table shows the Skid Pad times at Lincoln 2012.
4. 4
The next step is to
calculate the downforce the car must create to produce the required lateral
G's.. From Eq. 1 and solving for Dz:
G′
s =
μ(W+Dz)
m
Dz =
G′s∙m
μ
− W
Everything on this equation is known, except for μ. The value of μ is unknown because the tire behavior
depends on multiple factors, such as temperature, pressure, vertical load, etc. However, based on the data
sheet published by Hoosier (tire provider), values between 1.3 and 1.7 can be expected. Plotting the required
downforce in terms of the coefficient of adhesion of the tires:
Skid Pad times, Lincoln 2012
Downforce required vs. tire adhesion coefficient
5. 5
It is important to note that if μ is larger than 1.5 it is not required to produce downforce in order to
achieve 1.48 G's. If that is the case, that downforce can be "invested" into cornering at a higher lateral
acceleration.
Before continuing, it must be demonstrated that drag and rolling resistance produced in this even
will not prevent the car from achieving the maximum velocity calculated from the lateral balance. As such,
the longitudinal balance must be analyzed. The forces acting on the car in the longitudinal direction can be
illustrated as:
Model 1 : R = (0.005 +
1
P
(0.01 + 0.0095 ∙ (
v
100
)
2
)) ∙ (W + Dz) (Eq.7)
Model 2: R = (0.01 + 6.5 ∙ 10−6
∙ v2) ∙ (W + Dz) (Eq.8)
Model 3: R = Pα
∙ (W + Dz)β
∙ (a + bv + cv2) (Eq.9)
where:
R:Rolling Resistance
P:Tire pressure
v:velocity
α,ß,a,b,c: SAE J2452 coefficients
Dz: Downforce =
1
2
ρv2
AfrontalCd (Eq.10)
Dx: Drag =
1
2
ρv2
AfrontalCx (Eq.11)
Note that models 1 and 3 are pressure and velocity dependent, whereas model two is only velocity
dependent.
Based on previous cars and the track conditions:
P≈10.5 psi
Afrontal≈1.4m2
Cd≈2.5
Cx≈1.3
Longitudinal forces acting on a car
6. 6
α= -0.003, ß= 0.97, a= 84·10-4, b=6.2·10-4s/m, c= 1.6·10-4s2/m2
Comparing the drag produced by an average FSAE car with a full aerodynamic package with the
rolling resistance:
The figure above shows that the three models are very similar, even though model three predicts a larger
rolling resistance at higher speeds. Comparing the rolling resistance to the drag (see next figure).
It can be concluded that the rolling resistance plays an important role at low speeds (0-20mph). Once
the car exceeds that speed, the contribution of the rolling resistance stabilizes (20-25% of the overall
contribution). Therefore for the Skid Pad event, where the velocities are in the range of 0-30mph, in order
to get more accurate results, it will be assumed that the rolling resistance adds an additional 25% non-
aerodynamic drag. Adding the rolling resistance (average of the three models) and the aerodynamic drag,
the power required to overcome drag and rolling resistance is:
Rolling Resistance and Drag comparison vs Speed
Relative Importance of the Rolling Resistance
7. 7
The figure above shows that for the range of speeds present in the Skid Pad event, the engine is
capableof overcoming the power absorbed by the aerodynamic system and the tires. Based on longitudinal
and lateral balance, the limiting factors are the tires (limited adhesion coefficient) and not the drag!
In light of the previous analysis, an addition of an aerodynamic package will not harm the times obtained
at Skid Pad. In fact, the analysis suggests a car with an aerodynamic package would receive better times, as
would allow greater lateral G's and, therefore, greater velocity. However, this analysis is slightly optimistic,
given:
The slight reduction of aerodynamic downforce measured at high yaw angles.
The effect of the suspension system.
More complex calculations will show that Skid Pad performance with and without wings is nearly
equal, a fact corroborated by Skid Pad tests with LMS11 and LMS12 with and without aerodynamic
packages.
Slalom
Another path where the influence of the downforce can be analyzed is the Slalom. Assuming the
cones are in a straight line and equally spaced, the car follows a sinusoidal path through cones, the amplitude
of sine wave is half outside track of tires (to), plus half the pylon base (c), and the clearance between the
tire and the cone (d):
Power absorbed by the Rolling Resistance and the Drag
8. 8
The
spatial sine wave is given by: y = Asin(wxx) (Eq.12)
where A =
(to+c)
2
+ d (Eq.13) , wx is the spatial frequency of the slalom wx =
π
L
(Eq.14),
also the distance traveled, x is given approximately by x= vt (Eq.15)
yielding to: y = Asin(
πvt
L
) , the acceleration in the lateral direction, y, is then ÿ:
ÿ = −A(
πv
L
)2
sin (
πvt
L
) (Eq. 16)
and the maximum acceleration in G's is:
maxG′
s =
A
g
(
πv
L
)2
(Eq.17)
the period (T=L/v) between cones as a function of the slalom amplitude at various G's:
From
figure 16, it can be concluded that by maximizing the maximum transient lateral acceleration, the time
required to drive through the slalom can be significantly reduced. Assuming a five cones slalom (amplitude
of 50 in), the difference of time between a car without an aerodynamic package (max transient lateral force
Slalom
Time between cones at various G's
9. 9
of approximately 1 G's) and a car with an aerodynamic package (max transient lateral acceleration of 2 G's)
can be calculated from the Table 2.
Time between cones at various G's
Time difference = 5 ∙ (1.13 − 0.8) = 1.65 seconds‼!
The difference in performance through a slalom between a race car with and without an aerodynamic
package is remarkable, particularly in the Autocross and Endurance events, where there are multiple
slaloms, and the difference in time between the top ten teams might be less than a tenth of a second, as seen
in the table below. Note that for the 2013 the Endurance track includes four slaloms, a fact that could make
a car with an aerodynamic package up to six seconds faster than one without. Therefore it can be concluded
that an aerodynamic package significantly improves the car's performance through a slalom. Note
that the addition of wings to the aerodynamic package is both beneficial and detrimental in this situation.
At low speeds, the increased polar moment of inertia due to the addition of wings will result in lower yaw
accelerations compared to a car without wings. But above a critical speed, the increased grid due to the
downforce will result in higher potential yaw acceleration rates for the winged car.
Autocross times. Lincoln 2012
10. 10
Acceleration
The next event to analyze in determining the worth of an aerodynamic package is the Acceleration
event. The maximum performance in longitudinal acceleration is determined by three limiting factors:
Drive tires' traction
Engine power
Top speed is limited by drag and tire rolling resistance
At top speeds the limiting factor may be traction limited and at high speeds it may be power limited.
From the free body diagram (Figure 11), applying ∑ Fx = 0:
m ∙ ax = Ft − Dx − R (Eq.18)
where:
Ft: Tractive force
R: Rolling Resistance
Dx: Drag
ax: Longitudinal acceleration
Multiplying eq. 18 by the velocity of the car, substituting R (model 2 will be used, because of its
simplicity, but still accurate results) Dx and rearranging terms:
where:
Peng: Engine's power (65 bhp restricted)
Afrontal: Frontal area of the car (1.4m2)
Cx: Drag coefficient based on the frontal area
Cz: Downforce coefficient based on the frontal area
From equation 19 it is easy to conclude that the drag and downforce (which influences the rolling
resistance) generated by the aerodynamic package will lead to slower acceleration times. Note that even
this simple model, where the longitudinal weight transfer is not included, predicts that a car with an
11. 11
aerodynamic package will produce slower times at the acceleration event than a car without it. Based
on Scott Wordley and Jeff Saunders' paper "Aerodynamics for Formula SAE: Initial design and
performance prediction" a winged car should be able to accelerate slightly faster than the same car without
wings at velocities below 30 mph due to the increase in aerodynamic downforce. This is an interesting
observation, particularly considering that the corner exit speeds for events like Autocross and Endurance
are typically in the 20 to 40 mph range.
Braking
Another circumstance where a car with an aerodynamic package will improve better than the one
without it, is Braking. The free body diagram of a vehicle braking is:
Summing the force in the x direction: ∑ Fx = 0
−max − Fbf − Fbr − Dx = 0 (Eq.20)
where:
ax: longitudinal acceleration
Fbf:Front brake force
Fbr: Rear brake force
Fb:Total brake force
Front and rear braking force terms arise from the torque of the brakes on the wheels, rolling resistance,
bearing friction and driveline drag. Taking into account that Fbf + Fbr = Fb
Figure 1-Braking free body diagram
12. 12
max = −Fb − Dx (Eq.21)
ax = −
(Fb + Dx)
m
(Eq. 22)
and substituting Fb = μ(W + Dz),
−ax =
(μ(W+ Dz) + Dx)
m
=
(μ(W+
1
2
ρv2
AfrontalCd) +
1
2
ρv2
AfrontalCx)
m
(Eq.23)
−ax =
(μW +
1
2
ρv2
Afrontal(Cdμ + Cx)
m
(Eq. 24)
Assuming realistic parameters for a Formula SAE car with and without an aerodynamic package:
The deceleration
achieved by the car with an aerodynamic package is always larger than the one produce by a car without an
aerodynamic package, particularly since the car with an aerodynamic package produces more drag, which
is beneficial when braking, and because the downforce produced enhances the grip of the car and hence the
mechanical braking capabilities. Hence it has been demonstrated that a car with an aerodynamic package
improves the braking capabilities of a Formula SAE car, which means that the driver can brake later
and based on the previous conclusions he will be capable to corner at a higher speeds,all of this thanks
to the aerodynamic package.
Autocross/ Endurance
A comprehensive lap-time simulation of the Autocross/Endurance track(s) is required for a
thorough analysis of the effect of adding an aerodynamic package to a Formula SAE car. Two different
programs were used to determine the trade-offs in an aerodynamic package.
Downforce and drag coefficient for Formula SAE cars
13. 13
LapSim, the first program used, utilizes a majority of vehicle parameters to simulate a vehicle
running a track. The code includes weight transfer. Simulation results deviated as little as 5% from real-
world competition values. The parameters used in order to simulate the lap times are:
Tires: Hoosier 13''
Vehicle weight (including driver):
With a full aerodynamic package: 575lbf
With a small aerodynamic package (nose, sidepods and undertray):470-570 lbf
Without aerodynamic package (only nose and sidepods): Variable, 450-570 lbf
Wheel base: 60 in
Track width: 54 in
Center of Gravity: 11.5 in off the ground
Final drive ratio: 5.5
Downforce at 40mph
With a full aerodynamic package: Variable,100-260 lbf
With a small aerodynamic package: 50 lbf
Without aerodynamic package: 5 lbf
Aerodynamic Efficiency:
With a full aerodynamic package: 2.4
With a small aerodynamic package: 2.8
Without aerodynamic package: 0.1
The track where the simulations are done, is the 2011 Endurance FSAE West Competition Circuit
(USA).The Circuit is shown in Figure 19.
Comparing a car without an aerodynamic package whose requirement is to reduce weight (variable between
450 and 550 lbf) and two cars with an aerodynamic package (the full aerodynamic package with variable
downforce generated at 40 mph, from 100 to 250lbf, and the one with a small aerodynamic package trying
to cut weight) the times for Autocross, Skid Pad and Acceleration are shown.
14. 14
Figure 20 clearly shows that the car with a full aerodynamic package will always beat a car with a
small or no aerodynamic package at the autocross event, this is because the event features many slaloms,
corners and few straights. A set-up with large downforce values results in faster slaloms and turns. There
is, however, a small region where the car with a small aerodynamic package could beat the car with a full
package. This is not an interest region for LoboMotorsports, as it requires a car that weighs 310 lbf, a value
well outside the projected weight of the team's car (425-525 lbf). Furthermore, it would only beat the car
with a full package only if the latter produced less than 125 lbf of downforce at 40 mph, an unlikely
occurrence. Considering a normal situation (based on previous cars), where the car with the full
aerodynamic package produces around 175 lbf of downforce at 40 mph and weights 475 lbf and the car
with small or no aerodynamic package weight around 400lbf.The difference in lap times is approximately
3 seconds for the car with a small package and 4.5 seconds for the car without an aerodynamic package.
This is relevant because Autocross and Endurance are very similar events, together gathering 450 (not
counting fuel consumption) out of 1000 points, and this simulation indicates that a full aerodynamic
package significantly reduces lap times.
Besides these analytical considerations, the cars manufactured in the LoboMotorsports race team
are not driven by professional drivers, and according to amateur drivers, a car with an aerodynamic car is a
lot easier to drive due to straight line stability and increased lateral grip. As each cone hit in Autocross and
Endurance incurs a two-second penalty, stability and grip are essential to a competing race car.
Autocross comparison between different aerodynamic packages
15. 15
Skid Pad comparison between different aerodynamic packages
The analysis of the Skid Pad event corroborates the analytical conclusion made in the Skid Pad
section. The more downforce produced by the car, the more G's it will pull; the car will drive faster and will
get better times. Note that the reduction of weight doesn't cut Skid Pad times, as mass by itself will be
cancelled out if the car produces little downforce (contribution is negligible compared to the mass term) or
none ( μmg = m
v2
ρ
). As previously stated, the suspension system is a determinant factor. Based on
experience with other cars, an optimized suspension setup might be more valuable than an aerodynamic
package on its own.
Acceleration comparison between different aerodynamic packages
Figure 22 demonstrates that aerodynamic packages increase drag and rolling resistance of the entire
system, making the car more sluggish. For the acceleration event, then, the car with the full aerodynamic
16. 16
package should have the capacity to change the angle of attack for the rear and front wings, as the amount
of downforce produced in this event doesn't improve the car's times (recall that downforce improves car
acceleration at speeds higher than 30 mph, speeds tested at the end of the track). If the aerodynamic system
has the capacity to change the wings' angle of attack, the equivalent downforce produced at 40 mph would
be around 100 lbf, meaning the car would cut between 0.6-0.8 seconds, compared to the same car at the
high downforce configuration.
The second software used to analyze the impact of an aerodynamic package is OptimumLap.
OptimumLap is software developed by OptimumG, an international vehicle dynamics consultant group that
works with automotive companies and motorsports teams to enhance their understanding of vehicle
dynamics through seminars, consulting and software development.
The vehicle model used in OptimumLap is a point mass, quasi-steady state model. Mathematically this is
overly simplistic, but in reality, this model is very powerful at analyzing the global performance trends of
a vehicle, without having to capture or model more detailed effects. The advantage of this is that a vehicle
can be characterized by very few inputs, requiring very little time to setup and conduct a simulation. Even
as the model is a point-mass model, meaning that no weight transfer or transient affects are taken into
account, the simulated results do correlate well with logged data. Validations have shown that apex speeds,
end of straight speeds, energy consumption and total lap time all match reality within 10% (often within
5%), confirming that OptimumLap is a tool well suited to study the global trends and the impact of each
vehicle subsystem.
Creating a vehicle in OptimumLap is a very straightforward process especially since it requires a small
number of inputs. The vehicle is defined by the following parameters:
Logged data compared against model results using OptimumLap
17. 17
Mass: 575 lbf including driver
Drag and downforce coefficient: 1.3 and 3 respectively
Frontal area: 15.2 ft2
Tire radius and rolling resistance coefficient: 10'' and 0.015 respectively.
Engine data. The engine's curves for torque and power are taken from Ricardo software.
Transmission type: CVT
Track: FSAE Endurance Nebraska 2012 (figure 29)
FSAE Endurance Nebraska 2012,Lincoln USA
The first analysis considered in order to determine the impact of an aerodynamic package, is the
comparison of a car with an aerodynamic package (whose goal is to create downforce) and a car without an
aerodynamic package (whose goal is cut weight). In order to simulate this analysis, two parameters have
been varied simultaneously, vehicle's mass and downforce coefficient.
Downforce coefficient: 0 - 3.5
Vehicle mass: 350 - 500 lbf ( the driver's weight has been included in the model, 150 lbf )
The results produced by OptimumLap can be seen in Figure 30 (next page).Comparing the most
likely situations for FSAE cars the car with an aerodynamic package (downforce coefficients between 2
and 3.5, and vehicle weight around 650 lbf, blue star on figure 30) will always defeat a car without an
aerodynamic package (downforce coefficient close the zero, weight around 550 lbf, red star on figure 30),
even though the cars with an aerodynamic package weigh more. It is very interesting to realize that
producing downforce is more efficient than cutting weight in terms of lap times for autocross and endurance,
hence the development of an aerodynamic package seems to be a better solution to get better results instead
of simply cutting weight. Based on these results, the implementation of an aerodynamic package reduces
the lap times by few seconds every lap for the autocross and endurance event.
18. 18
The next aspect that must be considered is the balance between downforce and drag. As a rule of
thumb the more downforce our system produces the higher the drag, hence an analysis of the interaction
between drag and downforce must be done to conclude at what point creating too much drag and downforce
may hurt the lap times. Figure 26 exhibits the results for different drag and downforce coefficients and their
impact. Figure 26 clearly shows that a car that produces a lot of downforce (downforce coefficients of 3-
3.5) is faster than any low downforce configuration, even though their drag coefficient is higher. High
downforce configuration (blue star) and low downforce configuration (red star), clearly demonstrate this
fact.
It is very important to highlight that the circuit at Lincoln (Nebraska), competition where
LoboMotorsports compete, is considered a "High Downforce" track, hence the simulations show that having
Impact of downforce coefficient vs vehicle mass in lap times
Impact of downforce vs drag coefficients in lap times
19. 19
a massive aerodynamic package always improves the car's performance. In other competitions, the balance
between downforce and drag must be analyzed, since in faster tracks the addition of too much drag and
downforce might hurt the car's performance. An example of "Low Downforce" track is FSAE Endurance
Michigan 2012 (figure 28).
Comparing the lateral acceleration achievable by a car with a full aero package and one without it a large
aero package is necessary to achieve the lateral acceleration requirement.
Figure 27 demonstrates the better capacities of a car using an aerodynamic package while cornering,
this matter can be observed in the difference between the lateral g's peaks.
In summary, with respect to the various Dynamic Events, it has been shown theoretically, that the addition
of an aerodynamic package to the LoboMotorsports FSAE car should result in:
Acceleration Event: Slower times. The expected loss in time is 0.4-0.8 seconds, assuming a change
in the angle of attack of the wings into a lower drag configuration.
Skid Pad: Similar or marginally faster times. The suspension's setup is more decisive.
Autocross and Endurance events:
Lateral acceleration comparison
FSAE Endurance Michigan 2012 USA
20. 20
o Slower straight-line acceleration
o Significantly higher cornering speeds
o Significantly higher slalom speeds
o Slower yaw acceleration at low speeds, higher yaw acceleration at high speeds.
o Faster times, in the order of seconds.
o Increased fuel usage
All the reasons previously stated, have made LoboMotorsports decide to implement an
aerodynamic package in order to improve the car's performance.
Design Requirements:
Full aerodynamic package with 2 element front wing, rear wing ,and undertray
Car Downforce: 146 lbf at 40 mph
Car Drag: 54 lbf at 40 mph
Weight: 30 lbs
Improve aerodynamic efficiency of rear wing in dynamic yaw situations (β°)
Improve the carbon fiber layup process to make the carbon fiber parts stronger and lighter
Flow over the tires:
The tips’ main aim is to deflect the flow from the front tires. The tires influence the air flow in a way that
the air close to the tire surfaces may be a reverse flow compared to the overall flow coming from upstream.
The tires are the devices that might be responsible for the biggest production of drag if the flow is not
deflected around them. Therefore the aim is to deflect the flow from the tires so that the less air reaches the
tire surface.
Because of their shape and the fact that they are stuck to the ground, the tires create lift. Considering
an infinite wide stationary cylinder, the flow pattern would be the following: the particles of air would be
accelerated on the upper surface and would not be able to go through the lower one as the cylinder is
assumed to be stuck to the ground. The flow would separate at around 160 degrees from the stagnation
point. This means that the flow remains attached along a great distance and that the pressure coefficient
becomes more negative on the upper surface because of the higher speed induced: in theory, the speed of
air is doubled at 90 degrees from the stagnation point on the upper surface. This results in additional lift as
it is the upper surface but it results too in additional drag as this negative pressure area is mostly located
21. 21
behind the middle of the wheel. Then, as the tire rotates, the separation point goes forward. This destroys
the original lift generated by the tire and the drag generated by low pressure surface too. However drag is
very high because of the separated flow behind the wheel.
About the flow pattern, the tires modify the flow due to their rotation. In front of them, the flow tends to go
down and the stagnation point gets closer to the ground as the rotation speed increases. So the flow separates
in two sub flows at the stagnation point. The lower one is confronted to the wheel in front of it and to the
ground below it. A recirculation area forms and the flow escapes on the sides.
Since in Formula SAE the front wing can be as wide as the widest point of the tires, in order to reduce
the drag generated by the tires, the flow will be forced to go around the tires.
Rear Wing Optimization
Flow pattern around a tire