Downloaded 18 times

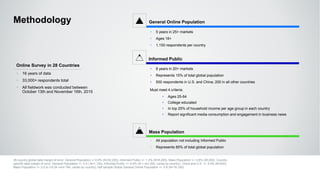


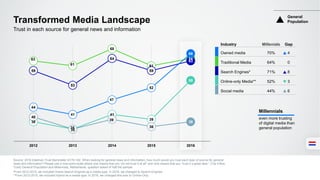
![CEO Focus Misplaced
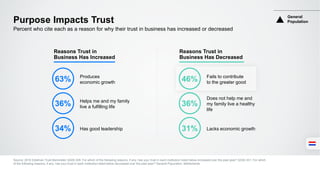
Source: 2016 Edelman Trust Barometer Q451-461. Thinking about CEOs, how strongly do you agree or disagree with the following statements? [‘CEOs do too much lobbying,’ ‘Given that the
average tenure of CEOs is just 4 years, CEOs aren’t in their role long enough to make a positive impact,’ (Top 4 Box, Agree) ‘CEOs are too focused on short-term financial results,’ ‘CEOs can
be trust to create jobs’ ] (Bot 5 Box, Do not agree) General Population, Netherlands.
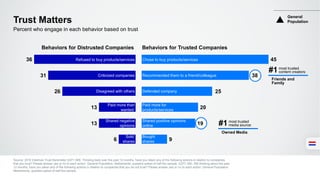
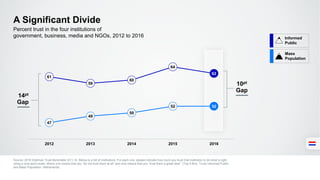
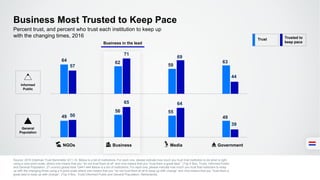
Percent who agree with each statement about CEOs
Too Much
Focus on short-term
financial results69%
Lobbying56%
Not Enough
Job creation56%
Positive
long-term impact60%
General
Population](https://image.slidesharecdn.com/edelmantrustbarometer2016presentatie-nederland-160118124430/85/Edelman-TRUST-BAROMETER-2016-Nederland-19-320.jpg)

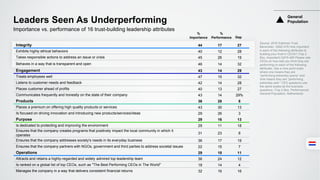
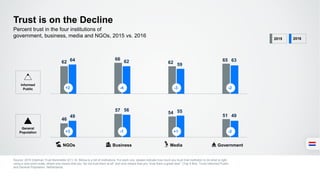
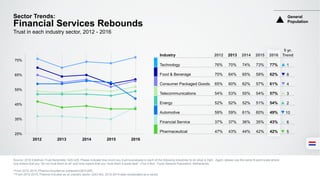
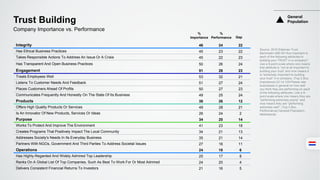
![56%57%58%
74%
Their education and
how it shaped them
Their personal
success story
The obstacles
they have overcome
Their personal values
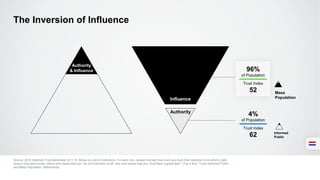
Personal Values and History Matter
Source: 2016 Edelman Trust Barometer Q507-514. Thinking about how a CEO communicates with a variety of groups and individuals, how important are each of the following activities a CEO could engage in? Please use a nine-point scale where one
means that attribute is “not at all important to building your trust” and nine means it is “extremely important to building your trust”. [Media Engagement net = Q507 ‘Interviews with the media,’ and ‘Q512 ‘Sharing their views on a blog or on social media.’
Direct Engagement net = Q508 ‘Communications with employees,’ and ‘Participation in industry conferences.’] Q516-524. For you to trust a CEO, how important is it that you have information on each of the following aspects of the CEO’s personal life
outside of their business? Please use a nine-point scale where one means that attribute is “not at all important to building your trust” and nine means it is “extremely important to building your trust. (Top 4 Box, Important) General Population,
Netherlands, question asked of half the sample.
Percent who agree that each type of information
is important in building trust in a CEO
General
Population](https://image.slidesharecdn.com/edelmantrustbarometer2016presentatie-nederland-160118124430/85/Edelman-TRUST-BAROMETER-2016-Nederland-24-320.jpg)

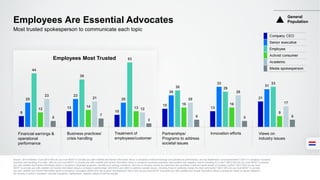

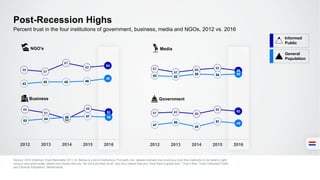
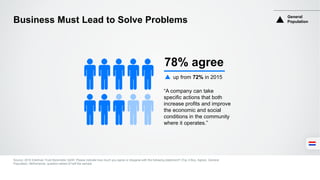
![67
61
51
48
45
29 31 29
23 21
79
69
64 62
50
46
43
39
36
30
My friends
and family
An academic
expert
Employees of
a company
Companies I
use
A journalist A company
ceo
Elected
officials
A well-known
online
personality
Companies
[brands] I
don’t use
Celebrities
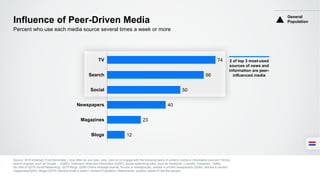
Every Voice Matters
Source: 2016 Edelman Trust Barometer Q598-609. Thinking about the information you consume, how much do you trust the information from each of the following
authors or content creators? (Top 4 Box, Trust) General Population, Netherlands, question asked of half the sample.
* Asked as “Brands I don’t use” in 2015.
Percent who trust information created by each author on social networking
sites, content sharing sites and online-only information sources, 2015 vs. 2016 2015 2016
+12
General
Population
50%](https://image.slidesharecdn.com/edelmantrustbarometer2016presentatie-nederland-160118124430/85/Edelman-TRUST-BAROMETER-2016-Nederland-30-320.jpg)


The 2016 Edelman Trust Barometer report reveals trends in trust across various institutions in the Netherlands, focusing on an informed public and general population. It outlines significant changes in trust levels over the years, with a rise in credibility for NGOs and business, and highlights the importance of transparency and ethical behavior in building trust. The report also discusses the shifting role of CEOs and the impact of trustworthy actions on consumer behavior.