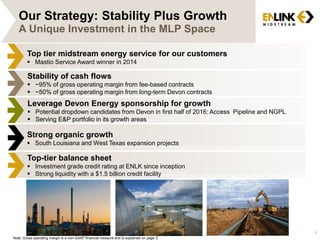
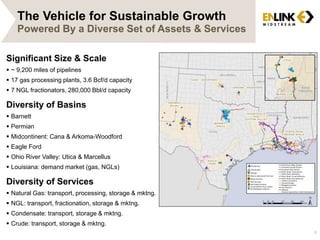
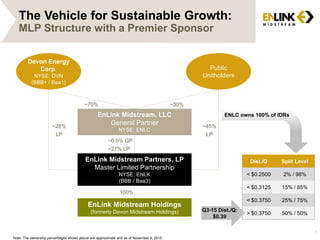
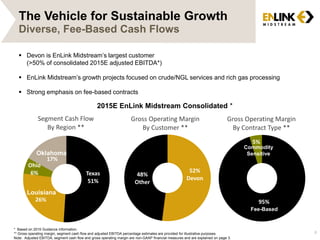
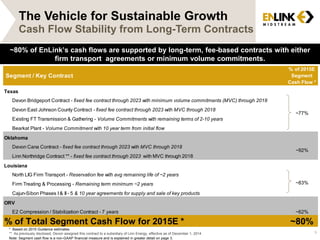
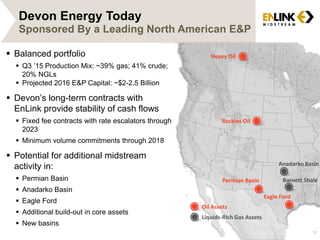
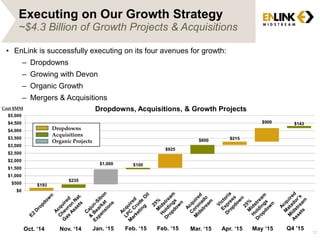
1Strong. Innovative. Growing.
2015 Jefferies
Energy Conference
November 11, 2015
Forward-Looking Statements
This presentation contains forward-looking statements within the meaning of the federal securities laws. Although these
statements reflect the current views, assumptions and expectations of our management, the matters addressed herein involve
certain assumptions, risks and uncertainties that could cause actual activities, performance, outcomes and results to differ
materially than those indicated herein. Such forward-looking statements include, but are not limited to, statements about future
financial and operating results, guidance, projected or forecasted financial results, objectives, project timing, expectations and
intentions and other statements that are not historical facts. Factors that could result in such differences or otherwise materially
affect our financial condition, results of operations and cash flows include, without limitation, (a) the dependence on Devon for
a substantial portion of the natural gas that we gather, process and transport, (b) our lack of asset diversification, (c) our
vulnerability to having a significant portion of our operations concentrated in the Barnett Shale, (d) the amount of hydrocarbons
transported in our gathering and transmission lines and the level of our processing and fractionation operations, (e) fluctuations
in oil, natural gas and NGL prices, (f) construction risks in our major development projects, (g) our ability to consummate future
acquisitions, successfully integrate any acquired businesses, realize any cost savings and other synergies from any
acquisition, (h) changes in the availability and cost of capital, (i) competitive conditions in our industry and their impact on our
ability to connect hydrocarbon supplies to our assets, (j) operating hazards, natural disasters, weather-related delays, casualty
losses and other matters beyond our control, (k) a failure in our computing systems or a cyber-attack on our systems, and
(l) the effects of existing and future laws and governmental regulations, including environmental and climate change
requirements and other uncertainties. These and other applicable uncertainties, factors and risks are described more fully in
EnLink Midstream Partners, LP’s and EnLink Midstream, LLC’s filings (collectively, “EnLink Midstream”) with the Securities and
Exchange Commission, including EnLink Midstream Partners, LP’s and EnLink Midstream, LLC’s Annual Reports on Form 10-
K, Quarterly Reports on Form 10-Q and Current Reports on Form 8-K. Neither EnLink Midstream Partners, LP nor EnLink
Midstream, LLC assumes any obligation to update any forward-looking statements contained herein. The assumptions and
estimates underlying the forecasted financial information included in the guidance information in this presentation are inherently
uncertain and, though considered reasonable by the EnLink Midstream management team as of the date of its preparation, are
subject to a wide variety of significant business, economic, and competitive risks and uncertainties that could cause actual
results to differ materially from those contained in the forecasted financial information. Accordingly, there can be no assurance
that the forecasted results are indicative of EnLink Midstream’s future performance or that actual results will not differ materially
from those presented in the forecasted financial information. Inclusion of the forecasted financial information in this
presentation should not be regarded as a representation by any person that the results contained in the forecasted financial
information will be achieved.
2
Non-GAAP Financial Information
This presentation contains non-generally accepted accounting principle financial
measures that we refer to as gross operating margin and segment cash flow. Gross
operating margin is defined as revenue minus the cost of sales. Segment cash flows is
defined as revenue less the cost of purchased gas, NGLs, condensate, crude oil and
operating and maintenance expenditures. Adjusted EBITDA is defined as net income from
continuing operations plus interest expense, provision for income taxes, depreciation and
amortization expense, impairment expense, unit-based compensation, (gain) loss on
noncash derivatives, transaction costs, distribution of equity investment and non-
controlling interest and income (loss) on equity investment. The amounts included in the
calculation of these measures are computed in accordance with generally accepted
accounting principles (GAAP).
EnLink Midstream believes these measures are useful to investors because they may
provide users of this financial information with meaningful comparisons between current
results and prior-reported results and a meaningful measure of EnLink Midstream's cash
flow after satisfaction of the capital and related requirements of their respective
operations.
Adjusted EBITDA, segment cash flows, gross operating margin, adjusted EBITDA of
EMH, growth capital expenditures and maintenance capital expenditures, as defined
above, are not measures of financial performance or liquidity under GAAP. They should
not be considered in isolation or as an indicator of EnLink Midstream’s performance.
Furthermore, they should not be seen as measures of liquidity or a substitute for metrics
prepared in accordance with GAAP. Reconciliations of these measures to their most
directly comparable GAAP measures are included in the Appendix to this presentation. 3
4
Stability of cash flows
 ~95% of gross operating margin from fee-based contracts
 ~50% of gross operating margin from long-term Devon contracts
Top tier midstream energy service for our customers
 Mastio Service Award winner in 2014
Leverage Devon Energy sponsorship for growth
 Potential dropdown candidates from Devon in first half of 2016: Access Pipeline and NGPL
 Serving E&P portfolio in its growth areas
Strong organic growth
 South Louisiana and West Texas expansion projects
Top-tier balance sheet
 Investment grade credit rating at ENLK since inception
 Strong liquidity with a $1.5 billion credit facility
Note: Gross operating margin is a non-GAAP financial measure and is explained on page 3.
Our Strategy: Stability Plus Growth
A Unique Investment in the MLP Space
5
EnLink Is Unique Among MLPs
Public MLP
Universe
Gathering and
Processing *
90%+
Fee-Based *
Investment
Grade
Long
Organic
Growth
History
~120
~16
~8
2
1
* Source: Barclay’s Energy Infrastructure Weekly, August 3, 2015;
excludes large cap, diversified MLPs.
The Vehicle for Sustainable Growth
Significant Size & Scale
 ~ 9,200 miles of pipelines
 17 gas processing plants, 3.6 Bcf/d capacity
 7 NGL fractionators, 280,000 Bbl/d capacity
Diversity of Basins
 Barnett
 Permian
 Midcontinent: Cana & Arkoma-Woodford
 Eagle Ford
 Ohio River Valley: Utica & Marcellus
 Louisiana: demand market (gas, NGLs)
Diversity of Services
 Natural Gas: transport, processing, storage & mktng.
 NGL: transport, fractionation, storage & mktng.
 Condensate: transport, storage & mktng.
 Crude: transport, storage & mktng.
6
Powered By a Diverse Set of Assets & Services
EnLink Midstream Partners, LP
Master Limited Partnership
NYSE: ENLK
(BBB / Baa3)
EnLink Midstream, LLC
General Partner
NYSE: ENLC
Public
Unitholders
~70% ~30%
~0.5% GP
~27% LP
EnLink Midstream Holdings
(formerly Devon Midstream Holdings)
~28%
LP
~45%
LP
Devon Energy
Corp.
NYSE: DVN
(BBB+ / Baa1)
100%
The Vehicle for Sustainable Growth:
MLP Structure with a Premier Sponsor
7
Dist./Q Split Level
< $0.2500 2% / 98%
< $0.3125 15% / 85%
< $0.3750 25% / 75%
> $0.3750 50% / 50%
Q3-15 Dist./Q:
$0.39
ENLC owns 100% of IDRs
Note: The ownership percentages shown above are approximate and as of November 4, 2015.
The Vehicle for Sustainable Growth
 Devon is EnLink Midstream’s largest customer
(>50% of consolidated 2015E adjusted EBITDA*)
 EnLink Midstream’s growth projects focused on crude/NGL services and rich gas processing
 Strong emphasis on fee-based contracts
8
Diverse, Fee-Based Cash Flows
2015E EnLink Midstream Consolidated *
95%
5%
Gross Operating Margin
By Contract Type **
Texas
51%
26%
Ohio
6%
17%
Segment Cash Flow
By Region **
52%
Devon
48%
Other
Gross Operating Margin
By Customer **
Fee-Based
Commodity
Sensitive
* Based on 2015 Guidance information.
** Gross operating margin, segment cash flow and adjusted EBITDA percentage estimates are provided for illustrative purposes.
Note: Adjusted EBITDA, segment cash flow and gross operating margin are non-GAAP financial measures and are explained on page 3.
Louisiana
Oklahoma
The Vehicle for Sustainable Growth
9
Cash Flow Stability from Long-Term Contracts
* Based on 2015 Guidance estimates.
** As previously disclosed, Devon assigned this contract to a subsidiary of Linn Energy, effective as of December 1, 2014
Note: Segment cash flow is a non-GAAP financial measure and is explained in greater detail on page 3.
~80% of EnLink’s cash flows are supported by long-term, fee-based contracts with either
firm transport agreements or minimum volume commitments.
% of 2015E
Segment
Cash Flow *
Devon Bridgeport Contract - fixed fee contract through 2023 with minimum volume commitments (MVC) through 2018
Devon East Johnson County Contract - fixed fee contract through 2023 with MVC through 2018
Existing FT Transmission & Gathering - Volume Commitments with remaining terms of 2-10 years
Bearkat Plant - Volume Commitment with 10 year term from initial flow
Devon Cana Contract - fixed fee contract through 2023 with MVC through 2018
Linn Northridge Contract ** - fixed fee contract through 2023 with MVC through 2018
North LIG Firm Transport - Reservation fee with avg remaining life of ~2 years
Firm Treating & Processing - Remaining term minimum ~2 years
Cajun-Sibon Phases I & II - 5 & 10 year agreements for supply and sale of key products
E2 Compression / Stabilization Contract - 7 years ~62%
~80%
ORV
% of Total Segment Cash Flow for 2015E *
~77%
Segment / Key Contract
Texas
Oklahoma
~92%
Louisiana
~83%
Devon Energy Today
 Balanced portfolio
 Q3 ’15 Production Mix: ~39% gas; 41% crude;
20% NGLs
 Projected 2016 E&P Capital: ~$2-2.5 Billion
 Devon’s long-term contracts with
EnLink provide stability of cash flows
 Fixed fee contracts with rate escalators through
2023
 Minimum volume commitments through 2018
 Potential for additional midstream
activity in:
 Permian Basin
 Anadarko Basin
 Eagle Ford
 Additional build-out in core assets
 New basins
10
Sponsored By a Leading North American E&P
Heavy Oil
Rockies Oil
Barnett Shale
Eagle Ford
Permian Basin
Anadarko Basin
Oil Assets
Liquids-Rich Gas Assets
The Four Avenues
for Growth
11
$193
$235
$1,000 $100
$925
$600 $215
$900 $143
$0
$500
$1,000
$1,500
$2,000
$2,500
$3,000
$3,500
$4,000
$4,500
$5,000
Executing on Our Growth Strategy
~$4.3 Billion of Growth Projects & Acquisitions
• EnLink is successfully executing on its four avenues for growth:
– Dropdowns
– Growing with Devon
– Organic Growth
– Mergers & Acquisitions
Oct. ‘14 Nov. ‘14 Jan. ‘15 Feb. ‘15 Feb. ‘15 Mar. ‘15 Apr. ‘15 May ‘15
Dropdowns
Acquisitions
Organic Projects
Dropdowns, Acquisitions, & Growth ProjectsCost $MM
Q4 ’15
12
Avenue 1: Drop Downs from Devon
Access Pipeline & NGPL Pipeline
 Three ~180 mile pipelines from Sturgeon
terminal to Devon’s thermal acreage
 ~30 miles of dual pipeline from Sturgeon
Terminal to Edmonton
 Capacity net to Devon:
- Blended bitumen: 170,000 Bbl/d
 Devon ownership: 50%
~$1B invested
 Potential completion in first half of 2016
Access Pipeline NGPL Pipeline
 ~92-mile, 20 inch natural gas pipeline from
SCOOP to EnLink’s Bridgeport facility in North
Texas
 EnLink plans to build pipeline from Cana plant
to NGPL, and then loop NGPL pipeline
 Potential capacity of multi-phase project: up to
400 MMcf/d
 Devon expects to acquire in early 2016;
potential drop down in first half of 2016 13
Avenue 2: Growing With Devon
Significant Growth Plans in Anadarko Basin
Devon Accelerating Activity
 New completion design enhances economics
̶ Cana wells delivering enhanced rates of return
̶ Encouraging early Meramec appraisal results
 Operating 5 rigs as of 9/30/15
̶ Expect to drill 75 Cana-Woodford & 40 Meramec
gross wells in 2015
̶ Plan to bring ~60 Cana-Woodford wells online by
year-end
 Deep, high quality inventory
̶ 280,000 net acres in Cana-Woodford
̶ 75,000 net acres in Meramec play
̶ >4,000 risked undrilled locations
EnLink Assets in the Cana-Woodford
 Pipeline: 410 miles, 530 MMcf/d capacity
 Processing: one plant with 350 MMcf/d capacity
40.2
32.6
27.2
23.4
Q4 2014 Q1 2015 Q2 2015 Q3 2015
Spud To Rig Release – Cana-
Woodford
(Days)
42%
Efficiency
Improvement
14
Avenue 3: Organic Growth Projects
Gas Supply Moving from Northeast to Gulf
Coast to Meet LNG and Industrial Markets
15Source: EIA/RBN Energy
0.0
1.0
2.0
3.0
4.0
5.0
6.0
7.0
8.0
9.0
Bcf/d
New Gas Pipelines to Gulf Coast
Source RBN Energy, January 2015
Avenues 3: Organic Growth
South Louisiana Market Leading Position
16
 Region defined by demand growth from industrial expansions and LNG exports
 Franchise NGL platform
 ~600 miles of NGL pipelines from Mont Belvieu to the Mississippi River market
 Four fractionators with ~194,000 Bbl/d of fractionation capacity
 Franchise natural gas platform
 Largest intrastate gas pipeline system in the state
 5 processing plants with ~1.7 Bcf/d of capacity
 ~11 Bcf of natural gas storage capacity
 Executing on multiple optimization projects from integrated systems
Avenue 4: Mergers & Acquisitions
Expanded Platforms in Midland & Delaware Basins
17
• Committed ~$1.2 billion of capital since 2011
• Three acquisitions to date in 2015
– LPC Crude Logistics: ~$100 MM
– Coronado Gas Gathering and Proc.: ~$600 MM
– Matador Gas Gathering & Proc: ~$143 MM
• Key customers are growing production & footprints
Source on Rigs Above: Rigdata, October 2015
* The Deadwood facility is a joint venture that is 50/50 owned by EnLink Midstream and Apache Corp.
*
18
Stability of cash flows
 ~95% of gross operating margin from fee-based contracts
 ~50% of gross operating margin from long-term Devon contracts
Top tier midstream energy service for our customers
 Mastio Service Award winner in 2014
Leverage Devon Energy sponsorship for growth
 Potential dropdown candidates from Devon in first half of 2016: Access Pipeline and NGPL
 Serving E&P portfolio in its growth areas
Strong organic growth
 South Louisiana and West Texas expansion projects
Top-tier balance sheet
 Investment grade credit rating at ENLK since inception
 Strong liquidity with a $1.5 billion credit facility
Note: Gross operating margin is a non-GAAP financial measure and is explained on page 3.
Our Strategy: Stability Plus Growth
A Unique Investment in the MLP Space

2015 Jefferies Energy Conference

  • 1.
    1Strong. Innovative. Growing. 2015Jefferies Energy Conference November 11, 2015
  • 2.
    Forward-Looking Statements This presentationcontains forward-looking statements within the meaning of the federal securities laws. Although these statements reflect the current views, assumptions and expectations of our management, the matters addressed herein involve certain assumptions, risks and uncertainties that could cause actual activities, performance, outcomes and results to differ materially than those indicated herein. Such forward-looking statements include, but are not limited to, statements about future financial and operating results, guidance, projected or forecasted financial results, objectives, project timing, expectations and intentions and other statements that are not historical facts. Factors that could result in such differences or otherwise materially affect our financial condition, results of operations and cash flows include, without limitation, (a) the dependence on Devon for a substantial portion of the natural gas that we gather, process and transport, (b) our lack of asset diversification, (c) our vulnerability to having a significant portion of our operations concentrated in the Barnett Shale, (d) the amount of hydrocarbons transported in our gathering and transmission lines and the level of our processing and fractionation operations, (e) fluctuations in oil, natural gas and NGL prices, (f) construction risks in our major development projects, (g) our ability to consummate future acquisitions, successfully integrate any acquired businesses, realize any cost savings and other synergies from any acquisition, (h) changes in the availability and cost of capital, (i) competitive conditions in our industry and their impact on our ability to connect hydrocarbon supplies to our assets, (j) operating hazards, natural disasters, weather-related delays, casualty losses and other matters beyond our control, (k) a failure in our computing systems or a cyber-attack on our systems, and (l) the effects of existing and future laws and governmental regulations, including environmental and climate change requirements and other uncertainties. These and other applicable uncertainties, factors and risks are described more fully in EnLink Midstream Partners, LP’s and EnLink Midstream, LLC’s filings (collectively, “EnLink Midstream”) with the Securities and Exchange Commission, including EnLink Midstream Partners, LP’s and EnLink Midstream, LLC’s Annual Reports on Form 10- K, Quarterly Reports on Form 10-Q and Current Reports on Form 8-K. Neither EnLink Midstream Partners, LP nor EnLink Midstream, LLC assumes any obligation to update any forward-looking statements contained herein. The assumptions and estimates underlying the forecasted financial information included in the guidance information in this presentation are inherently uncertain and, though considered reasonable by the EnLink Midstream management team as of the date of its preparation, are subject to a wide variety of significant business, economic, and competitive risks and uncertainties that could cause actual results to differ materially from those contained in the forecasted financial information. Accordingly, there can be no assurance that the forecasted results are indicative of EnLink Midstream’s future performance or that actual results will not differ materially from those presented in the forecasted financial information. Inclusion of the forecasted financial information in this presentation should not be regarded as a representation by any person that the results contained in the forecasted financial information will be achieved. 2
  • 3.
    Non-GAAP Financial Information Thispresentation contains non-generally accepted accounting principle financial measures that we refer to as gross operating margin and segment cash flow. Gross operating margin is defined as revenue minus the cost of sales. Segment cash flows is defined as revenue less the cost of purchased gas, NGLs, condensate, crude oil and operating and maintenance expenditures. Adjusted EBITDA is defined as net income from continuing operations plus interest expense, provision for income taxes, depreciation and amortization expense, impairment expense, unit-based compensation, (gain) loss on noncash derivatives, transaction costs, distribution of equity investment and non- controlling interest and income (loss) on equity investment. The amounts included in the calculation of these measures are computed in accordance with generally accepted accounting principles (GAAP). EnLink Midstream believes these measures are useful to investors because they may provide users of this financial information with meaningful comparisons between current results and prior-reported results and a meaningful measure of EnLink Midstream's cash flow after satisfaction of the capital and related requirements of their respective operations. Adjusted EBITDA, segment cash flows, gross operating margin, adjusted EBITDA of EMH, growth capital expenditures and maintenance capital expenditures, as defined above, are not measures of financial performance or liquidity under GAAP. They should not be considered in isolation or as an indicator of EnLink Midstream’s performance. Furthermore, they should not be seen as measures of liquidity or a substitute for metrics prepared in accordance with GAAP. Reconciliations of these measures to their most directly comparable GAAP measures are included in the Appendix to this presentation. 3
  • 4.
    4 Stability of cashflows  ~95% of gross operating margin from fee-based contracts  ~50% of gross operating margin from long-term Devon contracts Top tier midstream energy service for our customers  Mastio Service Award winner in 2014 Leverage Devon Energy sponsorship for growth  Potential dropdown candidates from Devon in first half of 2016: Access Pipeline and NGPL  Serving E&P portfolio in its growth areas Strong organic growth  South Louisiana and West Texas expansion projects Top-tier balance sheet  Investment grade credit rating at ENLK since inception  Strong liquidity with a $1.5 billion credit facility Note: Gross operating margin is a non-GAAP financial measure and is explained on page 3. Our Strategy: Stability Plus Growth A Unique Investment in the MLP Space
  • 5.
    5 EnLink Is UniqueAmong MLPs Public MLP Universe Gathering and Processing * 90%+ Fee-Based * Investment Grade Long Organic Growth History ~120 ~16 ~8 2 1 * Source: Barclay’s Energy Infrastructure Weekly, August 3, 2015; excludes large cap, diversified MLPs.
  • 6.
    The Vehicle forSustainable Growth Significant Size & Scale  ~ 9,200 miles of pipelines  17 gas processing plants, 3.6 Bcf/d capacity  7 NGL fractionators, 280,000 Bbl/d capacity Diversity of Basins  Barnett  Permian  Midcontinent: Cana & Arkoma-Woodford  Eagle Ford  Ohio River Valley: Utica & Marcellus  Louisiana: demand market (gas, NGLs) Diversity of Services  Natural Gas: transport, processing, storage & mktng.  NGL: transport, fractionation, storage & mktng.  Condensate: transport, storage & mktng.  Crude: transport, storage & mktng. 6 Powered By a Diverse Set of Assets & Services
  • 7.
    EnLink Midstream Partners,LP Master Limited Partnership NYSE: ENLK (BBB / Baa3) EnLink Midstream, LLC General Partner NYSE: ENLC Public Unitholders ~70% ~30% ~0.5% GP ~27% LP EnLink Midstream Holdings (formerly Devon Midstream Holdings) ~28% LP ~45% LP Devon Energy Corp. NYSE: DVN (BBB+ / Baa1) 100% The Vehicle for Sustainable Growth: MLP Structure with a Premier Sponsor 7 Dist./Q Split Level < $0.2500 2% / 98% < $0.3125 15% / 85% < $0.3750 25% / 75% > $0.3750 50% / 50% Q3-15 Dist./Q: $0.39 ENLC owns 100% of IDRs Note: The ownership percentages shown above are approximate and as of November 4, 2015.
  • 8.
    The Vehicle forSustainable Growth  Devon is EnLink Midstream’s largest customer (>50% of consolidated 2015E adjusted EBITDA*)  EnLink Midstream’s growth projects focused on crude/NGL services and rich gas processing  Strong emphasis on fee-based contracts 8 Diverse, Fee-Based Cash Flows 2015E EnLink Midstream Consolidated * 95% 5% Gross Operating Margin By Contract Type ** Texas 51% 26% Ohio 6% 17% Segment Cash Flow By Region ** 52% Devon 48% Other Gross Operating Margin By Customer ** Fee-Based Commodity Sensitive * Based on 2015 Guidance information. ** Gross operating margin, segment cash flow and adjusted EBITDA percentage estimates are provided for illustrative purposes. Note: Adjusted EBITDA, segment cash flow and gross operating margin are non-GAAP financial measures and are explained on page 3. Louisiana Oklahoma
  • 9.
    The Vehicle forSustainable Growth 9 Cash Flow Stability from Long-Term Contracts * Based on 2015 Guidance estimates. ** As previously disclosed, Devon assigned this contract to a subsidiary of Linn Energy, effective as of December 1, 2014 Note: Segment cash flow is a non-GAAP financial measure and is explained in greater detail on page 3. ~80% of EnLink’s cash flows are supported by long-term, fee-based contracts with either firm transport agreements or minimum volume commitments. % of 2015E Segment Cash Flow * Devon Bridgeport Contract - fixed fee contract through 2023 with minimum volume commitments (MVC) through 2018 Devon East Johnson County Contract - fixed fee contract through 2023 with MVC through 2018 Existing FT Transmission & Gathering - Volume Commitments with remaining terms of 2-10 years Bearkat Plant - Volume Commitment with 10 year term from initial flow Devon Cana Contract - fixed fee contract through 2023 with MVC through 2018 Linn Northridge Contract ** - fixed fee contract through 2023 with MVC through 2018 North LIG Firm Transport - Reservation fee with avg remaining life of ~2 years Firm Treating & Processing - Remaining term minimum ~2 years Cajun-Sibon Phases I & II - 5 & 10 year agreements for supply and sale of key products E2 Compression / Stabilization Contract - 7 years ~62% ~80% ORV % of Total Segment Cash Flow for 2015E * ~77% Segment / Key Contract Texas Oklahoma ~92% Louisiana ~83%
  • 10.
    Devon Energy Today Balanced portfolio  Q3 ’15 Production Mix: ~39% gas; 41% crude; 20% NGLs  Projected 2016 E&P Capital: ~$2-2.5 Billion  Devon’s long-term contracts with EnLink provide stability of cash flows  Fixed fee contracts with rate escalators through 2023  Minimum volume commitments through 2018  Potential for additional midstream activity in:  Permian Basin  Anadarko Basin  Eagle Ford  Additional build-out in core assets  New basins 10 Sponsored By a Leading North American E&P Heavy Oil Rockies Oil Barnett Shale Eagle Ford Permian Basin Anadarko Basin Oil Assets Liquids-Rich Gas Assets
  • 11.
  • 12.
    $193 $235 $1,000 $100 $925 $600 $215 $900$143 $0 $500 $1,000 $1,500 $2,000 $2,500 $3,000 $3,500 $4,000 $4,500 $5,000 Executing on Our Growth Strategy ~$4.3 Billion of Growth Projects & Acquisitions • EnLink is successfully executing on its four avenues for growth: – Dropdowns – Growing with Devon – Organic Growth – Mergers & Acquisitions Oct. ‘14 Nov. ‘14 Jan. ‘15 Feb. ‘15 Feb. ‘15 Mar. ‘15 Apr. ‘15 May ‘15 Dropdowns Acquisitions Organic Projects Dropdowns, Acquisitions, & Growth ProjectsCost $MM Q4 ’15 12
  • 13.
    Avenue 1: DropDowns from Devon Access Pipeline & NGPL Pipeline  Three ~180 mile pipelines from Sturgeon terminal to Devon’s thermal acreage  ~30 miles of dual pipeline from Sturgeon Terminal to Edmonton  Capacity net to Devon: - Blended bitumen: 170,000 Bbl/d  Devon ownership: 50% ~$1B invested  Potential completion in first half of 2016 Access Pipeline NGPL Pipeline  ~92-mile, 20 inch natural gas pipeline from SCOOP to EnLink’s Bridgeport facility in North Texas  EnLink plans to build pipeline from Cana plant to NGPL, and then loop NGPL pipeline  Potential capacity of multi-phase project: up to 400 MMcf/d  Devon expects to acquire in early 2016; potential drop down in first half of 2016 13
  • 14.
    Avenue 2: GrowingWith Devon Significant Growth Plans in Anadarko Basin Devon Accelerating Activity  New completion design enhances economics ̶ Cana wells delivering enhanced rates of return ̶ Encouraging early Meramec appraisal results  Operating 5 rigs as of 9/30/15 ̶ Expect to drill 75 Cana-Woodford & 40 Meramec gross wells in 2015 ̶ Plan to bring ~60 Cana-Woodford wells online by year-end  Deep, high quality inventory ̶ 280,000 net acres in Cana-Woodford ̶ 75,000 net acres in Meramec play ̶ >4,000 risked undrilled locations EnLink Assets in the Cana-Woodford  Pipeline: 410 miles, 530 MMcf/d capacity  Processing: one plant with 350 MMcf/d capacity 40.2 32.6 27.2 23.4 Q4 2014 Q1 2015 Q2 2015 Q3 2015 Spud To Rig Release – Cana- Woodford (Days) 42% Efficiency Improvement 14
  • 15.
    Avenue 3: OrganicGrowth Projects Gas Supply Moving from Northeast to Gulf Coast to Meet LNG and Industrial Markets 15Source: EIA/RBN Energy 0.0 1.0 2.0 3.0 4.0 5.0 6.0 7.0 8.0 9.0 Bcf/d New Gas Pipelines to Gulf Coast Source RBN Energy, January 2015
  • 16.
    Avenues 3: OrganicGrowth South Louisiana Market Leading Position 16  Region defined by demand growth from industrial expansions and LNG exports  Franchise NGL platform  ~600 miles of NGL pipelines from Mont Belvieu to the Mississippi River market  Four fractionators with ~194,000 Bbl/d of fractionation capacity  Franchise natural gas platform  Largest intrastate gas pipeline system in the state  5 processing plants with ~1.7 Bcf/d of capacity  ~11 Bcf of natural gas storage capacity  Executing on multiple optimization projects from integrated systems
  • 17.
    Avenue 4: Mergers& Acquisitions Expanded Platforms in Midland & Delaware Basins 17 • Committed ~$1.2 billion of capital since 2011 • Three acquisitions to date in 2015 – LPC Crude Logistics: ~$100 MM – Coronado Gas Gathering and Proc.: ~$600 MM – Matador Gas Gathering & Proc: ~$143 MM • Key customers are growing production & footprints Source on Rigs Above: Rigdata, October 2015 * The Deadwood facility is a joint venture that is 50/50 owned by EnLink Midstream and Apache Corp. *
  • 18.
    18 Stability of cashflows  ~95% of gross operating margin from fee-based contracts  ~50% of gross operating margin from long-term Devon contracts Top tier midstream energy service for our customers  Mastio Service Award winner in 2014 Leverage Devon Energy sponsorship for growth  Potential dropdown candidates from Devon in first half of 2016: Access Pipeline and NGPL  Serving E&P portfolio in its growth areas Strong organic growth  South Louisiana and West Texas expansion projects Top-tier balance sheet  Investment grade credit rating at ENLK since inception  Strong liquidity with a $1.5 billion credit facility Note: Gross operating margin is a non-GAAP financial measure and is explained on page 3. Our Strategy: Stability Plus Growth A Unique Investment in the MLP Space