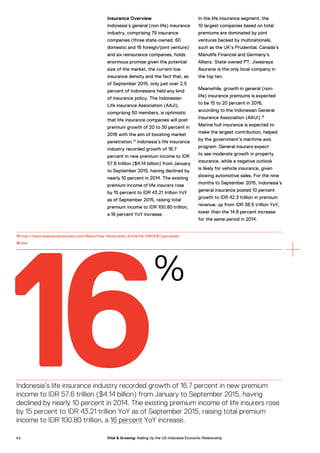
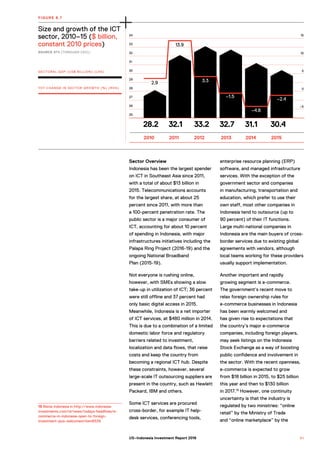
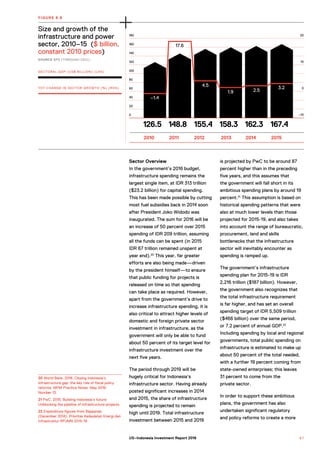
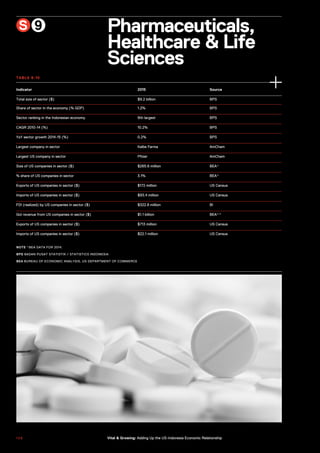
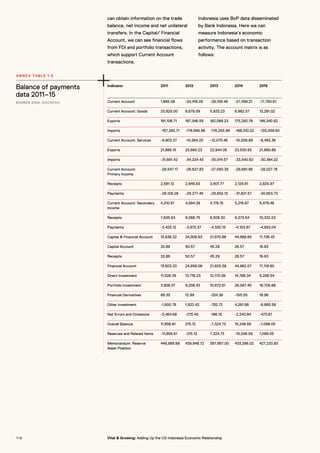
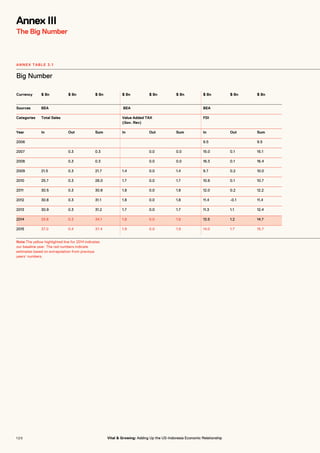
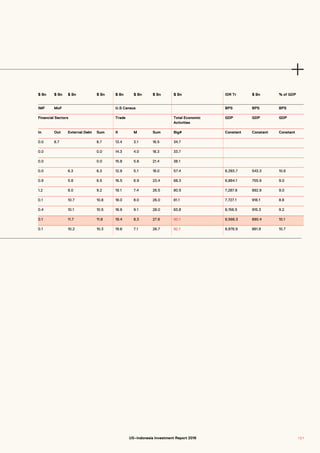
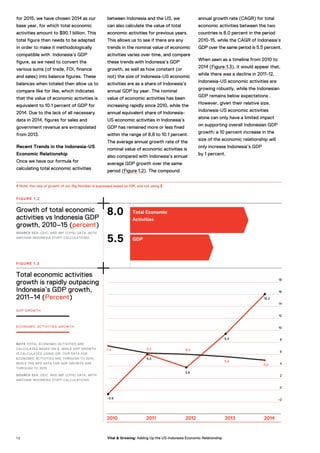
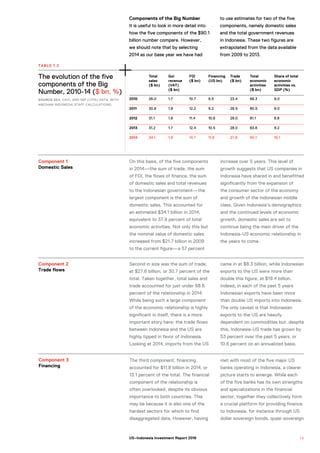
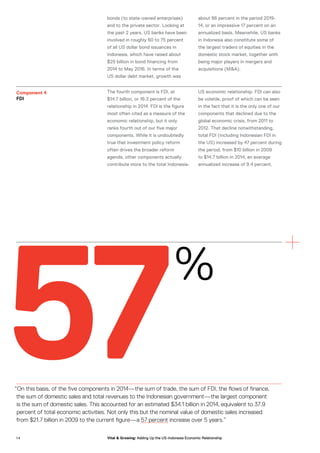
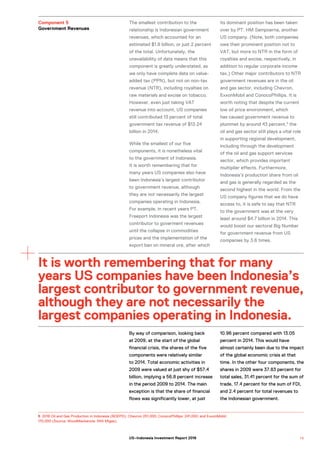
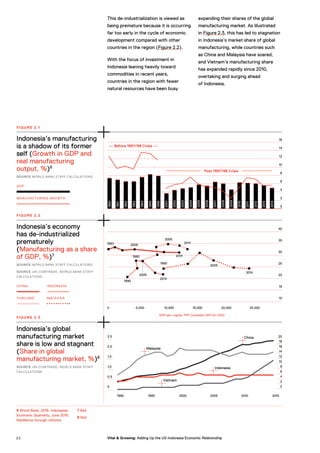
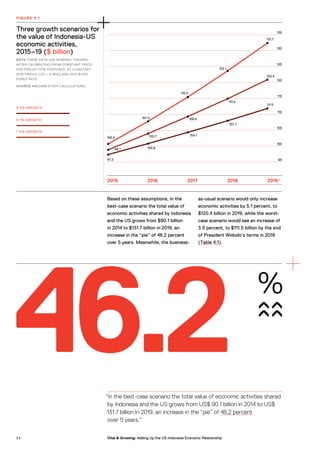
The report summarizes the total economic relationship between the US and Indonesia in 2014 as $90.1 billion ("the Big Number"). This figure represents 10.1% of Indonesia's GDP that year and has grown at an average annual rate of 8% from 2010-2015, outpacing Indonesia's GDP growth of 5.5% over the same period. The Big Number includes five components: domestic sales ($34.1B), bilateral trade ($27.6B), FDI ($14.7B), finance ($11.8B), and government revenue ($1.8B). Domestic sales make up the largest share, followed by trade, FDI, finance, and revenue.


![play on the minds of legislators there
is an increasing likelihood that the
passage of the draft law will be delayed.
Finally, there is the concern shared
by many foreign investors across
the country that the ability to
bring in foreign talent is becoming
increasingly difficult. US companies
in general employ a far higher share
of Indonesians than foreign workers,
with our 2016 survey of US companies
showing that US companies employ on
average about 1,160 Indonesia workers
for every expat employee. However,
there is often a limited availability of
locally sourced skills and technical
capacity. It is therefore crucially
important that companies are allowed
to bring in foreign talent according to
their own needs, not only to maximize
production but also to help transfer
knowledge, expertise and experience
to local employees. Restrictions on the
employment of foreign workers, and
the ease with which they can come and
go depending on work requirements,
also make it very hard for potential
investors to consider making
Indonesian a regional hub or ASEAN
headquarters. While some of the more
impractical suggestions such as forcing
all foreign workers to become fluent in
Indonesian have been quietly shelved,
the issue remains of considerable
concern, and appears to fly in the face
of President Joko Widodo’s appeals for
greater foreign investment in Indonesia.
The Role of US Companies in
the Sector
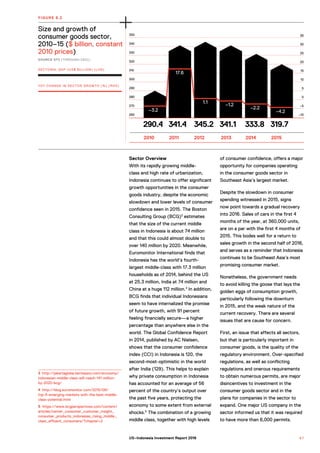
As the largest sector in the economy,
the consumer goods sector also sees
the largest total economic activities by
US companies across all nine sectors
in our analysis, at $22.6 billion, or 7.1
percent of the total. The sector has
remained robust despite the economic
slowdown, posting a CAGR of 3.5
percent in 2010-14. However, the
year-on-year growth seen in 2014-
15 was -4.2 percent, confirming that
2015 was a tough year. Noteworthy
US companies operating in this sector
include 3M, ACE Hardware, Amway,
Coca Cola, General Motors, Goodyear,
HM Sampoerna, Levi Strauss, Mattel,
Procter and Gamble (P&G), UL
(Underwriter Laboratories), and food
outlets such as Starbucks, Burger King,
KFC, McDonalds, Pizza Hut
and Wendy’s.
Our 2016 survey of US
companies show[s] that
US companies employ
on average about 1,160
Indonesia workers for
every expat employee.
7 0 Vital & Growing: Adding Up the US-Indonesia Economic Relationship](https://image.slidesharecdn.com/06303e24-65e6-4806-8c88-e70580f6f330-170130104037/85/16-09-14-AmchamInvestmentReport-FULL-72-320.jpg)