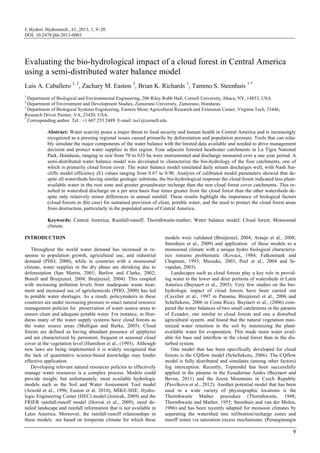
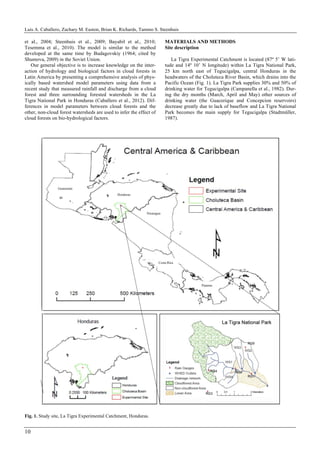
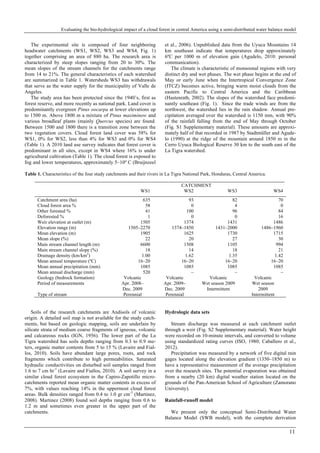
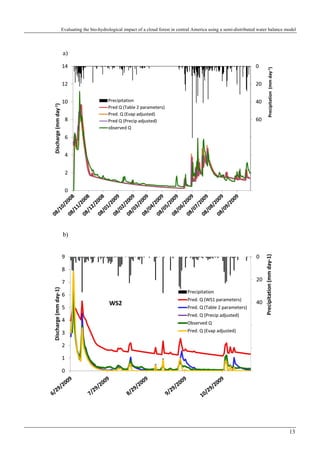
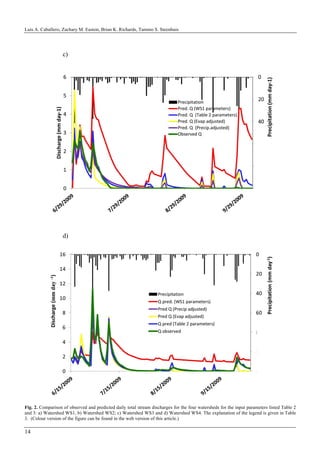
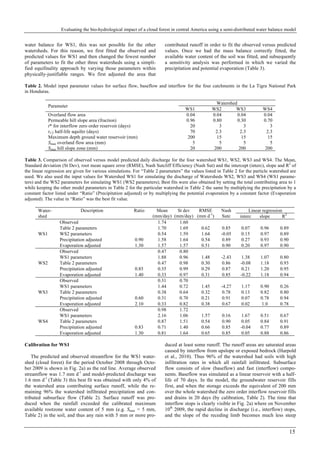
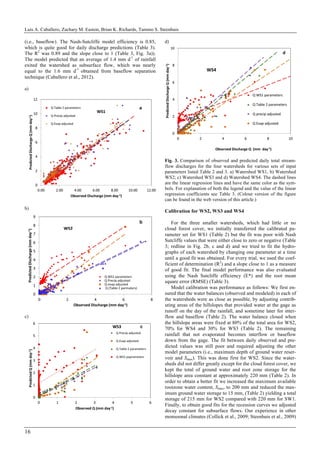
J. Hydrol. Hydromech., 61, 2013, 1, 9–20
DOI: 10.2478/jhh-2013-0003
9
Evaluating the bio-hydrological impact of a cloud forest in Central America
using a semi-distributed water balance model
Luis A. Caballero 1, 2
, Zachary M. Easton 3
, Brian K. Richards 1
, Tammo S. Steenhuis 1 *
1
Department of Biological and Environmental Engineering, 206 Riley Robb Hall, Cornell University, Ithaca, NY, 14853, USA.
2
Department of Environment and Development Studies, Zamorano University, Zamorano, Honduras.
3
Department of Biological Systems Engineering, Eastern Shore Agricultural Research and Extension Center, Virginia Tech, 33446,
Research Driver Painter, VA, 23420, USA.
*
Corresponding author. Tel.: +1 607 255 2489. E-mail: tss1@cornell.edu
Abstract: Water scarcity poses a major threat to food security and human health in Central America and is increasingly
recognized as a pressing regional issues caused primarily by deforestation and population pressure. Tools that can relia-
bly simulate the major components of the water balance with the limited data available and needed to drive management
decision and protect water supplies in this region. Four adjacent forested headwater catchments in La Tigra National
Park, Honduras, ranging in size from 70 to 635 ha were instrumented and discharge measured over a one year period. A
semi-distributed water balance model was developed to characterize the bio-hydrology of the four catchments, one of
which is primarily cloud forest cover. The water balance model simulated daily stream discharges well, with Nash Sut-
cliffe model efficiency (E) values ranging from 0.67 to 0.90. Analysis of calibrated model parameters showed that de-
spite all watersheds having similar geologic substrata, the bio-hydrological response the cloud forest indicated less plant-
available water in the root zone and greater groundwater recharge than the non cloud forest cover catchments. This re-
sulted in watershed discharge on a per area basis four times greater from the cloud forest than the other watersheds de-
spite only relatively minor differences in annual rainfall. These results highlight the importance of biological factors
(cloud forests in this case) for sustained provision of clean, potable water, and the need to protect the cloud forest areas
from destruction, particularly in the populated areas of Central America.
Keywords: Central America; Rainfall-runoff; Thornthwaite-mather; Water balance model; Cloud forest; Monsoonal
climate.
INTRODUCTION
Throughout the world water demand has increased in re-
sponse to population growth, agricultural use, and industrial
demand (PHO, 2000), while in countries with a monsoonal
climate, water supplies in the dry phase are shrinking due to
deforestation (San Martin, 2001; Barlow and Clarke, 2002;
Bonell and Bruijnzeel, 2004; Bruijnzeel, 2004). This coupled
with increasing pollution levels from inadequate waste treat-
ment and increased use of agrichemicals (PHO, 2000) has led
to potable water shortages. As a result, policymakers in these
countries are under increasing pressure to enact natural resource
management policies for preservation of water source areas to
ensure clean and adequate potable water. For instance, in Hon-
duras many of the water supply systems have cloud forests as
the water source areas (Mulligan and Burke, 2005). Cloud
forests are defined as having abundant presence of epiphytes
and are characterized by persistent, frequent or seasonal cloud
cover at the vegetation level (Hamilton et al., (1993). Although
new laws are being implemented it is widely recognized that
the lack of quantitative science-based knowledge may hinder
effective application.
Developing relevant natural resources policies to effectively
manage water resources is a complex process. Models could
provide insight, but unfortunately, most available hydrologic
models such as the Soil and Water Assessment Tool model
(Arnold et al., 1996; Easton et al. 2010), MIKE-SHE, Hydro-
logic Engineering Center (HEC) model (Jenícek, 2009) and the
FRIER rainfall-runoff model (Horvat et al., 2009), need de-
tailed landscape and rainfall information that is not available in
Latin America. Moreover, the rainfall-runoff relationships in
these models are based on temperate climate for which these
models were validated (Bruijnzeel, 2004; Araujo et al., 2008;
Steenhuis et al., 2009) and application of these models to a
monsoonal climate with a unique hydro biological characteris-
tics remains problematic (Kovacs, 1984; Falkenmark and
Chapman, 1993; Musiake, 2003; Peel et al., 2004 and Si-
vapalan, 2003).
Landscapes such as cloud forests play a key role in provid-
ing water to the lower and drier portions of watersheds in Latin
America (Buytaert et al., 2005). Very few studies on the bio-
hydrologic impact of cloud forests have been carried out
(Cavelier et al., 1997 in Panama; Bruijnzeel et al., 2006 and
Schellekens, 2006 in Costa Rica). Buytaert et al., (2006) com-
pared the water balances of two small catchments in the páramo
of Ecuador, one similar to cloud forests and one a disturbed
agricultural system. and found that the natural vegetation max-
imized water retention in the soil by minimizing the plant-
available water for evaporation. This made more water avail-
able for base and interflow in the cloud forest than in the dis-
turbed system.
One model that has been specifically developed for cloud
forests is the CQflow model (Schellekens, 2006). The CQflow
model is fully distributed and simulates (among other factors)
fog interception. Recently, Topmodel has been successfully
applied in the páramo in the Ecuadorian Andes (Buytaert and
Beven, 2011) and the Jizera Mountains in Czech Republic
(Pavelkova et al., 2012). Another potential model that has been
used in a wide variety of physiographic locations is the
Thornthwaite Mather procedure (Thornthwaite, 1948;
Thornthwaite and Mather, 1955; Steenhuis and van der Molen,
1986) and has been recently adapted for monsoon climates by
separating the watershed into infiltration/recharge zones and
runoff zones via saturation excess mechanisms. (Peranginangin
Luis A. Caballero, Zachary M. Easton, Brian K. Richards, Tammo S. Steenhuis
10
et al., 2004; Steenhuis et al., 2009; Bayabil et al., 2010;
Tesemma et al., 2010). The model is similar to the method
developed at the same time by Budagovskiy (1964; cited by
Shumova, 2009) in the Soviet Union.
Our general objective is to increase knowledge on the inter-
action of hydrology and biological factors in cloud forests in
Latin America by presenting a comprehensive analysis of phys-
ically based watershed model parameters using data from a
recent study that measured rainfall and discharge from a cloud
forest and three surrounding forested watersheds in the La
Tigra National Park in Honduras (Caballero et al., 2012). Dif-
ferences in model parameters between cloud forests and the
other, non-cloud forest watersheds are used to infer the effect of
cloud forests on bio-hydrological factors.
MATERIALS AND METHODS
Site description
La Tigra Experimental Catchment is located (87º 5’ W lati-
tude and 14º 10’ N longitude) within La Tigra National Park,
25 km north east of Tegucigalpa, central Honduras in the
headwaters of the Choluteca River Basin, which drains into the
Pacific Ocean (Fig. 1). La Tigra Park supplies 30% and 50% of
drinking water for Tegucigalpa (Campanella et al., 1982). Dur-
ing the dry months (March, April and May) other sources of
drinking water (the Guacerique and Concepcion reservoirs)
decrease greatly due to lack of baseflow and La Tigra National
Park becomes the main supply for Tegucigalpa (Stadtmüller,
1987).
Fig. 1. Study site, La Tigra Experimental Catchment, Honduras.
Evaluating the bio-hydrological impact of a cloud forest in central America using a semi-distributed water balance model
11
The experimental site is composed of four neighboring
headwater catchments (WS1, WS2, WS3 and WS4, Fig. 1)
together comprising an area of 880 ha. The research area is
characterized by steep slopes ranging from 20 to 30%. The
mean slopes of the stream channels for the catchments range
from 14 to 21%. The general characteristics of each watershed
are summarized in Table 1. Watersheds WS3 has withdrawals
that serve as the water supply for the municipality of Valle de
Angeles.
The study area has been protected since the 1940’s, first as
forest reserve, and more recently as national park. Land cover is
predominantly evergreen Pinus oocarpa at lower elevations up
to 1500 m. Above 1800 m a mixture of Pinus maximinow and
various broadleaf plants (mainly Quercus species) are found.
Between 1500 and 1800 there is a transition zone between the
two vegetation covers. Cloud forest land cover was 58% for
WS1, 0% for WS2, less than 4% for WS3 and 0% for WS4
(Table 1). A 2010 land use survey indicates that forest cover is
predominant in all sites, except in WS4 where 16% is under
agricultural cultivation (Table 1). The cloud forest is exposed to
fog and lower temperatures, approximately 5–10º C (Bruijnzeel
et al., 2006). Unpublished data from the Uyuca Mountains 14
km southeast indicate that temperatures drop approximately
6ºC per 1000 m of elevation gain (Agudelo, 2010: personal
communication).
The climate is characteristic of monsoonal regions with very
distinct dry and wet phases. The wet phase begins at the end of
May or early June when the Intertropical Convergence Zone
(ITCZ) becomes active, bringing warm moist clouds from the
eastern Pacific to Central America and the Caribbean
(Hastenrath, 2002). The slopes of the watershed face predomi-
nantly southeast (Fig. 1). Since the trade winds are from the
northwest, the watershed lies in the rain shadow. Annual pre-
cipitation averaged over the watershed is 1150 mm, with 90%
of the rainfall falling from the end of May through October
(Fig. S1 Supplementary material). These amounts are approxi-
mately half of that recorded in 1987 by Stadtmüller and Agude-
lo (1990) at the ridge of the mountain around 1850 m in the
Cerro Uyuca Biological Reserve 30 km to the south east of the
La Tigra watershed.
Table 1. Characteristics of the four study catchments and their rivers in La Tigra National Park, Honduras, Central America.
CATCHMENT
WS1 WS2 WS3 WS4
Catchment area (ha)
Cloud forest area %
Other forested %
Deforested %
635
58
41
1
93
0
100
0
82
4
96
0
70
0
84
16
Weir elevation at outlet (m) 1505 1374 1431 1486
Elevation range (m) 1505–2270 1374–1850 1431–2000 1486–1960
Mean elevation (m) 1905 1625 1730 1715
Mean slope (%) 22 20 27 30
Main stream channel length (m) 6600 1508 1105 994
Main stream channel slope (%) 18 14 18 21
Drainage density (km/km2
) 1.00 1.62 1.35 1.42
Mean annual temperature (ºC) 16–20 16–20 16–20 16–20
Mean annual precipitation (mm) 1085 1085 1085 1085
Mean annual discharge (mm) 520 – – –
Geology (bedrock formation) Volcanic Volcanic Volcanic Volcanic
Period of measurements
Type of stream
Apr. 2008–
Dec. 2009
Perennial
Apr. 2009–
Dec. 2009
Perennial
Wet season 2009
Intermittent
Wet season
2009
Intermittent
Soils of the research catchments are Andisols of volcanic
origin. A detailed soil map is not available for the study catch-
ments, but based on geologic mapping, soils are underlain by
silicate strata of medium coarse fragments of igneous, volcanic
and calcareous rocks (IGN, 1956). The lower part of the La
Tigra watershed has soils depths ranging from 0.3 to 0.9 me-
ters, organic matter contents from 5 to 15 % (Lavaire and Fial-
los, 2010). Soils have abundant large pores, roots, and rock
fragments which contribute to high permeabilities. Saturated
hydraulic conductivities on disturbed soil samples ranged from
1.6 to 7 cm hr-1
(Lavaire and Fiallos, 2010). A soil survey in a
similar cloud forest ecosystem in the Capiro-Zapotillo micro-
catchments reported mean organic matter contents in excess of
7%, with values reaching 14% in the uppermost cloud forest
areas. Bulk densities ranged from 0.4 to 1.0 gr cm-3
(Martinez,
2008). Martinez (2008) found soil depths ranging from 0.6 to
1.2 m and sometimes even greater in the upper part of the
catchments.
Hydrologic data sets
Stream discharge was measured at each catchment outlet
through a weir (Fig. S2 Supplementary material). Water height
were recorded on 10-minute intervals, and converted to volume
using standardized rating curves (ISO, 1980; Caballero et al.,
2012).
Precipitation was measured by a network of five digital rain
gages located along the elevation gradient (1350–1850 m) to
have a representative measurement of the average precipitation
over the research sites. The potential evaporation was obtained
from a nearby (20 km) digital weather station located on the
grounds of the Pan-American School of Agriculture (Zamorano
University).
Rainfall-runoff model
We present only the conceptual Semi-Distributed Water
Balance Model (SWB model), with the complete derivation
Luis A. Caballero, Zachary M. Easton, Brian K. Richards, Tammo S. Steenhuis
12
from Tesemma et al. (2010) (available in preprint form
at http://soilandwater.bee.cornell.edu/publications/zelalemblue-
nile-2012.pdf). The model as shown by Walter et al. (2002) is
mathematically similar to Topmodel with the exponential de-
creasing conductivity as used by Buytaert and Beven (2011).
However, in Topmodel the entire watershed is underlain by a
regional groundwater table that periodically intersects the soils
surface generating runoff while in the SWB model shallow
perched water tables over a slowly permeable layer govern the
formation of saturated runoff producing areas. In the SWB
model the landscape is divided into two regions: well-drained
hillslopes, and the flatter near stream areas that become saturat-
ed during the wet season due to upslope flow contributions. The
hillslopes are further subdivided into two groups: degraded
areas that have the hardpan exposed at the soil surface, and
highly permeable soils above a restrictive layer at some depth.
In the degraded areas (or rock outcrops) that have restricted
infiltration, only a small amount of water can be stored before
saturation excess surface runoff occurs. In contrast, on the
highly permeable portion of the hillslopes, most of the water is
transported as rapid subsurface flow (i.e., interflow over a
restrictive layer) or as base flow that percolates from the soil
profile to deeper subsoil and rock layers (Šanda and Císlerová,
2009, Steenhuis et al., 2009, Bayabil et al., 2010). The flatter
areas that drain the surrounding hillslopes become runoff
source areas when part of the profile is at or near saturation.
Three separate water balances are calculated for each region.
The water balance for the each of the three areas can be written
as:
S s(t) = S s(t ! "t) + P ! Ea ! R ! Perc#$ %&"t, (1)
where Ss(t) is volume of plant available water in the soil profile
above the restrictive layer per unit area (L), at time t (T), Ss(t–
Δt) is the previous time step water storage (L), P is rainfall (L
T-1
), Ea is actual evapotranspiration (L T-1
), R is saturation
excess runoff (L T-1
), Perc is percolation to the subsoil (L T-1
)
and Δt is the time step (1 day in our case). Percolation from the
infiltration zone occurs when the moisture inputs exceed field
capacity. Surface runoff is produced when the soil is saturated
and is equal to the amount of rainfall minus the water needed to
saturate the soil profile. The actual evaporation from the soil, Ea
is calculated with the Thornthwaite-Mather procedure
(Thornthwaite, 1948; Thornthwaite and Mather, 1955; Steen-
huis and van der Molen, 1986). The method assume that evapo-
ration decreases linearly with soil moisture content between
field capacity (at which point Ea equals potential evaporation)
and the wilting point (at which Ea is zero). Once precipitation
has infiltrated below the root zone there are two reservoirs, one
for baseflow and one for interflow. The baseflow reservoir is
associated with the groundwater in the near stream area and is
simulated as linear reservoir with exponentially decreasing
discharge. The interflow reservoir simulates water flowing
down the slope over the restrictive layer and is a zero order
reservoir (e.g., the discharge decreases linearly with reservoir
volume).
Evaluation of model performance
To evaluate how well the predicted discharge matched ob-
served values, we used the Nash-Sutcliffe model efficiency
coefficient (E) or goodness-of-fit index (Nash-Sutcliffe, 1970),
which is widely used to evaluate the predictive capacity of
hydrologic models. In addition, the performance of the model
during calibration was evaluated using the normalized root
mean squared error (RMSE) and regression coefficient, R2
.
RESULTS
The hydrographs of the four watersheds in the La Tigra Na-
tional Park were distinctly different (solid black lines in Fig. 2).
In WS1 (cloud forest, Fig. 2a) the hydrograph is characterized
by an initially steep receding limb (October–December) becom-
ing more and more shallow until the next rainfall season begins,
usually in late May. Although smallest WS2 has streamflow
throughout the year, the discharge is less than in WS1 and thus
the portion of rain converted to streamflow is smaller (Fig. 2b).
In the two watersheds WS3 (Fig. 2c) and WS4 (Fig. 2d), there
was only discharge in the wet, monsoon phase. In general, WS1
and WS2 have similar runoff responses during the wet season
(Figs 2a and 2b). In WS3 and WS4, discharge drastically de-
clines during the short rainless period between the wet seasons
(Figs 2c and 2d).
In the following sections, we use the SWB model parameters
to investigate hydrological processes and how these parameters
can explain differences in hydrological behavior among the
four watersheds. The SWB model is a mathematical relation-
ship between rainfall and evaporation (as input parameters) and
the watershed discharge (as an output). Because the hydrograph
is the output signal that integrates all processes that occur in the
watershed, it is unlikely parameters resulting in a poor fit repre-
sent the physical processes occurring in the watershed. This
approach, however, does not give insight into selecting from
among potential mechanisms whether they all fit the model
with equal precision. Hence, when a good fit is obtained be-
tween observed and predicted outflow, we can assume that the
hydrologic processes in the underlying model structure are
valid. For example if the total discharge does not vary as a
function of rainfall intensity, infiltration excess is likely not
occurring in the watershed.
Model fitting
The semi-distributed SWB model applied here used the pre-
cipitation and potential evaporation as climatic input data to
estimate the water balance. For precipitation (P), daily arithme-
tic averages obtained from either three or four digital rain gages
were used and thus daily precipitation model inputs were the
same for all catchments (Fig. S3 in Supplementary material).
Potential evaporation (PE) data from a nearby (20 km) weather
station was used, which ranged from 1.3 to 5.6 mm d-1
, with an
average of 3.6 mm d-1
over the measurement period a value
quite similar to the 3.5 mm d-1
used in monsoonal climate of
Ethiopia (Collick, et al., 2009) and in the Caribbean (2.1–3.7
mm d-1
, Charlier et al., 2008). Other parameters needed to
simulate the discharge included soil water storage capacity for
the hillslopes and runoff contributing areas. The saturated areas
were designated as those areas at the foot of the hills where
saturation excess runoff is generated as well as areas of exposed
bedrock (see picture S4 in Supplementary material). Saturation
excess runoff in these highly conductive soils does not neces-
sarily mean that the water table is at the surface. Only part of
the soil profile needs be saturated for interflow to occur (Lyon
et al., 2006). The hillslopes act as sources of the recharge to the
aquifer and contribute flow to the saturated runoff generating
areas via interflow from upslope areas.
We initially planned to calibrate the model for WS1 and then
validated the model for the other watersheds, but once the data
were analyzed it became clear that although we could close the
Evaluating the bio-hydrological impact of a cloud forest in central America using a semi-distributed water balance model
13
a)
b)
Luis A. Caballero, Zachary M. Easton, Brian K. Richards, Tammo S. Steenhuis
14
c)
d)
Fig. 2. Comparison of observed and predicted daily total stream discharges for the four watersheds for the input parameters listed Table 2
and 3: a) Watershed WS1, b) Watershed WS2; c) Watershed WS3 and d) Watershed WS4. The explanation of the legend is given in Table
3. (Colour version of the figure can be found in the web version of this article.)
Evaluating the bio-hydrological impact of a cloud forest in central America using a semi-distributed water balance model
15
water balance for WS1, this was not possible for the other
watersheds. For this reason, we first fitted the observed and
predicted values for WS1 and then changed the fewest number
of parameters to fit the other three watersheds using a simpli-
fied equifinality approach by varying those parameters within
physically-justifiable ranges. We first adjusted the area that
contributed runoff in order to fit the observed versus predicted
values. Once we had the mass balance correctly fitted, the
available water content of the soil was fitted, and subsequently
a sensitivity analysis was performed in which we varied the
precipitation and potential evaporation (Table 3).
Table 2. Model input parameter values for surface flow, baseflow and interflow for the four catchments in the La Tigra National Park
in Honduras.
Parameter
Watershed
WS1 WS2 WS3 WS4
Overland flow area 0.04 0.04 0.04 0.04
Permeable hill slope area (fraction) 0.96 0.80 0.30 0.70
t* for interflow zero order reservoir (days) 20 3 3 3
t1/2 half-life aquifer (days) 70 2.3 2.3 2.3
Maximum depth ground water reservoir (mm) 200 15 15 15
Smax overland flow area (mm) 5 5 5 5
Smax hill slope zone (mm) 20 200 200 200
Table 3. Comparison of observed versus model predicted daily discharge for the four watershed WS1, WS2, WS3 and WS4. The Mean,
Standard deviation (St Dev), root mean square error (RMSE), Nash Sutcliff Efficiency (Nash Sut) and the intercept (interc), slope and R2
of
the linear regression are given for various simulations. For “Table 2 parameters” the values listed in Table 2 for the particle watershed are
used. We also used the input values for Watershed WS1 for simulating the discharge of Watersheds WS2, WS3 and WS4 (WS1 parame-
ters) and the WS2 parameters for simulating WS1 (WS2 parameters); Best fits were also obtained by setting the total contributing area to 1
while keeping the other model parameters in Table 2 for the particular watershed in Table 2 the same by multiplying the precipitation by a
constant factor listed under “Ratio” (Precipitation adjusted) or by multiplying the potential evaporation by a constant factor (Evaporation
adjusted). The value in “Ratio” was the best fit value.
Water-
shed
Description Ratio Mean
(mm/day)
St dev
(mm/day)
RMSE
(mm d-1
)
Nash
Sutc
Linear regression
interc slope R2
WS1
Observed 1.74 1.60
Table 2 parameters 1.70 1.69 0.62 0.85 0.07 0.96 0.89
WS2 parameters 0.54 1.59 1.64 -0.05 0.15 0.97 0.89
Precipitation adjusted 0.90 1.58 1.64 0.54 0.89 0.27 0.93 0.90
Evaporation adjusted 1.30 1.57 1.57 0.51 0.90 0.20 0.97 0.90
WS2
Observed 0.47 0.80
WS1 parameters 1.88 0.96 1.48 -2.43 1.38 1.07 0.80
Table 2 parameters 0.47 0.98 0.30 0.86 -0.08 1.18 0.93
Precipitation adjusted 0.85 0.35 0.99 0.29 0.87 0.21 1.20 0.95
Evaporation adjusted 1.40 0.33 0.97 0.31 0.85 -0.22 1.18 0.94
WS3
Observed 0.31 0.70
WS1 parameters 1.44 0.72 1.45 -4.27 1.17 0.90 0.26
Table 2 parameters 0.38 0.64 0.32 0.78 0.13 0.82 0.80
Precipitation adjusted 0.60 0.31 0.70 0.21 0.91 0.07 0.78 0.94
Evaporation adjusted 2.10 0.33 0.82 0.38 0.67 0.02 1.0 0.78
WS4
Observed 0.98 1.72
WS1 parameters 2.16 1.06 1.57 0.16 1.67 0.51 0.67
Table 2 parameters 0.87 1.51 0.54 0.90 0.05 0.84 0.91
Precipitation adjusted 0.83 0.71 1.40 0.66 0.85 -0.04 0.77 0.89
Evaporation adjusted 1.30 0.81 1.64 0.65 0.85 0.05 0.88 0.86
Calibration for WS1
The predicted and observed streamflow for the WS1 water-
shed (cloud forest) for the period October 2008 through Octo-
ber 2009 is shown in Fig. 2a) as the red line. Average observed
streamflow was 1.7 mm d-1
and model-predicted discharge was
1.6 mm d-1
(Table 3) this best fit was obtained with only 4% of
the watershed area contributing surface runoff, while the re-
maining 96% the watershed infiltrated precipitation and con-
tributed subsurface flow (Table 2). Surface runoff was pro-
duced when the rainfall exceeded the calibrated maximum
available rootzone water content of 5 mm (e.g. Smax = 5 mm,
Table 2) in the soil, and thus any rain with 5 mm or more pro-
duced at least some runoff. The runoff areas are saturated areas
caused by interflow from upslope or exposed bedrock (Harpold
et al., 2010). Thus 96% of the watershed had soils with high
infiltration rates in which all rainfall infiltrated. Subsurface
flow consists of slow (baseflow) and fast (interflow) compo-
nents. Baseflow was simulated as a linear reservoir with a half-
life of 70 days. In the model, the groundwater reservoir fills
first, and when the storage exceeds the equivalent of 200 mm
over the whole watershed the zero order interflow reservoir fills
and drains in 20 days (by calibration, Table 2). The time that
interflow stops is clearly visible in Fig. 2a) where on November
10th
2009, the rapid decline in discharge (i.e., interflow) stops,
and the slope of the receding limb becomes much less steep
Luis A. Caballero, Zachary M. Easton, Brian K. Richards, Tammo S. Steenhuis
16
(i.e., baseflow). The Nash-Sutcliffe model efficiency is 0.85,
which is quite good for daily discharge predictions (Table 3).
The R2
was 0.89 and the slope close to 1 (Table 3, Fig. 3a)).
The model predicted that an average of 1.4 mm d-1
of rainfall
exited the watershed as subsurface flow, which was nearly
equal to the 1.6 mm d-1
obtained from baseflow separation
technique (Caballero et al., 2012).
a)
b)
c)
d)
Fig. 3. Comparison of observed and predicted daily total stream-
flow discharges for the four watersheds for various sets of input
parameters listed Table 2 and 3. a) Watershed WS1, b) Watershed
WS2; c) Watershed WS3 and d) Watershed WS4. The dashed lines
are the linear regression lines and have the same color as the sym-
bols. For explanation of both the legend and the value of the linear
regression coefficients see Table 3. (Colour version of the figure
can be found in the web version of this article.)
Calibration for WS2, WS3 and WS4
For the three smaller watersheds, which had little or no
cloud forest cover, we initially transferred the calibrated pa-
rameter set for WS1 (Table 2) but the fit was poor with Nash
Sutcliffe values that were either close to zero or negative (Table
3; redline in Fig. 2b, c and d) and we tried to fit the hydro-
graphs of each watershed by changing one parameter at a time
until a good fit was obtained. For every trial, we used the coef-
ficient of determination (R2
) and a slope close to 1 as a measure
of good fit. The final model performance was also evaluated
using the Nash Sutcliffe efficiency (E*) and the root mean
square error (RMSE) (Table 3).
Model calibration was performance as follows: We first en-
sured that the water balances (observed and modeled) in each of
the watersheds were as close as possible, by adjusting contrib-
uting areas of the hillslopes that provided water at the gage as
runoff on the day of the rainfall, and sometime later for inter-
flow and baseflow (Table 2). The water balance closed when
the hillslope areas were fixed at 80% of the total area for WS2,
70% for WS4 and 30% for WS3 (Table 2). The remaining
rainfall that not evaporated becomes interflow or baseflow
down from the gage. The fit between daily observed and pre-
dicted values was still poor and required adjusting the other
model parameters (i.e., maximum depth of ground water reser-
voir and Smax). This was done first for WS2. Since the water-
sheds did not differ greatly except for the cloud forest cover, we
kept the total of ground water and root zone storage for the
hillslope area constant at approximately 220 mm (Table 2). In
order to obtain a better fit we increased the maximum available
rootzone water content, Smax, to 200 mm and reduced the max-
imum ground water storage to 15 mm, (Table 2) yielding a total
storage of 215 mm for WS2 compared with 220 mm for SW1.
Finally, to obtain good fits for the recession curves we adjusted
decay constant for subsurface flows. Our experience in other
monsoonal climates (Collick et al., 2009; Steenhuis et al., 2009)
Evaluating the bio-hydrological impact of a cloud forest in central America using a semi-distributed water balance model
17
have been that the smaller the watershed, the faster the ground
water outflow and this appeared to be true in this case as well.
For the three small watersheds we used a half life of 5 days for
the linear reservoir and 3 days for the zero reservoir to drain
completely after a storm (Table 2), which were significantly
less than the calibrated parameters for WS1 with a half life of
70 days for the baseflow reservoir and 25 days for the interflow
reservoir to drain. The observed (black line) and the predicted
curve) are depicted in with the blue line (Fig. 2b)) and blue
circles (Fig. 3c)). The Nash Sutcliffe efficiency for daily values
was 0.76 and R2
= 0.90 (Table 3).
Using the same parameter set for rootzone storages and the
subsurface flow parameters as for WS2 with the adjusted con-
tributing areas determent before (Table 2), the hydrographs for
WS3 and WS4 were predicted. By comparing the observed and
predicted outflow in blue lines Figs 2c) and 2d), and blue cir-
cles in Figs 3c) and 3d), it is obvious that a relatively good fit
was obtained with Nash Sutcliffe efficiencies of 0.78 for WS3
and 0.90 for WS4 for daily values and R2
values near 0.80
(Table 3). The two overland flow peaks predicted in streamflow
at the end August and at the end of September in Fig. 2c) were
predicted by the model but not observed. The small dam at the
intake structure above the weir would have stored this small
overland flow volume. This structure was not observed until the
weir had been built and measuring the water intake was not
possible due to funding limitations. In watershed WS4 a good
fit was obtained when we assumed that 70% of hillslope area
was contributing to streamflow (Fig. 2d)), resulting in an effi-
ciency of 0.90 (Table 3).
Sensitivity analysis
In all four watersheds, the precipitation was assumed to be
evenly distributed across the watershed and that the imbalance
in the water balance was caused by deeper regional flows that
bypassed the weirs. However, there is a possibility that the
differences in the water balances are caused by the differences
in rainfall. Therefore we repeated the calibrations by assuming
the whole watershed is contributing flow (both runoff and
baseflow) to the weir and varied the amount of rainfall by mul-
tiplying the average rainfall by a constant. We kept all other
parameters the same as shown in Table 2. The best fit in Table
3 and Fig. 2 (purple line) and Fig. 3 (purple diamonds) was
obtained by taking 85% of the average rainfall for WS2 and
WS4 and 60% of the rainfall for WS3 (Table 3, third column)
Overall the measures of fit in are similar for the rainfall and
contributing area adjustments (Table 3).
DISCUSSION
The four neighboring headwater catchments (WS1, WS2,
WS3, and WS4, Fig. 1) together comprise an area of 880 ha and
are very similar geologically. All four watersheds are in a pro-
tected area and have never used for agriculture except for a
small section of WS4. Despite that the runoff response varied
greatly between WS1 and the three other smaller watersheds.
The main difference in the watersheds was that WS1 has a large
percentage of cloud forests and greater watershed area (635 ha),
while the other watersheds located at a lower elevation had
little cloud forest cover and were less than 100 ha each (Table
1). In addition, there was a rainfall gradient with approximately
17% less rainfall at the outlet of the watershed at 1350 m eleva-
tion than upper gage located at 1850 m or half way to the top of
the watershed (2270 m).
Rainfall and contributing area
While the water balance closed for the larger (635 ha) WS1
watershed it could not be closed for the other three smaller
watersheds. From other studies in cloud forest areas of Costa
Rica and the island of Guadalupe, it is known that significant
portions of water can bypass stream gages when the watersheds
are small and located in regions with volcanic soils (Schelle-
kens, 2006; Charlier, et al., 2008). In our study, there are two
possible causes for the failure to close the water balance. First,
and similar to the studies above, there is the possibility that not
all the watershed area is contributing to the gage (Table 3) and
second precipitation amounts used in the model are not repre-
sentative for the areas, as there was an increase in precipitation
with elevation. Note this gradient was not incorporated into the
model, as we did not have sufficient rain gages.
Assuming the average measured rainfall was representative
for the whole watershed, the water balance closed when in the
three smallest watersheds without cloud cover (WS2, WS3 and
WS4) only precipitation that fell on a fraction of the area was
contributing water to the stream gage (Table 2). For instance
for WS2, the contributing area for overland flow was 4% and
on 80% of the area the precipitation that was not lost as evapo-
ration became either interflow or baseflow. According to the
model, the remaining 16% of the WS2 watershed area contrib-
uted to deep percolation and did not flow through the gage
(Table 2). In WS3 and WS4 the contributing area for surface
runoff was 4%. In WS3 30% contributed to subsurface flow at
the gage and 66% became deep percolation. On 26% of the area
in watershed WS4, the rainfall was lost as evaporation and deep
percolation and did no flow through the gage. These fractions
of unaccounted water (i.e., deep percolation) fall in the same
range of the other cloud forest on volcanic soils in Costa Rica
and on Guadalupe (Schellekens, 2006; Charlier, et al., 2008).
Assuming that the whole watershed is contributing but the
rainfall varies we found that we needed to multiply the precipi-
tation by 0.85 for watersheds WS2 and WS4 and 0.60 for WS3
(Table 3). In contrast, for watershed WS1 we could not get a
better fit by reducing the rainfall amount. Thus, while keeping
the contributing area constant we could obtain the same fit for
WS2 and WS4 by decreasing the rainfall by realistic amounts
of approximately 15% for those watersheds that had significant
forest coverage at lower elevations (Table 3). WS3 had the
water supply system intercepting water before the weir so the
reduction factor of 0.60 appears to be realistic as well.
In the foregoing analysis we assumed that the precipitation
was equally distributed over the watershed (by averaging the
rainfall of the gage at 1350 m and the one at 1800 m), mainly
because measuring correctly precipitation in a cloud forest is
extremely difficult (Frumau et al., 2011). In reality rainfall
varies within a watershed and we need to examine what the
rainfall pattern is and what the effect is on the discharge.
Bruijnzeel et al. (2011) and Schellekens (2006) found both that
the windward facing slopes and higher elevation have increased
precipitation. In addition, Stadtmüller and Agudelo (1990)
reported for three plots with cloud forest in the Cerro Uyuca
Biological Reserve, CUBR 30 km south east of La Tigra Na-
tional Park that the annual precipitation from June 1987 to May
1988 was 2629 mm at the ridge and 1372 and 1892 mm at
lower elevations. In addition they found that in the rainy phase
of the monsoon from June to September only the precipitation
in July and August increased with elevation. In the dry time of
the year, the cloud forest intercepted more clouds from Novem-
ber to March and resulted in a doubling of the amount of mois-
ture input compared to non-cloud forest areas.
Luis A. Caballero, Zachary M. Easton, Brian K. Richards, Tammo S. Steenhuis
18
The La Tigra National Park showed a similar trend as in the
Cerro Uyuca Biological Reserve. Particularly in the periods
from August through October 2008 (Fig. S5 in the Supplemen-
tary material) and from May 2009 to January 2010 (Fig. S6) the
RG1 rain gage located at 1350 m received approximately 15%
less rainfall than at RG3 at 1800 m (locations of the rain gages
are on Fig. 1). In 2008 the rain storm on September 3 was the
last event in which the 1800 m gage received much more rain
than the lower gage (Fig. S5). In 2009, starting around July 1
the 1800 m gage received more rain up until the beginning of
September (Fig. S6). Then starting in the middle of October in
2009, the 1800 m rain gage received again more rain than the
lower gage. Finally, we had also a short period in which the
rainfall was measures at RG4 at the east side of the watershed
at 1830 m. Comparison with RG3 on the Westside at approxi-
mately the same elevation did not show any significant trend
(Fig. S7).
In order to examine what the effect of the spatial variable
rainfall was on the simulated discharge, we reran the model for
the WS1 watershed with cloud forest. First we replaced the
average rainfall with the rainfall at 1800 m and simulated the
discharge (Fig. S8). To obtain a good fit, the contributing area
was reduced to 0.83 with similar fit Nash Sutcliffe values of
0.86. Changing any of other parameter values did not improve
the Nash Sutcliffe values. Finally, we took the rainfall distribu-
tion from the Cerro Uyuca Biological Reserve and increased
the average rainfall by a factor of two for July and August and
by 250% for the dry month from November to March. This
resulted in a worse fit for the predicted and observed discharge
(Fig. S9 in the auxiliary material with a Nash Sutcliffe value of
0.14). Changing the input parameters was not effective in ob-
taining a reasonable fit.
Because we only have the integrated output signal from each
of the watershed, it is not possible to determine from the model
directly what caused the difference in amount of flow account-
ed at the stream gage. Therefore, we need to consider the fac-
tors individually that affects discharge. According to Goodrich,
(1992) and Mamillapalli et al. (1996), channel network, drain-
age network density, topography, soils and climatic inputs all
affect discharge. Based on the analysis in the paragraphs above,
it is unlikely that precipitation pattern with elevation can be
responsible for all the observed differences. IN addition, alt-
hough the biological induced differences by the cloud forest in
root zone (that are discussed in the next section) have an effect,
it cannot be the only cause since root zone characteristics influ-
ence mostly the shape of the hydrograph in the short time and
the water balance involves the long term behavior. Thus it must
the geological watershed characteristics (i.e., network density
and topography) are affecting the long term water balance. By
studying the topographic map in Fig. S1, it can be noted that
WS1 has well developed stream network that drains the con-
cave upper parts. In the middle part of WS1 the contour lines
are mostly parallel to the stream. As a consequence many
springs can be found in the center of the concave hillsides. In
the other three watersheds and especially WS3, contour lines
were in the upper part almost perpendicular to the stream and
hardly concave and relatively fewer springs could be found
indicating the observed differences in the hydrology of the four
watersheds can be partly explained by the drainage network and
topography.
Soil bio-hydrologic parameters
The differences in soil bio-hydrologic parameters between
primarily-cloud forest WS1 and the other three watersheds were
surprisingly far apart since all four watersheds are located in
close proximity to each other. The difference in maximum soil
storage of the root zone between the cloud forest watershed
(WS1) and the other three watersheds was unexpected. To
ensure that we did not have false model optima, we used the
same rootzone storages for WS1 as for the other three water-
sheds (WS2, WS3 and WS4) by changing all input parameters
including evaporation and precipitation. The only other good fit
was when we decreased the potential evaporation to 60% of the
observed value (Table 3) and increased the root zone storage,
Smax to 40 mm (Fig. 2a) yellow line). No other combination of
parameter adjustments resulted in a reasonable model fit. This
indicates that the maximum rootzone available water, Smax, for
the cloud forest and the forest at lower elevations are distinctly
different.
These results are in accordance with findings in the páramo
by Buytaert et al. (2004, 2006) who measured decreased wilting
points in the agricultural catchment after two year of cultivation
compared to the could forest in a paired watershed study in the
Ecuadorian Highlands. Decreases in wilting point translate in a
greater amount of plant-available water, and Buytaert, et al.
(2005) observed even greater amount of plant-available water
in laboratory measurements after the system was disturbed. In
our case, as stated earlier, the Smax value is the maximum
amount of water that can be extracted by plants in the root
zone. By lowering the wilting point, more water could become
available to the plant and hence provide a greater Smax value.
Buytaert et al. (2004, 2005) found that the retention time for
base and interflow decreased by an order of magnitude when
the páramo was disturbed and subjected to drying; the wilting
point also decreased significantly for the disturbed, agricultural
páramo. Thus biological effects on the hydrology for the cloud
forest are remarkable the same as for the páramo. Both are
permanently wet which might explain why they behave differ-
ently than other systems that dry out at some time during the
year.
CONCLUSIONS
The aim of the study was to compare the bio-hydrology of a
cloud forest with forests at lower elevations using a simple
water balance model suitable for these environments. Overall
this relatively simple model fitted the observed outflow hydro-
graphs well with relatively high Nash Sutcliffe values for daily
predicted values. Despite the similar climatic and geologic
characteristics of the study catchments, the model parameters,
varied greatly between the cloud forest watershed and the other
three watersheds in close proximity, demonstrating that biology
cannot be ignored in hydrology.
The cloud forest watershed had a distinctly smaller amount
of plant-available water and greater groundwater storage, re-
sulting in watershed discharges that were four times greater
than those of the other watersheds, despite only relatively minor
differences in annual rainfall amount. These differences were
cuase by both the geology (as it affected topography and stream
network) and biological effect of the cloud forest on the water
storage in the root zone. Despite limited data available to date,
this modeling approach is a step forward in predicting water
balances in cloud forests and forested areas in Central America,
thus aiding in managing the ever growing water demand and
scarce water supply resources which are threatened by both the
loss of forest and pollution.
Acknowledgements. Financial support was provided by assis-
tantships of the Departments of Biological and Environmental
Evaluating the bio-hydrological impact of a cloud forest in central America using a semi-distributed water balance model
19
Engineering and Crops and Soil Sciences at Cornell University
and The Association of American States (OAS). Research
funding was made available by the Canon National Parks Sci-
ence Scholars Program and Academic and Professional Pro-
grams for the Americas LASPAU.
REFERENCES
Agudelo, N., 2010. Temperature gradients in the Uyuca Moun-
tain, Francisco Morazán, Honduras. (Unpublished data.)
Araujo, M., Costa, M.F., Aureliano, J.T., Silva, M.A., 2008.
Mathematical modeling of hydrodynamics and water quality
in a tropical reservoir, Northeast Brazil. Braz. J. Aquat Sci
Technol., 12, 19–30.
Arnold, J.G., Srinivasan, R., Muttiah, R.S., Williams, J.R.,
1998. Large area hydrologic modeling and assessment. Part
I: Model Development. Journal of the American Water Re-
sources Association (JAWRA), 34, 1, 73–89.
Barlow, M., Clarke, T., 2002. Blue Gold: The fight to stop the
corporate theft of the world’s fresh water. New York, The
New Press, ISBN: 1-5684-816-6.
Bayabil, H.K., Tilahun, S.A., Collick, A.S., Yitaferu, B., Steen-
huis, T.S., 2010. Are runoff processes ecologically or topo-
graphically driven in the (sub) humid Ethiopian highlands?
The case of Maybar Watershed. Ecohydrology, 3, 457–466,
2010.
Bonell, M., Bruijnzeel, L.A., 2004. Forest, water and people in
the humid tropics: past, present and future hydrological re-
search for integrated land and water management. Cam-
bridge University Press.
Bruijnzeel, L.A., 2004. Hydrological functions of tropical for-
ests. Not seeing the soil for the trees? Agriculture, Ecosys-
tems and Environment, 104, 185–228.
Bruijnzeel, L.A., 2006. Hydrological impacts of converting
tropical montane cloud forest to pasture, with initial refer-
ence to northern Costa Rica. DFID Project Report.
Bruijnzeel, L.A., Scatena, F.N., 2011. Preface. Hydrometeorol-
ogy of tropical montane cloud forests. Hydrol. Process., 25,
319–326.
Bruijnzeel, L.A., Mulligan, M., Scatena, F.N., 2011. Hydrome-
teorology of tropical montane cloud forests: emerging pat-
terns. Hydrol. Process., 25, 465–498.
Buytaert, W., Wyseure, G., De Bievre, B., Deckers, J., 2004.
The use of the linear reservoir concept to quantify the impact
of changes in land use on the hydrology of catchments in the
Andes. Hydrology and Earth Systems Science, 8, 108–114.
Buytaert, W., Wyseure, G., De Bievre, B., Deckers, J., 2005.
The effect of land-use changes on the hydrological behavior
of Histic Andosols in south Ecuador. Hydrological Proces-
ses, 19, 3985–3997.
Buytaert, W., Iñiguez, V., Celleri, R., De Bièvre, B., Wyseure,
G., Deckers, J., 2006. Analysis of the water balance of small
páramo catchments in south Ecuador. In: J. Krecek and M.
Haigh (Eds.): Environmental Role of Wetlands in Headwa-
ters, Springer, pp. 271–281.
Buytaert, W., Beven, K. 2011. Models as multiple working
hypotheses: hydrological simulation of tropical alpine wet-
lands. Hydrological Processes, 25, 1784–1799.
Caballero, L.A., Rimmer, A., Easton, Z.M., Steenhuis, T.S.,
2012. Rainfall runoff relationships for a cloud forest water-
shed in Central America: Implications for water resource
engineering. Journal of the American Water Resources As-
sociation, 48, 1022–1031.
Campanella, P., Dickinson, J., DuBois, R., Dulin, P., Glick, D.,
Merkel, A., Pool, D., Rios, R., Skillman, D., Talbot, J.,
1982. Honduras. Country Environmental Profile. A field
study. RB Associates Mclean VA. http://pdf.usaid.gov/
pdf_docs/PNABC410.pdf. Last accessed May 2012.
Cavelier, J., Jaramillo, M., Solis, D., DeLeon, D., 1997. Water
balance and nutrient inputs in bulk precipitation in tropical
montane cloud forest in Panama. Journal of Hydrology, 193,
83–96.
Charlier, J.B. Cattan, P., Moussa, R., Voltz, M., 2008. Hydro-
logical behavior and modeling of a volcanic tropical culti-
vated catchment. Hydrological Processes. Hydrol. Process.,
22, 4355–4370.
Collick, A.S., Easton, Z.M., Ashagrie, T., Biruk, B., Tilahun,
S., Adgo, E., Awulachew, S.B., Zeleke, G., Steenhuis, T.S.,
2009. A simple semi-distributed water balance model for the
Ethiopian highlands. Hydrological Processes, 23, 3718–
–3727.
Easton, Z.M., Fuka, D.R., White, E.D, Collick, A.S., Ashagre,
B.B, McCartney M., S.B. Awulachew, S.B., Ahmed, A.A.,
Steenhuis, T.S., 2010. A multi basin SWAT model analysis
of runoff and sedimentation in the Blue Nile, Ethiopia. Hy-
drol. Earth Syst. Sci., 14, 1827–1841.
Falkenmark, M., Chapman, T., 1993. Hidróloga comparada: Un
enfoque ecológico a los recursos hídricos y de suelo.
UNESCOCEDEX, Madrid.
Goodrich, D.C., 1992. An Overview of the USDA-ARS Cli-
mate Change and Hydrology Program and Analysis of Mod-
el Complexity as a Function of Basin Scale. In: Proceedings
of a Workshop: Effects of Global Climate Change on Hy-
drology and Water Resources at Catchment Scale, Tsukuba,
Japan, pp. 233–242.
Gonzales de Asis, M., O’Leary, D., Ljung, P., Butherworth, J.,
2007. Improving Transparency, Integrity and Accountability
in Water Supply and Sanitation. The International Bank for
Reconstruction and Development/The World Bank. Wash-
ington D.C.
Harpold, A.A., Lyon, S.W., Troch, P.A., Steenhuis, T.S., 2010.
The Hydrological effects of lateral preferential flow paths in
a glaciated watershed in the Northeastern USA. Vadose
Zone Journal, 9, 397–414.
Hastenrath, S., 2011. The intertropical convergence zone of the
eastern pacific revisited. International Journal of Climatolo-
gy, 22, 347–356.
Horvat O., Hlavcova, K., Kohnova, S., Danko, M., 2009. Ap-
plication of the FRIER distributed model for estimating the
impact of land use changes on the water balance in selected
basins in Slovakia. J. Hydrol. Hydromech., 57, 4, 213–225.
IGN (Instituto Geográfico Nacional), 1956. Geología de Hon-
duras 1 : 50,000 San Juan de Flores Quad.
International Organization of Standards (ISO), 1980. Water
flow measurement in open channels using weirs and venturi
flumes – Part 1: Thin plate weirs. 1438/1-1980(E). Available
from Global Engineering Documents at
http://global.ihs.com.
Jenícek, M., 2009. Runoff changes in areas differing in land-
use in the Blanice river basin – application of the determinis-
tic model J. Hydrol. Hydromech., 57, 154–161.
Kovacs, G., 1984. Proposal to construct a coordinating matrix
for comparative hydrology. Hydrological Sciences Journal-
Journal des Sciences Hydrologiques, 29, 435–443.
Lavaire, T, Fiallos, E., 2010. Potencial de captura de agua de
los suelos de la microcuenca El Carrizal, Parque Nacional
La Tigra, Francisco Morazán, Honduras. Proyecto de espe-
cial de graduación, Escuela Agrícola Panamericana, Hondu-
ras.
Luis A. Caballero, Zachary M. Easton, Brian K. Richards, Tammo S. Steenhuis
20
Lyon, S.W., McHale, M.R., Walter, M.T., Steenhuis, T.S.,
2006. The Impact of Runoff Generation Mechanisms on the
Location of Critical Source Areas. Journal of the American
Water Resources Association (JAWRA), 42, 793–804.
Mamillapalli, S., Srinivasan, R., Arnold, J.G., Engel, B.A.,
1996. Effect of spatial variability on basin scale modeling.
In: Proceedings of the Third International Confer-
ence/Workshop on Integrating GIS and Environmental
Modeling. National Center for Geographic Information and
Analysis, Santa Barbara, California. Available at:
http://www.ncgia.ucsb.edu/conf/SANTA_FE_CD-ROM/
program.html.
Martinez, M.C., 2008. Potencial de captura de agua de los
suelos de Capiro y Zapotillo, Guinope, El Paraíso, Hondu-
ras. Proyecto de especial de graduación, Escuela Agrícola
Panamericana, Honduras.
Mulligan, M., Burke S.M., 2010. Global cloud forests and
environmental change in a hydrological context. Final report
of DFID FRP project ZF0216.
Musiake, K., 2003: Hydrology and water resources in monsoon
Asia. A consideration of the necessity of establishing a
standing research community of hydrology and water re-
sources in the Asia Pacific region. Hydrological Processes,
17, 2701–2709.
Nash, J.E., Sutcliffe, J., 1970. River flow forecasting through
conceptual models, Part I. A discussion of principles. Jour-
nal of Hydrology, 10, 282–290.
Pavelkova H., Dohnal, M., Vogel, T., 2012. Hillslope runoff
generation – comparing different modeling approaches. J.
Hydrol. Hydromech., 60, 73–86.
Peranginangin, N. Sakthivadivel, R., Scott, N.R., Kendy, E.,
Steenhuis, T.S., 2004. Water accounting for conjunctive
groundwater/surface water management: Case of the Sing-
karak-Ombilin River basin, Indonesia Journal of Hydrology,
292, 1–22.
PHO (Pan-American Health Organization and World Health
Organization). 2000. Evaluación de los Servicios de Agua
Potable y Saneamiento 2000 en las Américas. http://
www.bvsde.paho.org/eswww/eva2000/honduras/informe/inf
-00.htm. Last accessed May 2012.
Peel, M.C., McMahon, T.A., Finlayson B.L., 2004. Continental
differences in the variability of annual runoff-update and re-
assessment. Journal of Hydrology, 295, 185–197.
San Martin, O. 2001. Water Resources in Latin America and
the Caribbean: Issues and Options. Inter-American Devel-
opment Bank, Environment Division. http://
www.pnuma.org/aguamiaac/SUBREGIONAL%20MESO/M
ATERIAL%20ADICIONAL/BIBLIOGRAFIA-
WEBGRAFIA/Modulo%201%20MIAAC%20en%20el%20
contex-
to%20de%20gestion%20para%20DS/Estado%20del%20Rec
%20Hidrico/Doc%204.%20Water%20resources.pdf. Last
accesses May 2012.
Šanda, M., Císlerová, M., 2009. Transforming hydrographs in
the hillslope subsurface. J. Hydrol. Hydromech., 57, 264–
–275.
Sivapalan, M., 2003. Process complexity at hillslope scale,
process simplicity at the watershed scale: Is there a connec-
tion? Hydrological Processes, 17, 1037–1041.
Schellekens, J., 2006. CQ-FLOW: A distributed hydrological
model for the prediction of land-cover change, with special
reference to the Rio Chiquito catchment, Northwest Costa
Rica. The Fiesta Project, Vrije Universiteit, Amsterdam,
2006. http://www.falw.vu/~fiesta/reports/R7991_FTR_An-
nex3_CQflow-manual-results.pdf. Last accessed May 2012.
Shumova, N., 2009. Crop water supply and its relation to yield
of spring wheat in the south of Russian plain. J. Hydrol. Hy-
dromech., 57, 2009, 1, 26–39.
Stadtmüller, T., 1987. Cloud Forests in the Humid Tropics: A
Bibliographic Review. United Nations University (UNU):
http://archive.unu.edu/unupress/unupbooks/80670e/
80670E00.htm80670e/80670E00.htm. Last accessed May
2012.
Stadtmüller, Agudelo, N., 1990. Amount and variability of
cloud moisture input in a tropical cloud forest. International
Association of Hydrological Sciences Publication, 193, 25–
–32.
Steenhuis, T.S., van der Molen, W.H., 1986. The Thornthwaite-
Mather procedure as a simple engineering method to predict
recharge. Journal of Hydrology, 84, 221–229.
Steenhuis, T.S., Collick A.S., Easton Z.M., Leggesse, E.S.,
Bayabil, H.K., White, E.D., Awulachew, S.B., Adgo, E.,
Ahmed, A.A., 2009. Predicting discharge and erosion for the
Abay (Blue Nile) with a simple model. Hydrological Pro-
cesses, 23, 3728–3737.
Tesemma, Z.K., Mohamed, Y.A., Steenhuis, T.S., 2010. Trends
in rainfall and runoff in the Blue Nile Basin: 1964–2003.
Hydrological Processes, 25, 3747–3758.
Thornthwaite, C.W., 1948. An approach toward a rational clas-
sification of climate. Geogr. Rev., 38, 55–94.
Thornthwaite, C.W., Mather, J.R. 1955. The water balance,
Publ. Climatol. Lab. Climatol. Dresel Inst. Technol., 8, 1–
–104.
UNDP: Adaptation Fund Board Secretariat., 2010. Addressing
Climate Change Risks on Water Resources in Honduras: In-
creased Systemic Resilience and Reduced Vulnerability of
the Urban Poor. UNDP PIMS 4399; Atlas IDs-Proposal
00060323, Project 00075904, HND10).
Walter, M.T., Steenhuis, T.S., Mehta, V.K., Thongs, D., Zion,
M., Schneiderman, E., 2002. Refined conceptualization of
TOPMODEL for shallow subsurface flows. Hydrological
Processes, 16, 2041–2046.
Received 30 September 2012
Accepted 11 December 2012
Note: Supplementary Figures (S1–S9), as well as colour version of Figures 1–3 can be found in the web version of this article.
Evaluating the bio-hydrological impact of a cloud forest in central America using a semi-distributed water balance model
SUPPLEMENTARY MATERIAL
Fig. S1. Monthly precipitation at experimental site compared to
long-term average Zamorano weather station and La Tigra SA-
NAA. Source: Zamorano University (1942–2009) and SANAA
(1963–2008).
Fig. S2a. The weirs in the watershed.
Fig. S2b. Location of instrumentation in the watershed.
Fig. S3. Daily average precipitation (P) and potential evaporation
(PE) used in SWB model for the La Tigra National Park.
Fig. S4. Saturated area in the La Tigra National park. Spring house
in the back collects the spring water.
Fig. S5. Comparison of the rainfall of the rain gages RG1 at 1350
m and RG3 at 1800 m elevation for the period starting at August 25
through October 16, 2008 in the La Tigra National Park in Hondu-
ras.
Luis A. Caballero, Zachary M. Easton, Brian K. Richards, Tammo S. Steenhuis
Fig. S6. Comparison of the rainfall of the rain gages RG1 at 1350
m and RG3 at 1800 m elevation for the period starting at May 18,
2009 through January 10, 2010 in the La Tigra National Park
in Honduras.
Fig. S7. Comparison of the rainfall of the rain gages RG3 at 1800
m at the east site and RG4 at the west site at 1830 m elevation for
the period starting at September 5, 2009 through October 4, 2009
in the La Tigra National Park in Honduras.


Fig. S8. Comparison of observed and predicted daily total stream
discharges for the watershed WS1 and the average rainfall and
parameters listed in Table 2 and the with rainfall at gage RG3 at
1800 m and parameters listed in Table 2 with the exception of the
contributing hillslope area that was reduced to 0.83.


Fig. S9. Comparison of observed and predicted daily total stream
discharges for the watershed WS1 and the average rainfall and
parameters listed in Table 2 and with rainfall that had the same
characteristics at the rainfall for the watersheds that were listed in
Table 2 with the exception of the contributing hillslope area that
was reduced to 0.83 and the rainfall for the rain.

2013_61_1_Caballero_9

  • 1.
    J. Hydrol. Hydromech.,61, 2013, 1, 9–20 DOI: 10.2478/jhh-2013-0003 9 Evaluating the bio-hydrological impact of a cloud forest in Central America using a semi-distributed water balance model Luis A. Caballero 1, 2 , Zachary M. Easton 3 , Brian K. Richards 1 , Tammo S. Steenhuis 1 * 1 Department of Biological and Environmental Engineering, 206 Riley Robb Hall, Cornell University, Ithaca, NY, 14853, USA. 2 Department of Environment and Development Studies, Zamorano University, Zamorano, Honduras. 3 Department of Biological Systems Engineering, Eastern Shore Agricultural Research and Extension Center, Virginia Tech, 33446, Research Driver Painter, VA, 23420, USA. * Corresponding author. Tel.: +1 607 255 2489. E-mail: tss1@cornell.edu Abstract: Water scarcity poses a major threat to food security and human health in Central America and is increasingly recognized as a pressing regional issues caused primarily by deforestation and population pressure. Tools that can relia- bly simulate the major components of the water balance with the limited data available and needed to drive management decision and protect water supplies in this region. Four adjacent forested headwater catchments in La Tigra National Park, Honduras, ranging in size from 70 to 635 ha were instrumented and discharge measured over a one year period. A semi-distributed water balance model was developed to characterize the bio-hydrology of the four catchments, one of which is primarily cloud forest cover. The water balance model simulated daily stream discharges well, with Nash Sut- cliffe model efficiency (E) values ranging from 0.67 to 0.90. Analysis of calibrated model parameters showed that de- spite all watersheds having similar geologic substrata, the bio-hydrological response the cloud forest indicated less plant- available water in the root zone and greater groundwater recharge than the non cloud forest cover catchments. This re- sulted in watershed discharge on a per area basis four times greater from the cloud forest than the other watersheds de- spite only relatively minor differences in annual rainfall. These results highlight the importance of biological factors (cloud forests in this case) for sustained provision of clean, potable water, and the need to protect the cloud forest areas from destruction, particularly in the populated areas of Central America. Keywords: Central America; Rainfall-runoff; Thornthwaite-mather; Water balance model; Cloud forest; Monsoonal climate. INTRODUCTION Throughout the world water demand has increased in re- sponse to population growth, agricultural use, and industrial demand (PHO, 2000), while in countries with a monsoonal climate, water supplies in the dry phase are shrinking due to deforestation (San Martin, 2001; Barlow and Clarke, 2002; Bonell and Bruijnzeel, 2004; Bruijnzeel, 2004). This coupled with increasing pollution levels from inadequate waste treat- ment and increased use of agrichemicals (PHO, 2000) has led to potable water shortages. As a result, policymakers in these countries are under increasing pressure to enact natural resource management policies for preservation of water source areas to ensure clean and adequate potable water. For instance, in Hon- duras many of the water supply systems have cloud forests as the water source areas (Mulligan and Burke, 2005). Cloud forests are defined as having abundant presence of epiphytes and are characterized by persistent, frequent or seasonal cloud cover at the vegetation level (Hamilton et al., (1993). Although new laws are being implemented it is widely recognized that the lack of quantitative science-based knowledge may hinder effective application. Developing relevant natural resources policies to effectively manage water resources is a complex process. Models could provide insight, but unfortunately, most available hydrologic models such as the Soil and Water Assessment Tool model (Arnold et al., 1996; Easton et al. 2010), MIKE-SHE, Hydro- logic Engineering Center (HEC) model (Jenícek, 2009) and the FRIER rainfall-runoff model (Horvat et al., 2009), need de- tailed landscape and rainfall information that is not available in Latin America. Moreover, the rainfall-runoff relationships in these models are based on temperate climate for which these models were validated (Bruijnzeel, 2004; Araujo et al., 2008; Steenhuis et al., 2009) and application of these models to a monsoonal climate with a unique hydro biological characteris- tics remains problematic (Kovacs, 1984; Falkenmark and Chapman, 1993; Musiake, 2003; Peel et al., 2004 and Si- vapalan, 2003). Landscapes such as cloud forests play a key role in provid- ing water to the lower and drier portions of watersheds in Latin America (Buytaert et al., 2005). Very few studies on the bio- hydrologic impact of cloud forests have been carried out (Cavelier et al., 1997 in Panama; Bruijnzeel et al., 2006 and Schellekens, 2006 in Costa Rica). Buytaert et al., (2006) com- pared the water balances of two small catchments in the páramo of Ecuador, one similar to cloud forests and one a disturbed agricultural system. and found that the natural vegetation max- imized water retention in the soil by minimizing the plant- available water for evaporation. This made more water avail- able for base and interflow in the cloud forest than in the dis- turbed system. One model that has been specifically developed for cloud forests is the CQflow model (Schellekens, 2006). The CQflow model is fully distributed and simulates (among other factors) fog interception. Recently, Topmodel has been successfully applied in the páramo in the Ecuadorian Andes (Buytaert and Beven, 2011) and the Jizera Mountains in Czech Republic (Pavelkova et al., 2012). Another potential model that has been used in a wide variety of physiographic locations is the Thornthwaite Mather procedure (Thornthwaite, 1948; Thornthwaite and Mather, 1955; Steenhuis and van der Molen, 1986) and has been recently adapted for monsoon climates by separating the watershed into infiltration/recharge zones and runoff zones via saturation excess mechanisms. (Peranginangin
  • 2.
    Luis A. Caballero,Zachary M. Easton, Brian K. Richards, Tammo S. Steenhuis 10 et al., 2004; Steenhuis et al., 2009; Bayabil et al., 2010; Tesemma et al., 2010). The model is similar to the method developed at the same time by Budagovskiy (1964; cited by Shumova, 2009) in the Soviet Union. Our general objective is to increase knowledge on the inter- action of hydrology and biological factors in cloud forests in Latin America by presenting a comprehensive analysis of phys- ically based watershed model parameters using data from a recent study that measured rainfall and discharge from a cloud forest and three surrounding forested watersheds in the La Tigra National Park in Honduras (Caballero et al., 2012). Dif- ferences in model parameters between cloud forests and the other, non-cloud forest watersheds are used to infer the effect of cloud forests on bio-hydrological factors. MATERIALS AND METHODS Site description La Tigra Experimental Catchment is located (87º 5’ W lati- tude and 14º 10’ N longitude) within La Tigra National Park, 25 km north east of Tegucigalpa, central Honduras in the headwaters of the Choluteca River Basin, which drains into the Pacific Ocean (Fig. 1). La Tigra Park supplies 30% and 50% of drinking water for Tegucigalpa (Campanella et al., 1982). Dur- ing the dry months (March, April and May) other sources of drinking water (the Guacerique and Concepcion reservoirs) decrease greatly due to lack of baseflow and La Tigra National Park becomes the main supply for Tegucigalpa (Stadtmüller, 1987). Fig. 1. Study site, La Tigra Experimental Catchment, Honduras.
  • 3.
    Evaluating the bio-hydrologicalimpact of a cloud forest in central America using a semi-distributed water balance model 11 The experimental site is composed of four neighboring headwater catchments (WS1, WS2, WS3 and WS4, Fig. 1) together comprising an area of 880 ha. The research area is characterized by steep slopes ranging from 20 to 30%. The mean slopes of the stream channels for the catchments range from 14 to 21%. The general characteristics of each watershed are summarized in Table 1. Watersheds WS3 has withdrawals that serve as the water supply for the municipality of Valle de Angeles. The study area has been protected since the 1940’s, first as forest reserve, and more recently as national park. Land cover is predominantly evergreen Pinus oocarpa at lower elevations up to 1500 m. Above 1800 m a mixture of Pinus maximinow and various broadleaf plants (mainly Quercus species) are found. Between 1500 and 1800 there is a transition zone between the two vegetation covers. Cloud forest land cover was 58% for WS1, 0% for WS2, less than 4% for WS3 and 0% for WS4 (Table 1). A 2010 land use survey indicates that forest cover is predominant in all sites, except in WS4 where 16% is under agricultural cultivation (Table 1). The cloud forest is exposed to fog and lower temperatures, approximately 5–10º C (Bruijnzeel et al., 2006). Unpublished data from the Uyuca Mountains 14 km southeast indicate that temperatures drop approximately 6ºC per 1000 m of elevation gain (Agudelo, 2010: personal communication). The climate is characteristic of monsoonal regions with very distinct dry and wet phases. The wet phase begins at the end of May or early June when the Intertropical Convergence Zone (ITCZ) becomes active, bringing warm moist clouds from the eastern Pacific to Central America and the Caribbean (Hastenrath, 2002). The slopes of the watershed face predomi- nantly southeast (Fig. 1). Since the trade winds are from the northwest, the watershed lies in the rain shadow. Annual pre- cipitation averaged over the watershed is 1150 mm, with 90% of the rainfall falling from the end of May through October (Fig. S1 Supplementary material). These amounts are approxi- mately half of that recorded in 1987 by Stadtmüller and Agude- lo (1990) at the ridge of the mountain around 1850 m in the Cerro Uyuca Biological Reserve 30 km to the south east of the La Tigra watershed. Table 1. Characteristics of the four study catchments and their rivers in La Tigra National Park, Honduras, Central America. CATCHMENT WS1 WS2 WS3 WS4 Catchment area (ha) Cloud forest area % Other forested % Deforested % 635 58 41 1 93 0 100 0 82 4 96 0 70 0 84 16 Weir elevation at outlet (m) 1505 1374 1431 1486 Elevation range (m) 1505–2270 1374–1850 1431–2000 1486–1960 Mean elevation (m) 1905 1625 1730 1715 Mean slope (%) 22 20 27 30 Main stream channel length (m) 6600 1508 1105 994 Main stream channel slope (%) 18 14 18 21 Drainage density (km/km2 ) 1.00 1.62 1.35 1.42 Mean annual temperature (ºC) 16–20 16–20 16–20 16–20 Mean annual precipitation (mm) 1085 1085 1085 1085 Mean annual discharge (mm) 520 – – – Geology (bedrock formation) Volcanic Volcanic Volcanic Volcanic Period of measurements Type of stream Apr. 2008– Dec. 2009 Perennial Apr. 2009– Dec. 2009 Perennial Wet season 2009 Intermittent Wet season 2009 Intermittent Soils of the research catchments are Andisols of volcanic origin. A detailed soil map is not available for the study catch- ments, but based on geologic mapping, soils are underlain by silicate strata of medium coarse fragments of igneous, volcanic and calcareous rocks (IGN, 1956). The lower part of the La Tigra watershed has soils depths ranging from 0.3 to 0.9 me- ters, organic matter contents from 5 to 15 % (Lavaire and Fial- los, 2010). Soils have abundant large pores, roots, and rock fragments which contribute to high permeabilities. Saturated hydraulic conductivities on disturbed soil samples ranged from 1.6 to 7 cm hr-1 (Lavaire and Fiallos, 2010). A soil survey in a similar cloud forest ecosystem in the Capiro-Zapotillo micro- catchments reported mean organic matter contents in excess of 7%, with values reaching 14% in the uppermost cloud forest areas. Bulk densities ranged from 0.4 to 1.0 gr cm-3 (Martinez, 2008). Martinez (2008) found soil depths ranging from 0.6 to 1.2 m and sometimes even greater in the upper part of the catchments. Hydrologic data sets Stream discharge was measured at each catchment outlet through a weir (Fig. S2 Supplementary material). Water height were recorded on 10-minute intervals, and converted to volume using standardized rating curves (ISO, 1980; Caballero et al., 2012). Precipitation was measured by a network of five digital rain gages located along the elevation gradient (1350–1850 m) to have a representative measurement of the average precipitation over the research sites. The potential evaporation was obtained from a nearby (20 km) digital weather station located on the grounds of the Pan-American School of Agriculture (Zamorano University). Rainfall-runoff model We present only the conceptual Semi-Distributed Water Balance Model (SWB model), with the complete derivation
  • 4.
    Luis A. Caballero,Zachary M. Easton, Brian K. Richards, Tammo S. Steenhuis 12 from Tesemma et al. (2010) (available in preprint form at http://soilandwater.bee.cornell.edu/publications/zelalemblue- nile-2012.pdf). The model as shown by Walter et al. (2002) is mathematically similar to Topmodel with the exponential de- creasing conductivity as used by Buytaert and Beven (2011). However, in Topmodel the entire watershed is underlain by a regional groundwater table that periodically intersects the soils surface generating runoff while in the SWB model shallow perched water tables over a slowly permeable layer govern the formation of saturated runoff producing areas. In the SWB model the landscape is divided into two regions: well-drained hillslopes, and the flatter near stream areas that become saturat- ed during the wet season due to upslope flow contributions. The hillslopes are further subdivided into two groups: degraded areas that have the hardpan exposed at the soil surface, and highly permeable soils above a restrictive layer at some depth. In the degraded areas (or rock outcrops) that have restricted infiltration, only a small amount of water can be stored before saturation excess surface runoff occurs. In contrast, on the highly permeable portion of the hillslopes, most of the water is transported as rapid subsurface flow (i.e., interflow over a restrictive layer) or as base flow that percolates from the soil profile to deeper subsoil and rock layers (Šanda and Císlerová, 2009, Steenhuis et al., 2009, Bayabil et al., 2010). The flatter areas that drain the surrounding hillslopes become runoff source areas when part of the profile is at or near saturation. Three separate water balances are calculated for each region. The water balance for the each of the three areas can be written as: S s(t) = S s(t ! "t) + P ! Ea ! R ! Perc#$ %&"t, (1) where Ss(t) is volume of plant available water in the soil profile above the restrictive layer per unit area (L), at time t (T), Ss(t– Δt) is the previous time step water storage (L), P is rainfall (L T-1 ), Ea is actual evapotranspiration (L T-1 ), R is saturation excess runoff (L T-1 ), Perc is percolation to the subsoil (L T-1 ) and Δt is the time step (1 day in our case). Percolation from the infiltration zone occurs when the moisture inputs exceed field capacity. Surface runoff is produced when the soil is saturated and is equal to the amount of rainfall minus the water needed to saturate the soil profile. The actual evaporation from the soil, Ea is calculated with the Thornthwaite-Mather procedure (Thornthwaite, 1948; Thornthwaite and Mather, 1955; Steen- huis and van der Molen, 1986). The method assume that evapo- ration decreases linearly with soil moisture content between field capacity (at which point Ea equals potential evaporation) and the wilting point (at which Ea is zero). Once precipitation has infiltrated below the root zone there are two reservoirs, one for baseflow and one for interflow. The baseflow reservoir is associated with the groundwater in the near stream area and is simulated as linear reservoir with exponentially decreasing discharge. The interflow reservoir simulates water flowing down the slope over the restrictive layer and is a zero order reservoir (e.g., the discharge decreases linearly with reservoir volume). Evaluation of model performance To evaluate how well the predicted discharge matched ob- served values, we used the Nash-Sutcliffe model efficiency coefficient (E) or goodness-of-fit index (Nash-Sutcliffe, 1970), which is widely used to evaluate the predictive capacity of hydrologic models. In addition, the performance of the model during calibration was evaluated using the normalized root mean squared error (RMSE) and regression coefficient, R2 . RESULTS The hydrographs of the four watersheds in the La Tigra Na- tional Park were distinctly different (solid black lines in Fig. 2). In WS1 (cloud forest, Fig. 2a) the hydrograph is characterized by an initially steep receding limb (October–December) becom- ing more and more shallow until the next rainfall season begins, usually in late May. Although smallest WS2 has streamflow throughout the year, the discharge is less than in WS1 and thus the portion of rain converted to streamflow is smaller (Fig. 2b). In the two watersheds WS3 (Fig. 2c) and WS4 (Fig. 2d), there was only discharge in the wet, monsoon phase. In general, WS1 and WS2 have similar runoff responses during the wet season (Figs 2a and 2b). In WS3 and WS4, discharge drastically de- clines during the short rainless period between the wet seasons (Figs 2c and 2d). In the following sections, we use the SWB model parameters to investigate hydrological processes and how these parameters can explain differences in hydrological behavior among the four watersheds. The SWB model is a mathematical relation- ship between rainfall and evaporation (as input parameters) and the watershed discharge (as an output). Because the hydrograph is the output signal that integrates all processes that occur in the watershed, it is unlikely parameters resulting in a poor fit repre- sent the physical processes occurring in the watershed. This approach, however, does not give insight into selecting from among potential mechanisms whether they all fit the model with equal precision. Hence, when a good fit is obtained be- tween observed and predicted outflow, we can assume that the hydrologic processes in the underlying model structure are valid. For example if the total discharge does not vary as a function of rainfall intensity, infiltration excess is likely not occurring in the watershed. Model fitting The semi-distributed SWB model applied here used the pre- cipitation and potential evaporation as climatic input data to estimate the water balance. For precipitation (P), daily arithme- tic averages obtained from either three or four digital rain gages were used and thus daily precipitation model inputs were the same for all catchments (Fig. S3 in Supplementary material). Potential evaporation (PE) data from a nearby (20 km) weather station was used, which ranged from 1.3 to 5.6 mm d-1 , with an average of 3.6 mm d-1 over the measurement period a value quite similar to the 3.5 mm d-1 used in monsoonal climate of Ethiopia (Collick, et al., 2009) and in the Caribbean (2.1–3.7 mm d-1 , Charlier et al., 2008). Other parameters needed to simulate the discharge included soil water storage capacity for the hillslopes and runoff contributing areas. The saturated areas were designated as those areas at the foot of the hills where saturation excess runoff is generated as well as areas of exposed bedrock (see picture S4 in Supplementary material). Saturation excess runoff in these highly conductive soils does not neces- sarily mean that the water table is at the surface. Only part of the soil profile needs be saturated for interflow to occur (Lyon et al., 2006). The hillslopes act as sources of the recharge to the aquifer and contribute flow to the saturated runoff generating areas via interflow from upslope areas. We initially planned to calibrate the model for WS1 and then validated the model for the other watersheds, but once the data were analyzed it became clear that although we could close the
  • 5.
    Evaluating the bio-hydrologicalimpact of a cloud forest in central America using a semi-distributed water balance model 13 a) b)
  • 6.
    Luis A. Caballero,Zachary M. Easton, Brian K. Richards, Tammo S. Steenhuis 14 c) d) Fig. 2. Comparison of observed and predicted daily total stream discharges for the four watersheds for the input parameters listed Table 2 and 3: a) Watershed WS1, b) Watershed WS2; c) Watershed WS3 and d) Watershed WS4. The explanation of the legend is given in Table 3. (Colour version of the figure can be found in the web version of this article.)
  • 7.
    Evaluating the bio-hydrologicalimpact of a cloud forest in central America using a semi-distributed water balance model 15 water balance for WS1, this was not possible for the other watersheds. For this reason, we first fitted the observed and predicted values for WS1 and then changed the fewest number of parameters to fit the other three watersheds using a simpli- fied equifinality approach by varying those parameters within physically-justifiable ranges. We first adjusted the area that contributed runoff in order to fit the observed versus predicted values. Once we had the mass balance correctly fitted, the available water content of the soil was fitted, and subsequently a sensitivity analysis was performed in which we varied the precipitation and potential evaporation (Table 3). Table 2. Model input parameter values for surface flow, baseflow and interflow for the four catchments in the La Tigra National Park in Honduras. Parameter Watershed WS1 WS2 WS3 WS4 Overland flow area 0.04 0.04 0.04 0.04 Permeable hill slope area (fraction) 0.96 0.80 0.30 0.70 t* for interflow zero order reservoir (days) 20 3 3 3 t1/2 half-life aquifer (days) 70 2.3 2.3 2.3 Maximum depth ground water reservoir (mm) 200 15 15 15 Smax overland flow area (mm) 5 5 5 5 Smax hill slope zone (mm) 20 200 200 200 Table 3. Comparison of observed versus model predicted daily discharge for the four watershed WS1, WS2, WS3 and WS4. The Mean, Standard deviation (St Dev), root mean square error (RMSE), Nash Sutcliff Efficiency (Nash Sut) and the intercept (interc), slope and R2 of the linear regression are given for various simulations. For “Table 2 parameters” the values listed in Table 2 for the particle watershed are used. We also used the input values for Watershed WS1 for simulating the discharge of Watersheds WS2, WS3 and WS4 (WS1 parame- ters) and the WS2 parameters for simulating WS1 (WS2 parameters); Best fits were also obtained by setting the total contributing area to 1 while keeping the other model parameters in Table 2 for the particular watershed in Table 2 the same by multiplying the precipitation by a constant factor listed under “Ratio” (Precipitation adjusted) or by multiplying the potential evaporation by a constant factor (Evaporation adjusted). The value in “Ratio” was the best fit value. Water- shed Description Ratio Mean (mm/day) St dev (mm/day) RMSE (mm d-1 ) Nash Sutc Linear regression interc slope R2 WS1 Observed 1.74 1.60 Table 2 parameters 1.70 1.69 0.62 0.85 0.07 0.96 0.89 WS2 parameters 0.54 1.59 1.64 -0.05 0.15 0.97 0.89 Precipitation adjusted 0.90 1.58 1.64 0.54 0.89 0.27 0.93 0.90 Evaporation adjusted 1.30 1.57 1.57 0.51 0.90 0.20 0.97 0.90 WS2 Observed 0.47 0.80 WS1 parameters 1.88 0.96 1.48 -2.43 1.38 1.07 0.80 Table 2 parameters 0.47 0.98 0.30 0.86 -0.08 1.18 0.93 Precipitation adjusted 0.85 0.35 0.99 0.29 0.87 0.21 1.20 0.95 Evaporation adjusted 1.40 0.33 0.97 0.31 0.85 -0.22 1.18 0.94 WS3 Observed 0.31 0.70 WS1 parameters 1.44 0.72 1.45 -4.27 1.17 0.90 0.26 Table 2 parameters 0.38 0.64 0.32 0.78 0.13 0.82 0.80 Precipitation adjusted 0.60 0.31 0.70 0.21 0.91 0.07 0.78 0.94 Evaporation adjusted 2.10 0.33 0.82 0.38 0.67 0.02 1.0 0.78 WS4 Observed 0.98 1.72 WS1 parameters 2.16 1.06 1.57 0.16 1.67 0.51 0.67 Table 2 parameters 0.87 1.51 0.54 0.90 0.05 0.84 0.91 Precipitation adjusted 0.83 0.71 1.40 0.66 0.85 -0.04 0.77 0.89 Evaporation adjusted 1.30 0.81 1.64 0.65 0.85 0.05 0.88 0.86 Calibration for WS1 The predicted and observed streamflow for the WS1 water- shed (cloud forest) for the period October 2008 through Octo- ber 2009 is shown in Fig. 2a) as the red line. Average observed streamflow was 1.7 mm d-1 and model-predicted discharge was 1.6 mm d-1 (Table 3) this best fit was obtained with only 4% of the watershed area contributing surface runoff, while the re- maining 96% the watershed infiltrated precipitation and con- tributed subsurface flow (Table 2). Surface runoff was pro- duced when the rainfall exceeded the calibrated maximum available rootzone water content of 5 mm (e.g. Smax = 5 mm, Table 2) in the soil, and thus any rain with 5 mm or more pro- duced at least some runoff. The runoff areas are saturated areas caused by interflow from upslope or exposed bedrock (Harpold et al., 2010). Thus 96% of the watershed had soils with high infiltration rates in which all rainfall infiltrated. Subsurface flow consists of slow (baseflow) and fast (interflow) compo- nents. Baseflow was simulated as a linear reservoir with a half- life of 70 days. In the model, the groundwater reservoir fills first, and when the storage exceeds the equivalent of 200 mm over the whole watershed the zero order interflow reservoir fills and drains in 20 days (by calibration, Table 2). The time that interflow stops is clearly visible in Fig. 2a) where on November 10th 2009, the rapid decline in discharge (i.e., interflow) stops, and the slope of the receding limb becomes much less steep
  • 8.
    Luis A. Caballero,Zachary M. Easton, Brian K. Richards, Tammo S. Steenhuis 16 (i.e., baseflow). The Nash-Sutcliffe model efficiency is 0.85, which is quite good for daily discharge predictions (Table 3). The R2 was 0.89 and the slope close to 1 (Table 3, Fig. 3a)). The model predicted that an average of 1.4 mm d-1 of rainfall exited the watershed as subsurface flow, which was nearly equal to the 1.6 mm d-1 obtained from baseflow separation technique (Caballero et al., 2012). a) b) c) d) Fig. 3. Comparison of observed and predicted daily total stream- flow discharges for the four watersheds for various sets of input parameters listed Table 2 and 3. a) Watershed WS1, b) Watershed WS2; c) Watershed WS3 and d) Watershed WS4. The dashed lines are the linear regression lines and have the same color as the sym- bols. For explanation of both the legend and the value of the linear regression coefficients see Table 3. (Colour version of the figure can be found in the web version of this article.) Calibration for WS2, WS3 and WS4 For the three smaller watersheds, which had little or no cloud forest cover, we initially transferred the calibrated pa- rameter set for WS1 (Table 2) but the fit was poor with Nash Sutcliffe values that were either close to zero or negative (Table 3; redline in Fig. 2b, c and d) and we tried to fit the hydro- graphs of each watershed by changing one parameter at a time until a good fit was obtained. For every trial, we used the coef- ficient of determination (R2 ) and a slope close to 1 as a measure of good fit. The final model performance was also evaluated using the Nash Sutcliffe efficiency (E*) and the root mean square error (RMSE) (Table 3). Model calibration was performance as follows: We first en- sured that the water balances (observed and modeled) in each of the watersheds were as close as possible, by adjusting contrib- uting areas of the hillslopes that provided water at the gage as runoff on the day of the rainfall, and sometime later for inter- flow and baseflow (Table 2). The water balance closed when the hillslope areas were fixed at 80% of the total area for WS2, 70% for WS4 and 30% for WS3 (Table 2). The remaining rainfall that not evaporated becomes interflow or baseflow down from the gage. The fit between daily observed and pre- dicted values was still poor and required adjusting the other model parameters (i.e., maximum depth of ground water reser- voir and Smax). This was done first for WS2. Since the water- sheds did not differ greatly except for the cloud forest cover, we kept the total of ground water and root zone storage for the hillslope area constant at approximately 220 mm (Table 2). In order to obtain a better fit we increased the maximum available rootzone water content, Smax, to 200 mm and reduced the max- imum ground water storage to 15 mm, (Table 2) yielding a total storage of 215 mm for WS2 compared with 220 mm for SW1. Finally, to obtain good fits for the recession curves we adjusted decay constant for subsurface flows. Our experience in other monsoonal climates (Collick et al., 2009; Steenhuis et al., 2009)
  • 9.
    Evaluating the bio-hydrologicalimpact of a cloud forest in central America using a semi-distributed water balance model 17 have been that the smaller the watershed, the faster the ground water outflow and this appeared to be true in this case as well. For the three small watersheds we used a half life of 5 days for the linear reservoir and 3 days for the zero reservoir to drain completely after a storm (Table 2), which were significantly less than the calibrated parameters for WS1 with a half life of 70 days for the baseflow reservoir and 25 days for the interflow reservoir to drain. The observed (black line) and the predicted curve) are depicted in with the blue line (Fig. 2b)) and blue circles (Fig. 3c)). The Nash Sutcliffe efficiency for daily values was 0.76 and R2 = 0.90 (Table 3). Using the same parameter set for rootzone storages and the subsurface flow parameters as for WS2 with the adjusted con- tributing areas determent before (Table 2), the hydrographs for WS3 and WS4 were predicted. By comparing the observed and predicted outflow in blue lines Figs 2c) and 2d), and blue cir- cles in Figs 3c) and 3d), it is obvious that a relatively good fit was obtained with Nash Sutcliffe efficiencies of 0.78 for WS3 and 0.90 for WS4 for daily values and R2 values near 0.80 (Table 3). The two overland flow peaks predicted in streamflow at the end August and at the end of September in Fig. 2c) were predicted by the model but not observed. The small dam at the intake structure above the weir would have stored this small overland flow volume. This structure was not observed until the weir had been built and measuring the water intake was not possible due to funding limitations. In watershed WS4 a good fit was obtained when we assumed that 70% of hillslope area was contributing to streamflow (Fig. 2d)), resulting in an effi- ciency of 0.90 (Table 3). Sensitivity analysis In all four watersheds, the precipitation was assumed to be evenly distributed across the watershed and that the imbalance in the water balance was caused by deeper regional flows that bypassed the weirs. However, there is a possibility that the differences in the water balances are caused by the differences in rainfall. Therefore we repeated the calibrations by assuming the whole watershed is contributing flow (both runoff and baseflow) to the weir and varied the amount of rainfall by mul- tiplying the average rainfall by a constant. We kept all other parameters the same as shown in Table 2. The best fit in Table 3 and Fig. 2 (purple line) and Fig. 3 (purple diamonds) was obtained by taking 85% of the average rainfall for WS2 and WS4 and 60% of the rainfall for WS3 (Table 3, third column) Overall the measures of fit in are similar for the rainfall and contributing area adjustments (Table 3). DISCUSSION The four neighboring headwater catchments (WS1, WS2, WS3, and WS4, Fig. 1) together comprise an area of 880 ha and are very similar geologically. All four watersheds are in a pro- tected area and have never used for agriculture except for a small section of WS4. Despite that the runoff response varied greatly between WS1 and the three other smaller watersheds. The main difference in the watersheds was that WS1 has a large percentage of cloud forests and greater watershed area (635 ha), while the other watersheds located at a lower elevation had little cloud forest cover and were less than 100 ha each (Table 1). In addition, there was a rainfall gradient with approximately 17% less rainfall at the outlet of the watershed at 1350 m eleva- tion than upper gage located at 1850 m or half way to the top of the watershed (2270 m). Rainfall and contributing area While the water balance closed for the larger (635 ha) WS1 watershed it could not be closed for the other three smaller watersheds. From other studies in cloud forest areas of Costa Rica and the island of Guadalupe, it is known that significant portions of water can bypass stream gages when the watersheds are small and located in regions with volcanic soils (Schelle- kens, 2006; Charlier, et al., 2008). In our study, there are two possible causes for the failure to close the water balance. First, and similar to the studies above, there is the possibility that not all the watershed area is contributing to the gage (Table 3) and second precipitation amounts used in the model are not repre- sentative for the areas, as there was an increase in precipitation with elevation. Note this gradient was not incorporated into the model, as we did not have sufficient rain gages. Assuming the average measured rainfall was representative for the whole watershed, the water balance closed when in the three smallest watersheds without cloud cover (WS2, WS3 and WS4) only precipitation that fell on a fraction of the area was contributing water to the stream gage (Table 2). For instance for WS2, the contributing area for overland flow was 4% and on 80% of the area the precipitation that was not lost as evapo- ration became either interflow or baseflow. According to the model, the remaining 16% of the WS2 watershed area contrib- uted to deep percolation and did not flow through the gage (Table 2). In WS3 and WS4 the contributing area for surface runoff was 4%. In WS3 30% contributed to subsurface flow at the gage and 66% became deep percolation. On 26% of the area in watershed WS4, the rainfall was lost as evaporation and deep percolation and did no flow through the gage. These fractions of unaccounted water (i.e., deep percolation) fall in the same range of the other cloud forest on volcanic soils in Costa Rica and on Guadalupe (Schellekens, 2006; Charlier, et al., 2008). Assuming that the whole watershed is contributing but the rainfall varies we found that we needed to multiply the precipi- tation by 0.85 for watersheds WS2 and WS4 and 0.60 for WS3 (Table 3). In contrast, for watershed WS1 we could not get a better fit by reducing the rainfall amount. Thus, while keeping the contributing area constant we could obtain the same fit for WS2 and WS4 by decreasing the rainfall by realistic amounts of approximately 15% for those watersheds that had significant forest coverage at lower elevations (Table 3). WS3 had the water supply system intercepting water before the weir so the reduction factor of 0.60 appears to be realistic as well. In the foregoing analysis we assumed that the precipitation was equally distributed over the watershed (by averaging the rainfall of the gage at 1350 m and the one at 1800 m), mainly because measuring correctly precipitation in a cloud forest is extremely difficult (Frumau et al., 2011). In reality rainfall varies within a watershed and we need to examine what the rainfall pattern is and what the effect is on the discharge. Bruijnzeel et al. (2011) and Schellekens (2006) found both that the windward facing slopes and higher elevation have increased precipitation. In addition, Stadtmüller and Agudelo (1990) reported for three plots with cloud forest in the Cerro Uyuca Biological Reserve, CUBR 30 km south east of La Tigra Na- tional Park that the annual precipitation from June 1987 to May 1988 was 2629 mm at the ridge and 1372 and 1892 mm at lower elevations. In addition they found that in the rainy phase of the monsoon from June to September only the precipitation in July and August increased with elevation. In the dry time of the year, the cloud forest intercepted more clouds from Novem- ber to March and resulted in a doubling of the amount of mois- ture input compared to non-cloud forest areas.
  • 10.
    Luis A. Caballero,Zachary M. Easton, Brian K. Richards, Tammo S. Steenhuis 18 The La Tigra National Park showed a similar trend as in the Cerro Uyuca Biological Reserve. Particularly in the periods from August through October 2008 (Fig. S5 in the Supplemen- tary material) and from May 2009 to January 2010 (Fig. S6) the RG1 rain gage located at 1350 m received approximately 15% less rainfall than at RG3 at 1800 m (locations of the rain gages are on Fig. 1). In 2008 the rain storm on September 3 was the last event in which the 1800 m gage received much more rain than the lower gage (Fig. S5). In 2009, starting around July 1 the 1800 m gage received more rain up until the beginning of September (Fig. S6). Then starting in the middle of October in 2009, the 1800 m rain gage received again more rain than the lower gage. Finally, we had also a short period in which the rainfall was measures at RG4 at the east side of the watershed at 1830 m. Comparison with RG3 on the Westside at approxi- mately the same elevation did not show any significant trend (Fig. S7). In order to examine what the effect of the spatial variable rainfall was on the simulated discharge, we reran the model for the WS1 watershed with cloud forest. First we replaced the average rainfall with the rainfall at 1800 m and simulated the discharge (Fig. S8). To obtain a good fit, the contributing area was reduced to 0.83 with similar fit Nash Sutcliffe values of 0.86. Changing any of other parameter values did not improve the Nash Sutcliffe values. Finally, we took the rainfall distribu- tion from the Cerro Uyuca Biological Reserve and increased the average rainfall by a factor of two for July and August and by 250% for the dry month from November to March. This resulted in a worse fit for the predicted and observed discharge (Fig. S9 in the auxiliary material with a Nash Sutcliffe value of 0.14). Changing the input parameters was not effective in ob- taining a reasonable fit. Because we only have the integrated output signal from each of the watershed, it is not possible to determine from the model directly what caused the difference in amount of flow account- ed at the stream gage. Therefore, we need to consider the fac- tors individually that affects discharge. According to Goodrich, (1992) and Mamillapalli et al. (1996), channel network, drain- age network density, topography, soils and climatic inputs all affect discharge. Based on the analysis in the paragraphs above, it is unlikely that precipitation pattern with elevation can be responsible for all the observed differences. IN addition, alt- hough the biological induced differences by the cloud forest in root zone (that are discussed in the next section) have an effect, it cannot be the only cause since root zone characteristics influ- ence mostly the shape of the hydrograph in the short time and the water balance involves the long term behavior. Thus it must the geological watershed characteristics (i.e., network density and topography) are affecting the long term water balance. By studying the topographic map in Fig. S1, it can be noted that WS1 has well developed stream network that drains the con- cave upper parts. In the middle part of WS1 the contour lines are mostly parallel to the stream. As a consequence many springs can be found in the center of the concave hillsides. In the other three watersheds and especially WS3, contour lines were in the upper part almost perpendicular to the stream and hardly concave and relatively fewer springs could be found indicating the observed differences in the hydrology of the four watersheds can be partly explained by the drainage network and topography. Soil bio-hydrologic parameters The differences in soil bio-hydrologic parameters between primarily-cloud forest WS1 and the other three watersheds were surprisingly far apart since all four watersheds are located in close proximity to each other. The difference in maximum soil storage of the root zone between the cloud forest watershed (WS1) and the other three watersheds was unexpected. To ensure that we did not have false model optima, we used the same rootzone storages for WS1 as for the other three water- sheds (WS2, WS3 and WS4) by changing all input parameters including evaporation and precipitation. The only other good fit was when we decreased the potential evaporation to 60% of the observed value (Table 3) and increased the root zone storage, Smax to 40 mm (Fig. 2a) yellow line). No other combination of parameter adjustments resulted in a reasonable model fit. This indicates that the maximum rootzone available water, Smax, for the cloud forest and the forest at lower elevations are distinctly different. These results are in accordance with findings in the páramo by Buytaert et al. (2004, 2006) who measured decreased wilting points in the agricultural catchment after two year of cultivation compared to the could forest in a paired watershed study in the Ecuadorian Highlands. Decreases in wilting point translate in a greater amount of plant-available water, and Buytaert, et al. (2005) observed even greater amount of plant-available water in laboratory measurements after the system was disturbed. In our case, as stated earlier, the Smax value is the maximum amount of water that can be extracted by plants in the root zone. By lowering the wilting point, more water could become available to the plant and hence provide a greater Smax value. Buytaert et al. (2004, 2005) found that the retention time for base and interflow decreased by an order of magnitude when the páramo was disturbed and subjected to drying; the wilting point also decreased significantly for the disturbed, agricultural páramo. Thus biological effects on the hydrology for the cloud forest are remarkable the same as for the páramo. Both are permanently wet which might explain why they behave differ- ently than other systems that dry out at some time during the year. CONCLUSIONS The aim of the study was to compare the bio-hydrology of a cloud forest with forests at lower elevations using a simple water balance model suitable for these environments. Overall this relatively simple model fitted the observed outflow hydro- graphs well with relatively high Nash Sutcliffe values for daily predicted values. Despite the similar climatic and geologic characteristics of the study catchments, the model parameters, varied greatly between the cloud forest watershed and the other three watersheds in close proximity, demonstrating that biology cannot be ignored in hydrology. The cloud forest watershed had a distinctly smaller amount of plant-available water and greater groundwater storage, re- sulting in watershed discharges that were four times greater than those of the other watersheds, despite only relatively minor differences in annual rainfall amount. These differences were cuase by both the geology (as it affected topography and stream network) and biological effect of the cloud forest on the water storage in the root zone. Despite limited data available to date, this modeling approach is a step forward in predicting water balances in cloud forests and forested areas in Central America, thus aiding in managing the ever growing water demand and scarce water supply resources which are threatened by both the loss of forest and pollution. Acknowledgements. Financial support was provided by assis- tantships of the Departments of Biological and Environmental
  • 11.
    Evaluating the bio-hydrologicalimpact of a cloud forest in central America using a semi-distributed water balance model 19 Engineering and Crops and Soil Sciences at Cornell University and The Association of American States (OAS). Research funding was made available by the Canon National Parks Sci- ence Scholars Program and Academic and Professional Pro- grams for the Americas LASPAU. REFERENCES Agudelo, N., 2010. Temperature gradients in the Uyuca Moun- tain, Francisco Morazán, Honduras. (Unpublished data.) Araujo, M., Costa, M.F., Aureliano, J.T., Silva, M.A., 2008. Mathematical modeling of hydrodynamics and water quality in a tropical reservoir, Northeast Brazil. Braz. J. Aquat Sci Technol., 12, 19–30. Arnold, J.G., Srinivasan, R., Muttiah, R.S., Williams, J.R., 1998. Large area hydrologic modeling and assessment. Part I: Model Development. Journal of the American Water Re- sources Association (JAWRA), 34, 1, 73–89. Barlow, M., Clarke, T., 2002. Blue Gold: The fight to stop the corporate theft of the world’s fresh water. New York, The New Press, ISBN: 1-5684-816-6. Bayabil, H.K., Tilahun, S.A., Collick, A.S., Yitaferu, B., Steen- huis, T.S., 2010. Are runoff processes ecologically or topo- graphically driven in the (sub) humid Ethiopian highlands? The case of Maybar Watershed. Ecohydrology, 3, 457–466, 2010. Bonell, M., Bruijnzeel, L.A., 2004. Forest, water and people in the humid tropics: past, present and future hydrological re- search for integrated land and water management. Cam- bridge University Press. Bruijnzeel, L.A., 2004. Hydrological functions of tropical for- ests. Not seeing the soil for the trees? Agriculture, Ecosys- tems and Environment, 104, 185–228. Bruijnzeel, L.A., 2006. Hydrological impacts of converting tropical montane cloud forest to pasture, with initial refer- ence to northern Costa Rica. DFID Project Report. Bruijnzeel, L.A., Scatena, F.N., 2011. Preface. Hydrometeorol- ogy of tropical montane cloud forests. Hydrol. Process., 25, 319–326. Bruijnzeel, L.A., Mulligan, M., Scatena, F.N., 2011. Hydrome- teorology of tropical montane cloud forests: emerging pat- terns. Hydrol. Process., 25, 465–498. Buytaert, W., Wyseure, G., De Bievre, B., Deckers, J., 2004. The use of the linear reservoir concept to quantify the impact of changes in land use on the hydrology of catchments in the Andes. Hydrology and Earth Systems Science, 8, 108–114. Buytaert, W., Wyseure, G., De Bievre, B., Deckers, J., 2005. The effect of land-use changes on the hydrological behavior of Histic Andosols in south Ecuador. Hydrological Proces- ses, 19, 3985–3997. Buytaert, W., Iñiguez, V., Celleri, R., De Bièvre, B., Wyseure, G., Deckers, J., 2006. Analysis of the water balance of small páramo catchments in south Ecuador. In: J. Krecek and M. Haigh (Eds.): Environmental Role of Wetlands in Headwa- ters, Springer, pp. 271–281. Buytaert, W., Beven, K. 2011. Models as multiple working hypotheses: hydrological simulation of tropical alpine wet- lands. Hydrological Processes, 25, 1784–1799. Caballero, L.A., Rimmer, A., Easton, Z.M., Steenhuis, T.S., 2012. Rainfall runoff relationships for a cloud forest water- shed in Central America: Implications for water resource engineering. Journal of the American Water Resources As- sociation, 48, 1022–1031. Campanella, P., Dickinson, J., DuBois, R., Dulin, P., Glick, D., Merkel, A., Pool, D., Rios, R., Skillman, D., Talbot, J., 1982. Honduras. Country Environmental Profile. A field study. RB Associates Mclean VA. http://pdf.usaid.gov/ pdf_docs/PNABC410.pdf. Last accessed May 2012. Cavelier, J., Jaramillo, M., Solis, D., DeLeon, D., 1997. Water balance and nutrient inputs in bulk precipitation in tropical montane cloud forest in Panama. Journal of Hydrology, 193, 83–96. Charlier, J.B. Cattan, P., Moussa, R., Voltz, M., 2008. Hydro- logical behavior and modeling of a volcanic tropical culti- vated catchment. Hydrological Processes. Hydrol. Process., 22, 4355–4370. Collick, A.S., Easton, Z.M., Ashagrie, T., Biruk, B., Tilahun, S., Adgo, E., Awulachew, S.B., Zeleke, G., Steenhuis, T.S., 2009. A simple semi-distributed water balance model for the Ethiopian highlands. Hydrological Processes, 23, 3718– –3727. Easton, Z.M., Fuka, D.R., White, E.D, Collick, A.S., Ashagre, B.B, McCartney M., S.B. Awulachew, S.B., Ahmed, A.A., Steenhuis, T.S., 2010. A multi basin SWAT model analysis of runoff and sedimentation in the Blue Nile, Ethiopia. Hy- drol. Earth Syst. Sci., 14, 1827–1841. Falkenmark, M., Chapman, T., 1993. Hidróloga comparada: Un enfoque ecológico a los recursos hídricos y de suelo. UNESCOCEDEX, Madrid. Goodrich, D.C., 1992. An Overview of the USDA-ARS Cli- mate Change and Hydrology Program and Analysis of Mod- el Complexity as a Function of Basin Scale. In: Proceedings of a Workshop: Effects of Global Climate Change on Hy- drology and Water Resources at Catchment Scale, Tsukuba, Japan, pp. 233–242. Gonzales de Asis, M., O’Leary, D., Ljung, P., Butherworth, J., 2007. Improving Transparency, Integrity and Accountability in Water Supply and Sanitation. The International Bank for Reconstruction and Development/The World Bank. Wash- ington D.C. Harpold, A.A., Lyon, S.W., Troch, P.A., Steenhuis, T.S., 2010. The Hydrological effects of lateral preferential flow paths in a glaciated watershed in the Northeastern USA. Vadose Zone Journal, 9, 397–414. Hastenrath, S., 2011. The intertropical convergence zone of the eastern pacific revisited. International Journal of Climatolo- gy, 22, 347–356. Horvat O., Hlavcova, K., Kohnova, S., Danko, M., 2009. Ap- plication of the FRIER distributed model for estimating the impact of land use changes on the water balance in selected basins in Slovakia. J. Hydrol. Hydromech., 57, 4, 213–225. IGN (Instituto Geográfico Nacional), 1956. Geología de Hon- duras 1 : 50,000 San Juan de Flores Quad. International Organization of Standards (ISO), 1980. Water flow measurement in open channels using weirs and venturi flumes – Part 1: Thin plate weirs. 1438/1-1980(E). Available from Global Engineering Documents at http://global.ihs.com. Jenícek, M., 2009. Runoff changes in areas differing in land- use in the Blanice river basin – application of the determinis- tic model J. Hydrol. Hydromech., 57, 154–161. Kovacs, G., 1984. Proposal to construct a coordinating matrix for comparative hydrology. Hydrological Sciences Journal- Journal des Sciences Hydrologiques, 29, 435–443. Lavaire, T, Fiallos, E., 2010. Potencial de captura de agua de los suelos de la microcuenca El Carrizal, Parque Nacional La Tigra, Francisco Morazán, Honduras. Proyecto de espe- cial de graduación, Escuela Agrícola Panamericana, Hondu- ras.
  • 12.
    Luis A. Caballero,Zachary M. Easton, Brian K. Richards, Tammo S. Steenhuis 20 Lyon, S.W., McHale, M.R., Walter, M.T., Steenhuis, T.S., 2006. The Impact of Runoff Generation Mechanisms on the Location of Critical Source Areas. Journal of the American Water Resources Association (JAWRA), 42, 793–804. Mamillapalli, S., Srinivasan, R., Arnold, J.G., Engel, B.A., 1996. Effect of spatial variability on basin scale modeling. In: Proceedings of the Third International Confer- ence/Workshop on Integrating GIS and Environmental Modeling. National Center for Geographic Information and Analysis, Santa Barbara, California. Available at: http://www.ncgia.ucsb.edu/conf/SANTA_FE_CD-ROM/ program.html. Martinez, M.C., 2008. Potencial de captura de agua de los suelos de Capiro y Zapotillo, Guinope, El Paraíso, Hondu- ras. Proyecto de especial de graduación, Escuela Agrícola Panamericana, Honduras. Mulligan, M., Burke S.M., 2010. Global cloud forests and environmental change in a hydrological context. Final report of DFID FRP project ZF0216. Musiake, K., 2003: Hydrology and water resources in monsoon Asia. A consideration of the necessity of establishing a standing research community of hydrology and water re- sources in the Asia Pacific region. Hydrological Processes, 17, 2701–2709. Nash, J.E., Sutcliffe, J., 1970. River flow forecasting through conceptual models, Part I. A discussion of principles. Jour- nal of Hydrology, 10, 282–290. Pavelkova H., Dohnal, M., Vogel, T., 2012. Hillslope runoff generation – comparing different modeling approaches. J. Hydrol. Hydromech., 60, 73–86. Peranginangin, N. Sakthivadivel, R., Scott, N.R., Kendy, E., Steenhuis, T.S., 2004. Water accounting for conjunctive groundwater/surface water management: Case of the Sing- karak-Ombilin River basin, Indonesia Journal of Hydrology, 292, 1–22. PHO (Pan-American Health Organization and World Health Organization). 2000. Evaluación de los Servicios de Agua Potable y Saneamiento 2000 en las Américas. http:// www.bvsde.paho.org/eswww/eva2000/honduras/informe/inf -00.htm. Last accessed May 2012. Peel, M.C., McMahon, T.A., Finlayson B.L., 2004. Continental differences in the variability of annual runoff-update and re- assessment. Journal of Hydrology, 295, 185–197. San Martin, O. 2001. Water Resources in Latin America and the Caribbean: Issues and Options. Inter-American Devel- opment Bank, Environment Division. http:// www.pnuma.org/aguamiaac/SUBREGIONAL%20MESO/M ATERIAL%20ADICIONAL/BIBLIOGRAFIA- WEBGRAFIA/Modulo%201%20MIAAC%20en%20el%20 contex- to%20de%20gestion%20para%20DS/Estado%20del%20Rec %20Hidrico/Doc%204.%20Water%20resources.pdf. Last accesses May 2012. Šanda, M., Císlerová, M., 2009. Transforming hydrographs in the hillslope subsurface. J. Hydrol. Hydromech., 57, 264– –275. Sivapalan, M., 2003. Process complexity at hillslope scale, process simplicity at the watershed scale: Is there a connec- tion? Hydrological Processes, 17, 1037–1041. Schellekens, J., 2006. CQ-FLOW: A distributed hydrological model for the prediction of land-cover change, with special reference to the Rio Chiquito catchment, Northwest Costa Rica. The Fiesta Project, Vrije Universiteit, Amsterdam, 2006. http://www.falw.vu/~fiesta/reports/R7991_FTR_An- nex3_CQflow-manual-results.pdf. Last accessed May 2012. Shumova, N., 2009. Crop water supply and its relation to yield of spring wheat in the south of Russian plain. J. Hydrol. Hy- dromech., 57, 2009, 1, 26–39. Stadtmüller, T., 1987. Cloud Forests in the Humid Tropics: A Bibliographic Review. United Nations University (UNU): http://archive.unu.edu/unupress/unupbooks/80670e/ 80670E00.htm80670e/80670E00.htm. Last accessed May 2012. Stadtmüller, Agudelo, N., 1990. Amount and variability of cloud moisture input in a tropical cloud forest. International Association of Hydrological Sciences Publication, 193, 25– –32. Steenhuis, T.S., van der Molen, W.H., 1986. The Thornthwaite- Mather procedure as a simple engineering method to predict recharge. Journal of Hydrology, 84, 221–229. Steenhuis, T.S., Collick A.S., Easton Z.M., Leggesse, E.S., Bayabil, H.K., White, E.D., Awulachew, S.B., Adgo, E., Ahmed, A.A., 2009. Predicting discharge and erosion for the Abay (Blue Nile) with a simple model. Hydrological Pro- cesses, 23, 3728–3737. Tesemma, Z.K., Mohamed, Y.A., Steenhuis, T.S., 2010. Trends in rainfall and runoff in the Blue Nile Basin: 1964–2003. Hydrological Processes, 25, 3747–3758. Thornthwaite, C.W., 1948. An approach toward a rational clas- sification of climate. Geogr. Rev., 38, 55–94. Thornthwaite, C.W., Mather, J.R. 1955. The water balance, Publ. Climatol. Lab. Climatol. Dresel Inst. Technol., 8, 1– –104. UNDP: Adaptation Fund Board Secretariat., 2010. Addressing Climate Change Risks on Water Resources in Honduras: In- creased Systemic Resilience and Reduced Vulnerability of the Urban Poor. UNDP PIMS 4399; Atlas IDs-Proposal 00060323, Project 00075904, HND10). Walter, M.T., Steenhuis, T.S., Mehta, V.K., Thongs, D., Zion, M., Schneiderman, E., 2002. Refined conceptualization of TOPMODEL for shallow subsurface flows. Hydrological Processes, 16, 2041–2046. Received 30 September 2012 Accepted 11 December 2012 Note: Supplementary Figures (S1–S9), as well as colour version of Figures 1–3 can be found in the web version of this article.
  • 13.
    Evaluating the bio-hydrologicalimpact of a cloud forest in central America using a semi-distributed water balance model SUPPLEMENTARY MATERIAL Fig. S1. Monthly precipitation at experimental site compared to long-term average Zamorano weather station and La Tigra SA- NAA. Source: Zamorano University (1942–2009) and SANAA (1963–2008). Fig. S2a. The weirs in the watershed. Fig. S2b. Location of instrumentation in the watershed. Fig. S3. Daily average precipitation (P) and potential evaporation (PE) used in SWB model for the La Tigra National Park. Fig. S4. Saturated area in the La Tigra National park. Spring house in the back collects the spring water. Fig. S5. Comparison of the rainfall of the rain gages RG1 at 1350 m and RG3 at 1800 m elevation for the period starting at August 25 through October 16, 2008 in the La Tigra National Park in Hondu- ras.
  • 14.
    Luis A. Caballero,Zachary M. Easton, Brian K. Richards, Tammo S. Steenhuis Fig. S6. Comparison of the rainfall of the rain gages RG1 at 1350 m and RG3 at 1800 m elevation for the period starting at May 18, 2009 through January 10, 2010 in the La Tigra National Park in Honduras. Fig. S7. Comparison of the rainfall of the rain gages RG3 at 1800 m at the east site and RG4 at the west site at 1830 m elevation for the period starting at September 5, 2009 through October 4, 2009 in the La Tigra National Park in Honduras.       Fig. S8. Comparison of observed and predicted daily total stream discharges for the watershed WS1 and the average rainfall and parameters listed in Table 2 and the with rainfall at gage RG3 at 1800 m and parameters listed in Table 2 with the exception of the contributing hillslope area that was reduced to 0.83.     Fig. S9. Comparison of observed and predicted daily total stream discharges for the watershed WS1 and the average rainfall and parameters listed in Table 2 and with rainfall that had the same characteristics at the rainfall for the watersheds that were listed in Table 2 with the exception of the contributing hillslope area that was reduced to 0.83 and the rainfall for the rain.