Downloaded 11 times


![Global Corruption Barometer 2013 31
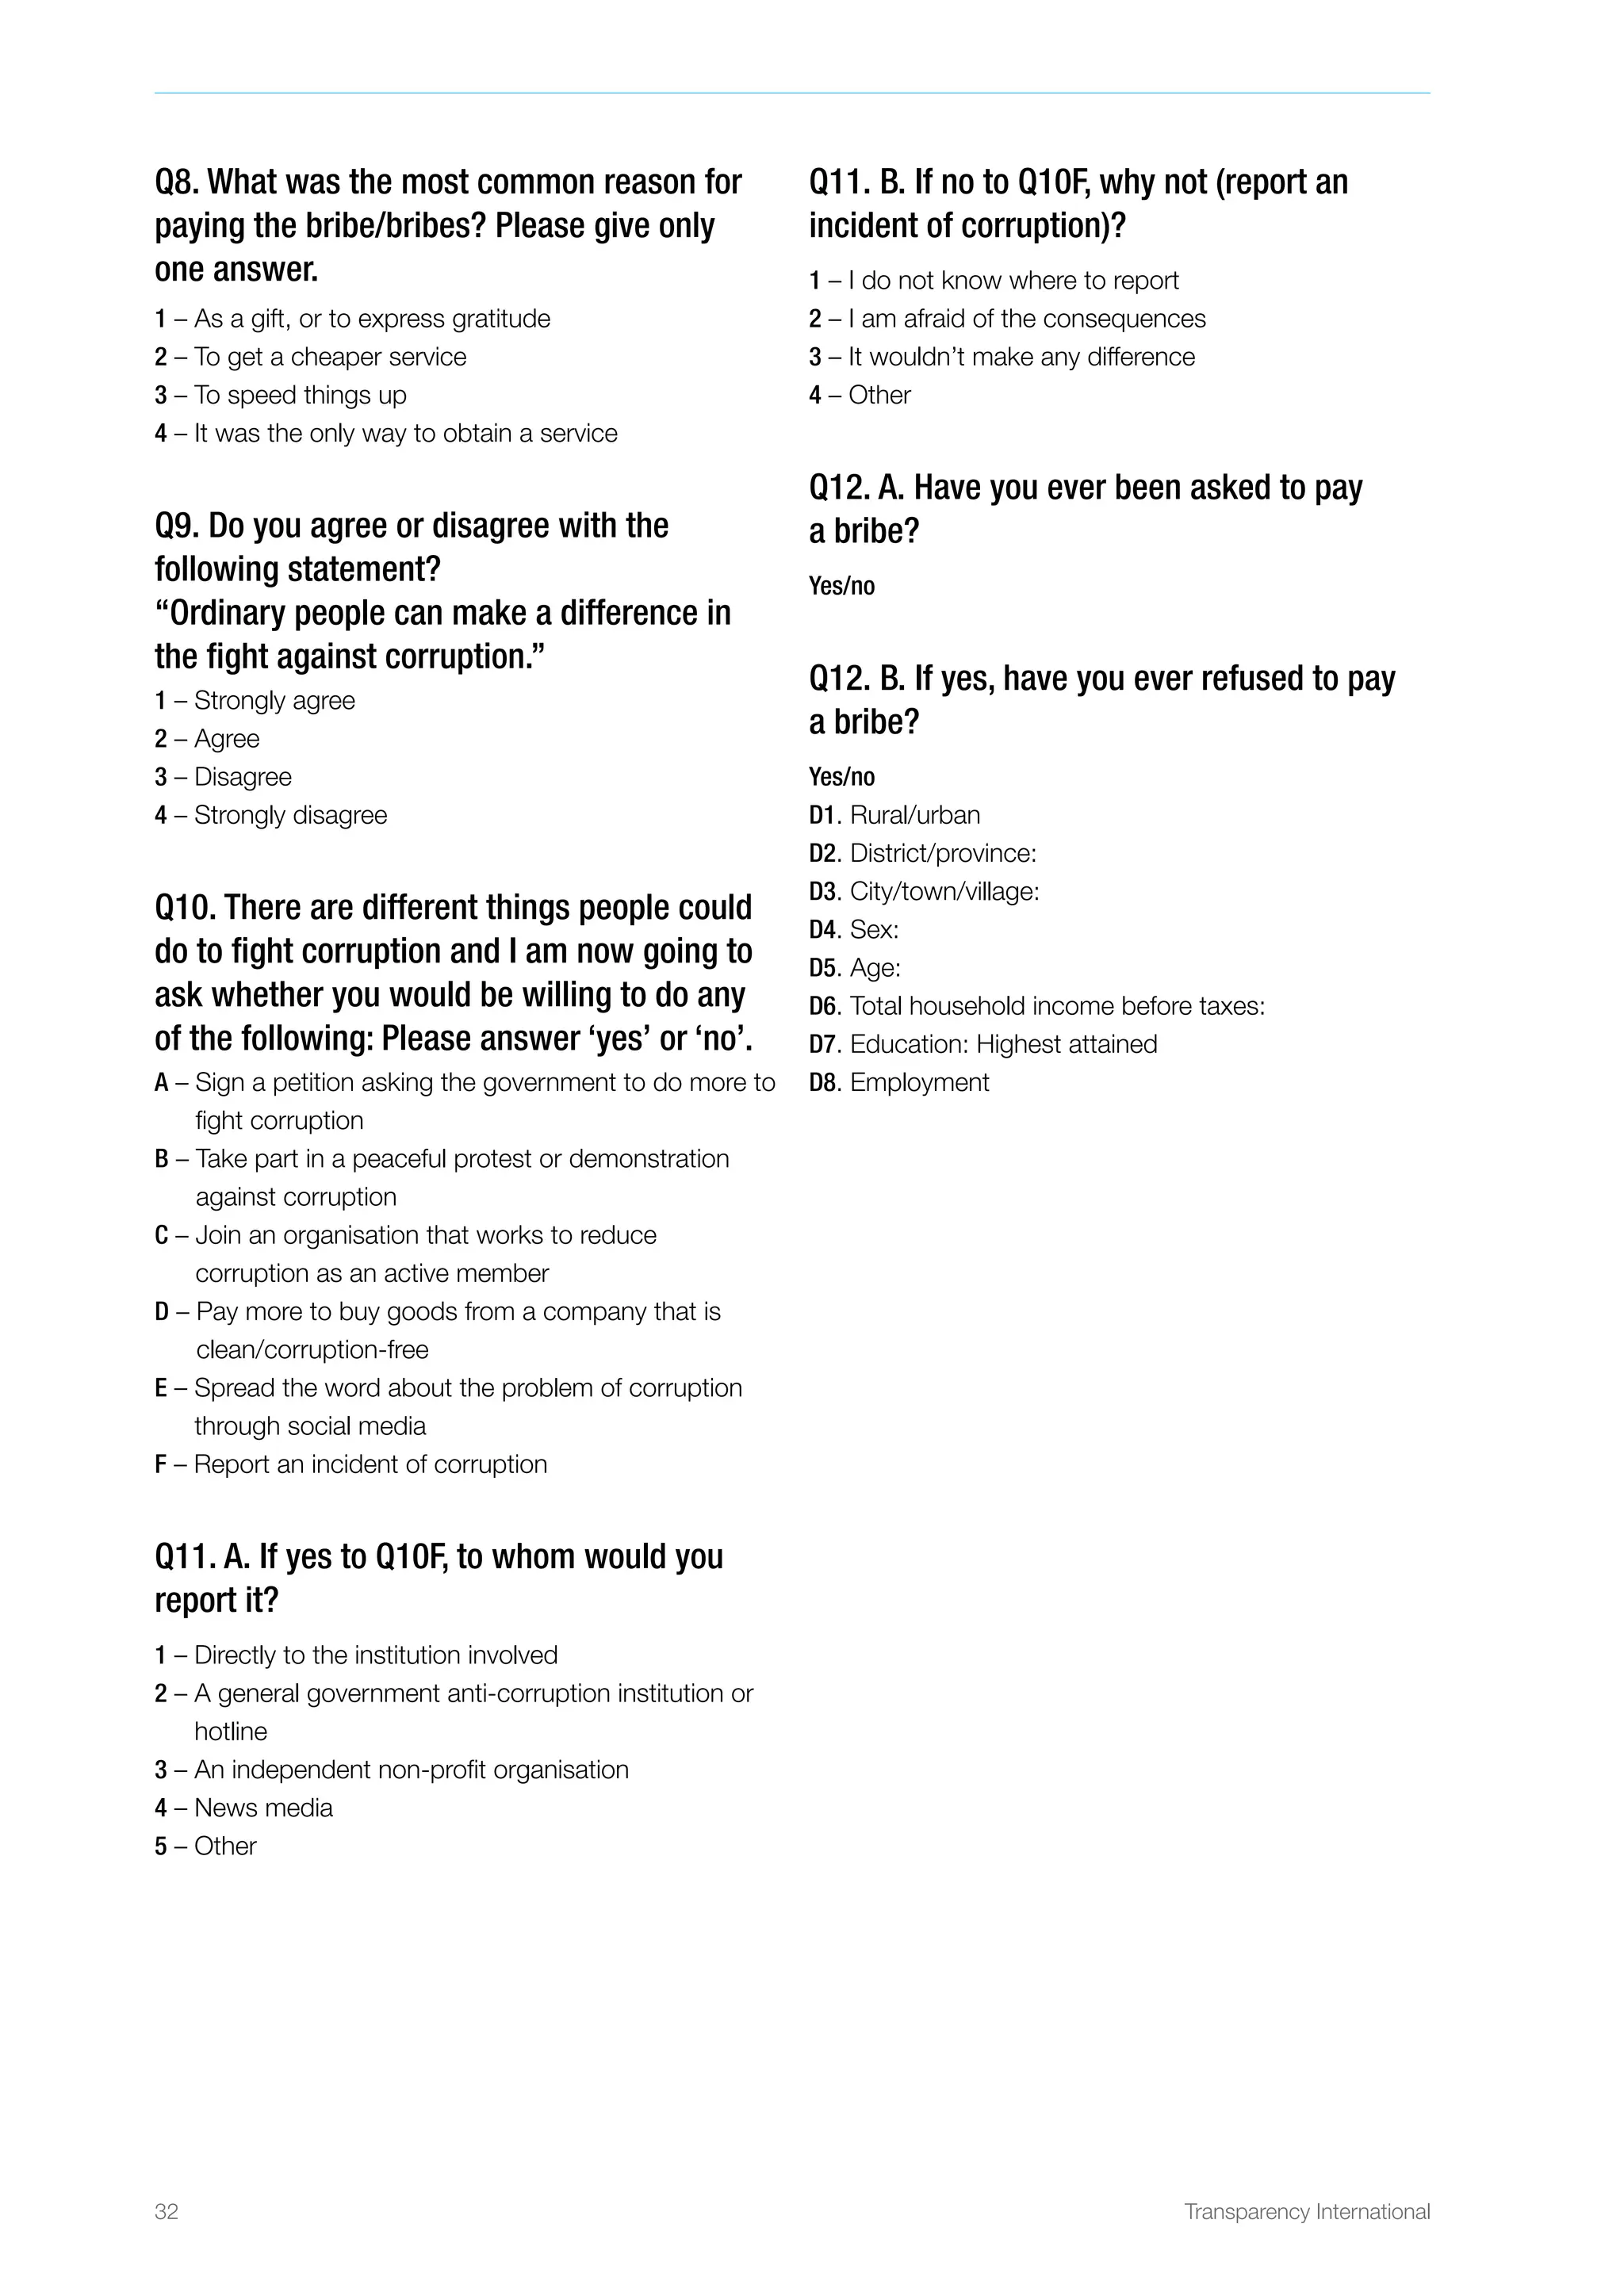
Appendix B: Questionnaire
Q1. Over the past two years, how has the
level of corruption in this country changed?
1 – Decreased a lot
2 – Decreased a little
3 – Stayed the same
4 – Increased a little
5 – Increased a lot
Q2. To what extent do you believe corruption
is a problem in the public sector in your
country? By public sector we mean all
institutions and services which are owned
and/or run by the government. Please answer
on a scale of 1 to 5, where 1 is ‘not a problem
at all’ and 5 is ‘a very serious problem’.
1 – Not a problem at all
2 – …
3 – …
4 – …
5 – A very serious problem
Q3. In your dealings with the public sector,
how important are personal contacts and/or
relationships to get things done?
1 – Not important at all
2 – Of little importance
3 – Moderately important
4 – Important
5 – Very important
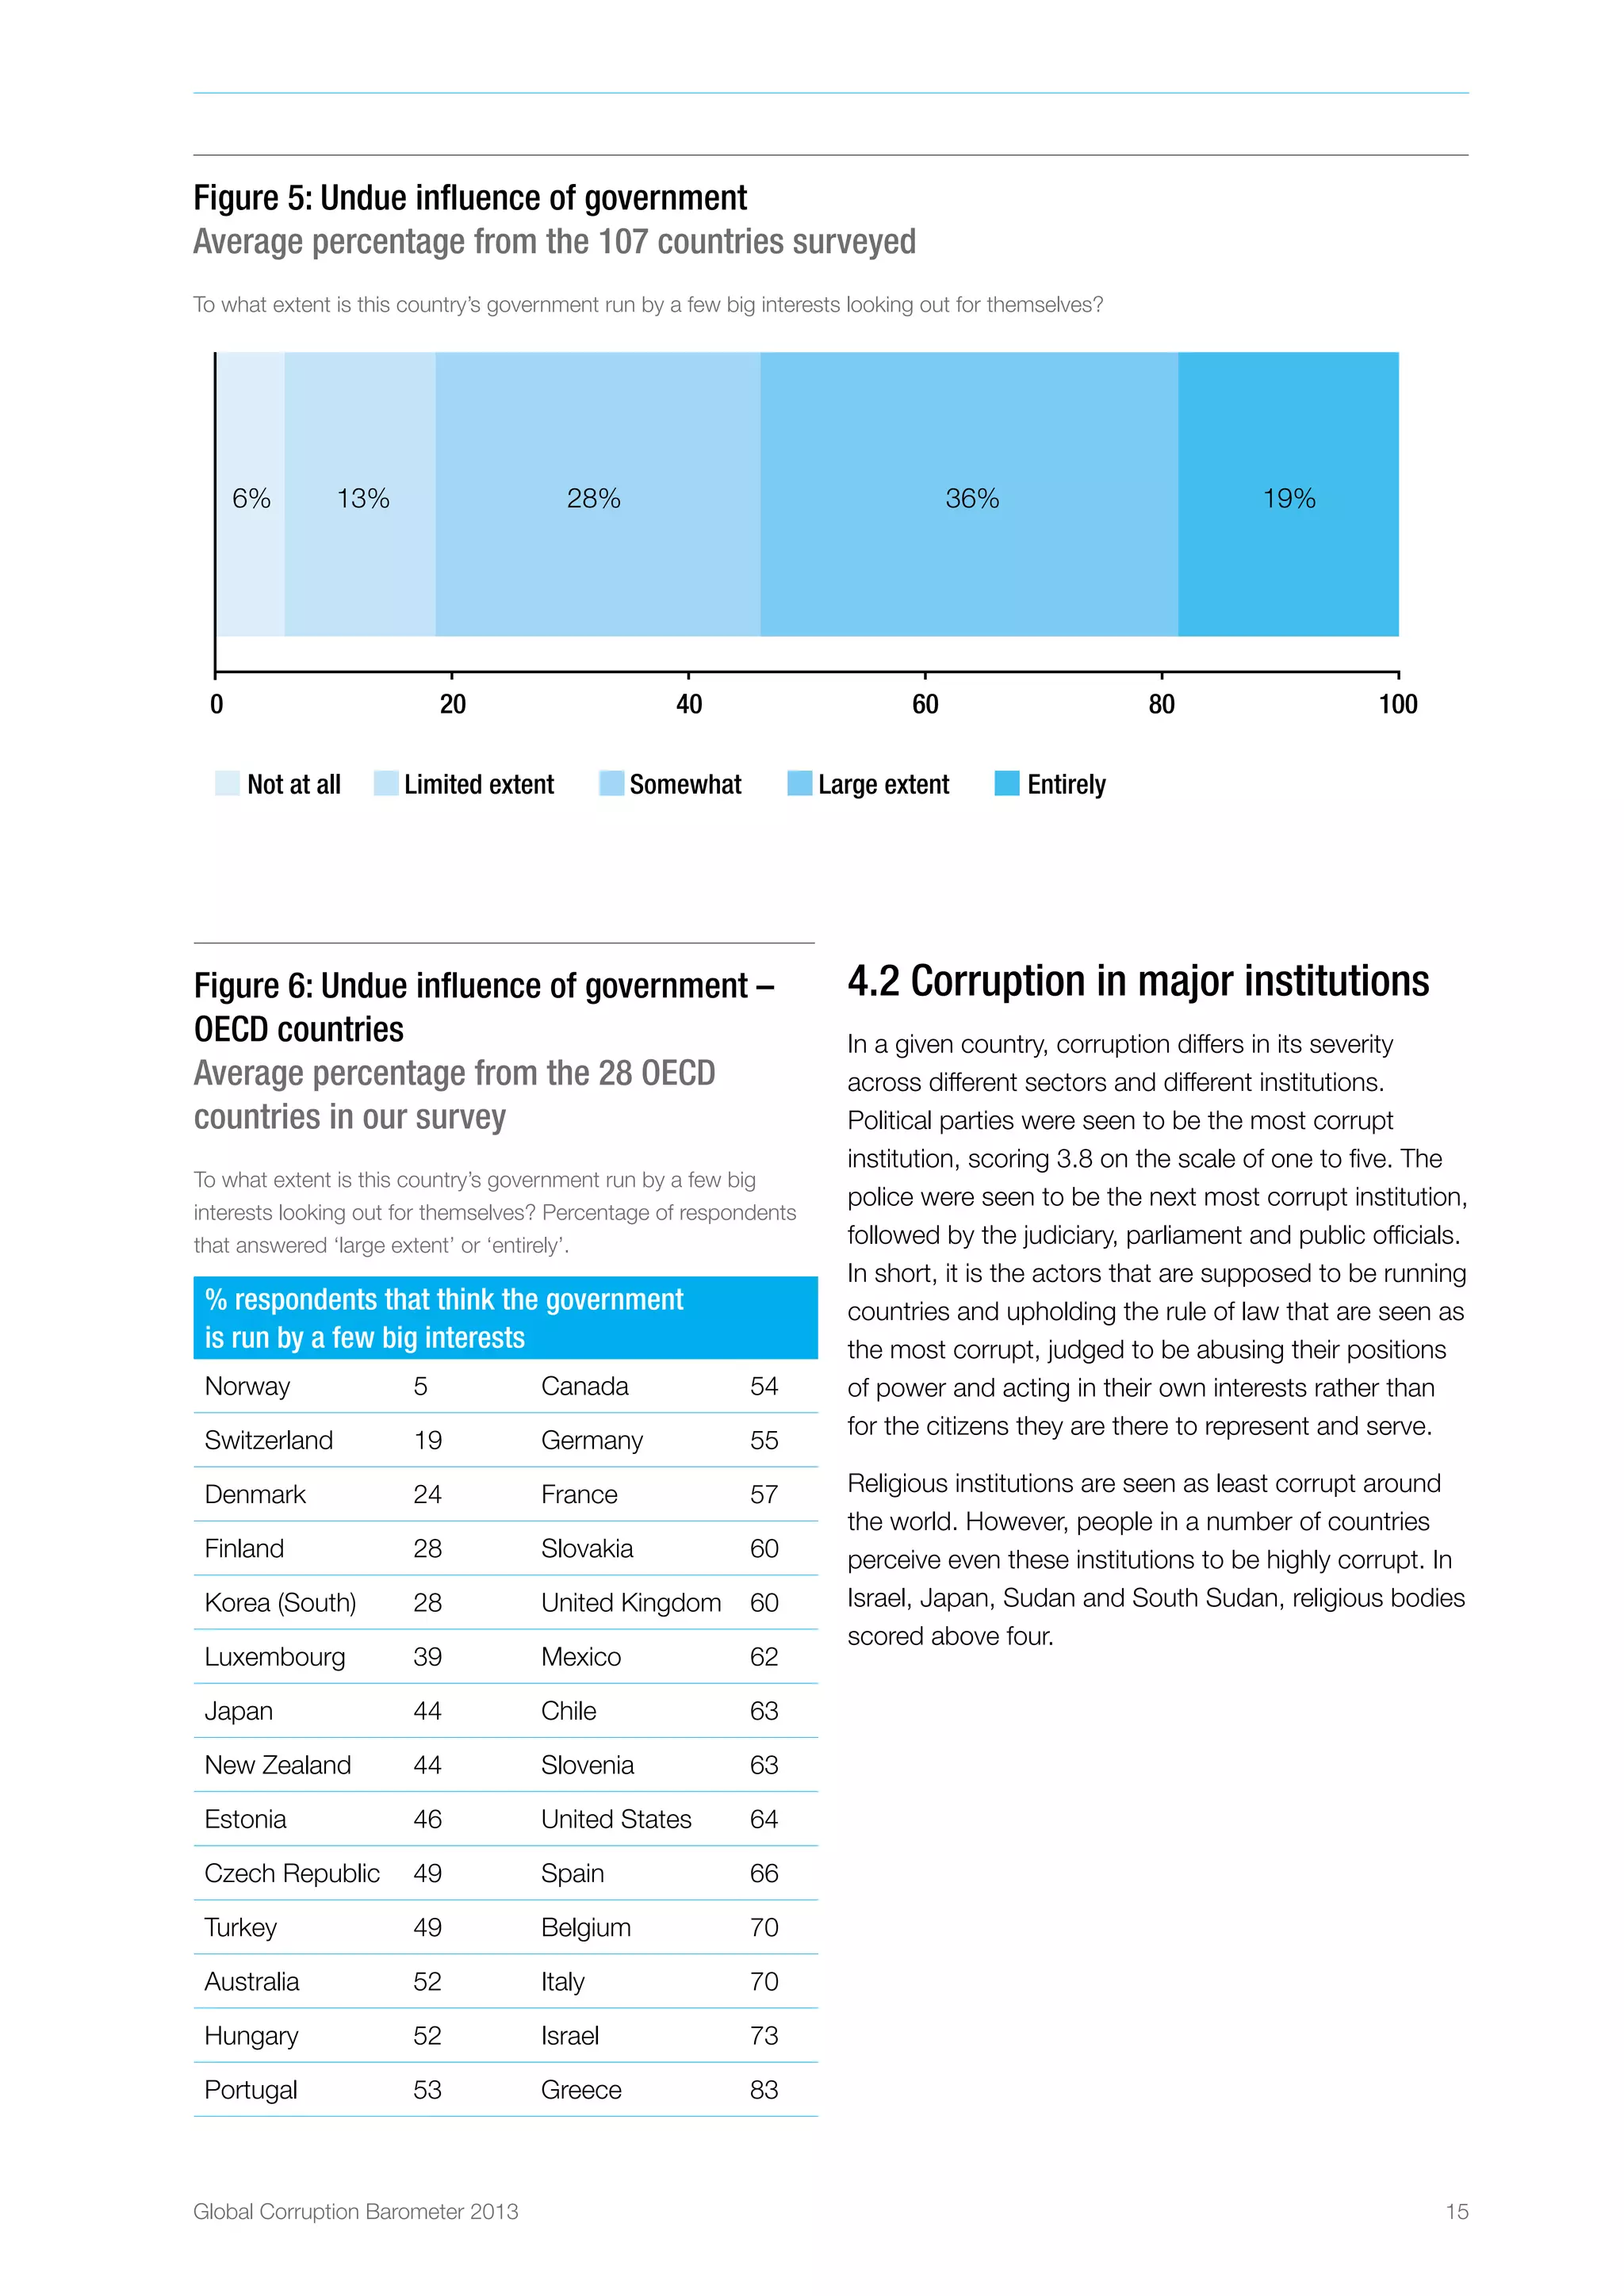
Q4. To what extent is this country’s
government run by a few big entities acting
in their own best interest?
1 – Not at all
2 – Limited extent
3 – Somewhat
4 – Large extent
5 – Entirely
Q5. How effective do you think your
government’s actions are in the fight
against corruption?
1 – Very effective
2 – Effective
3 – Neither effective nor ineffective
4 – Ineffective
5 – Very ineffective
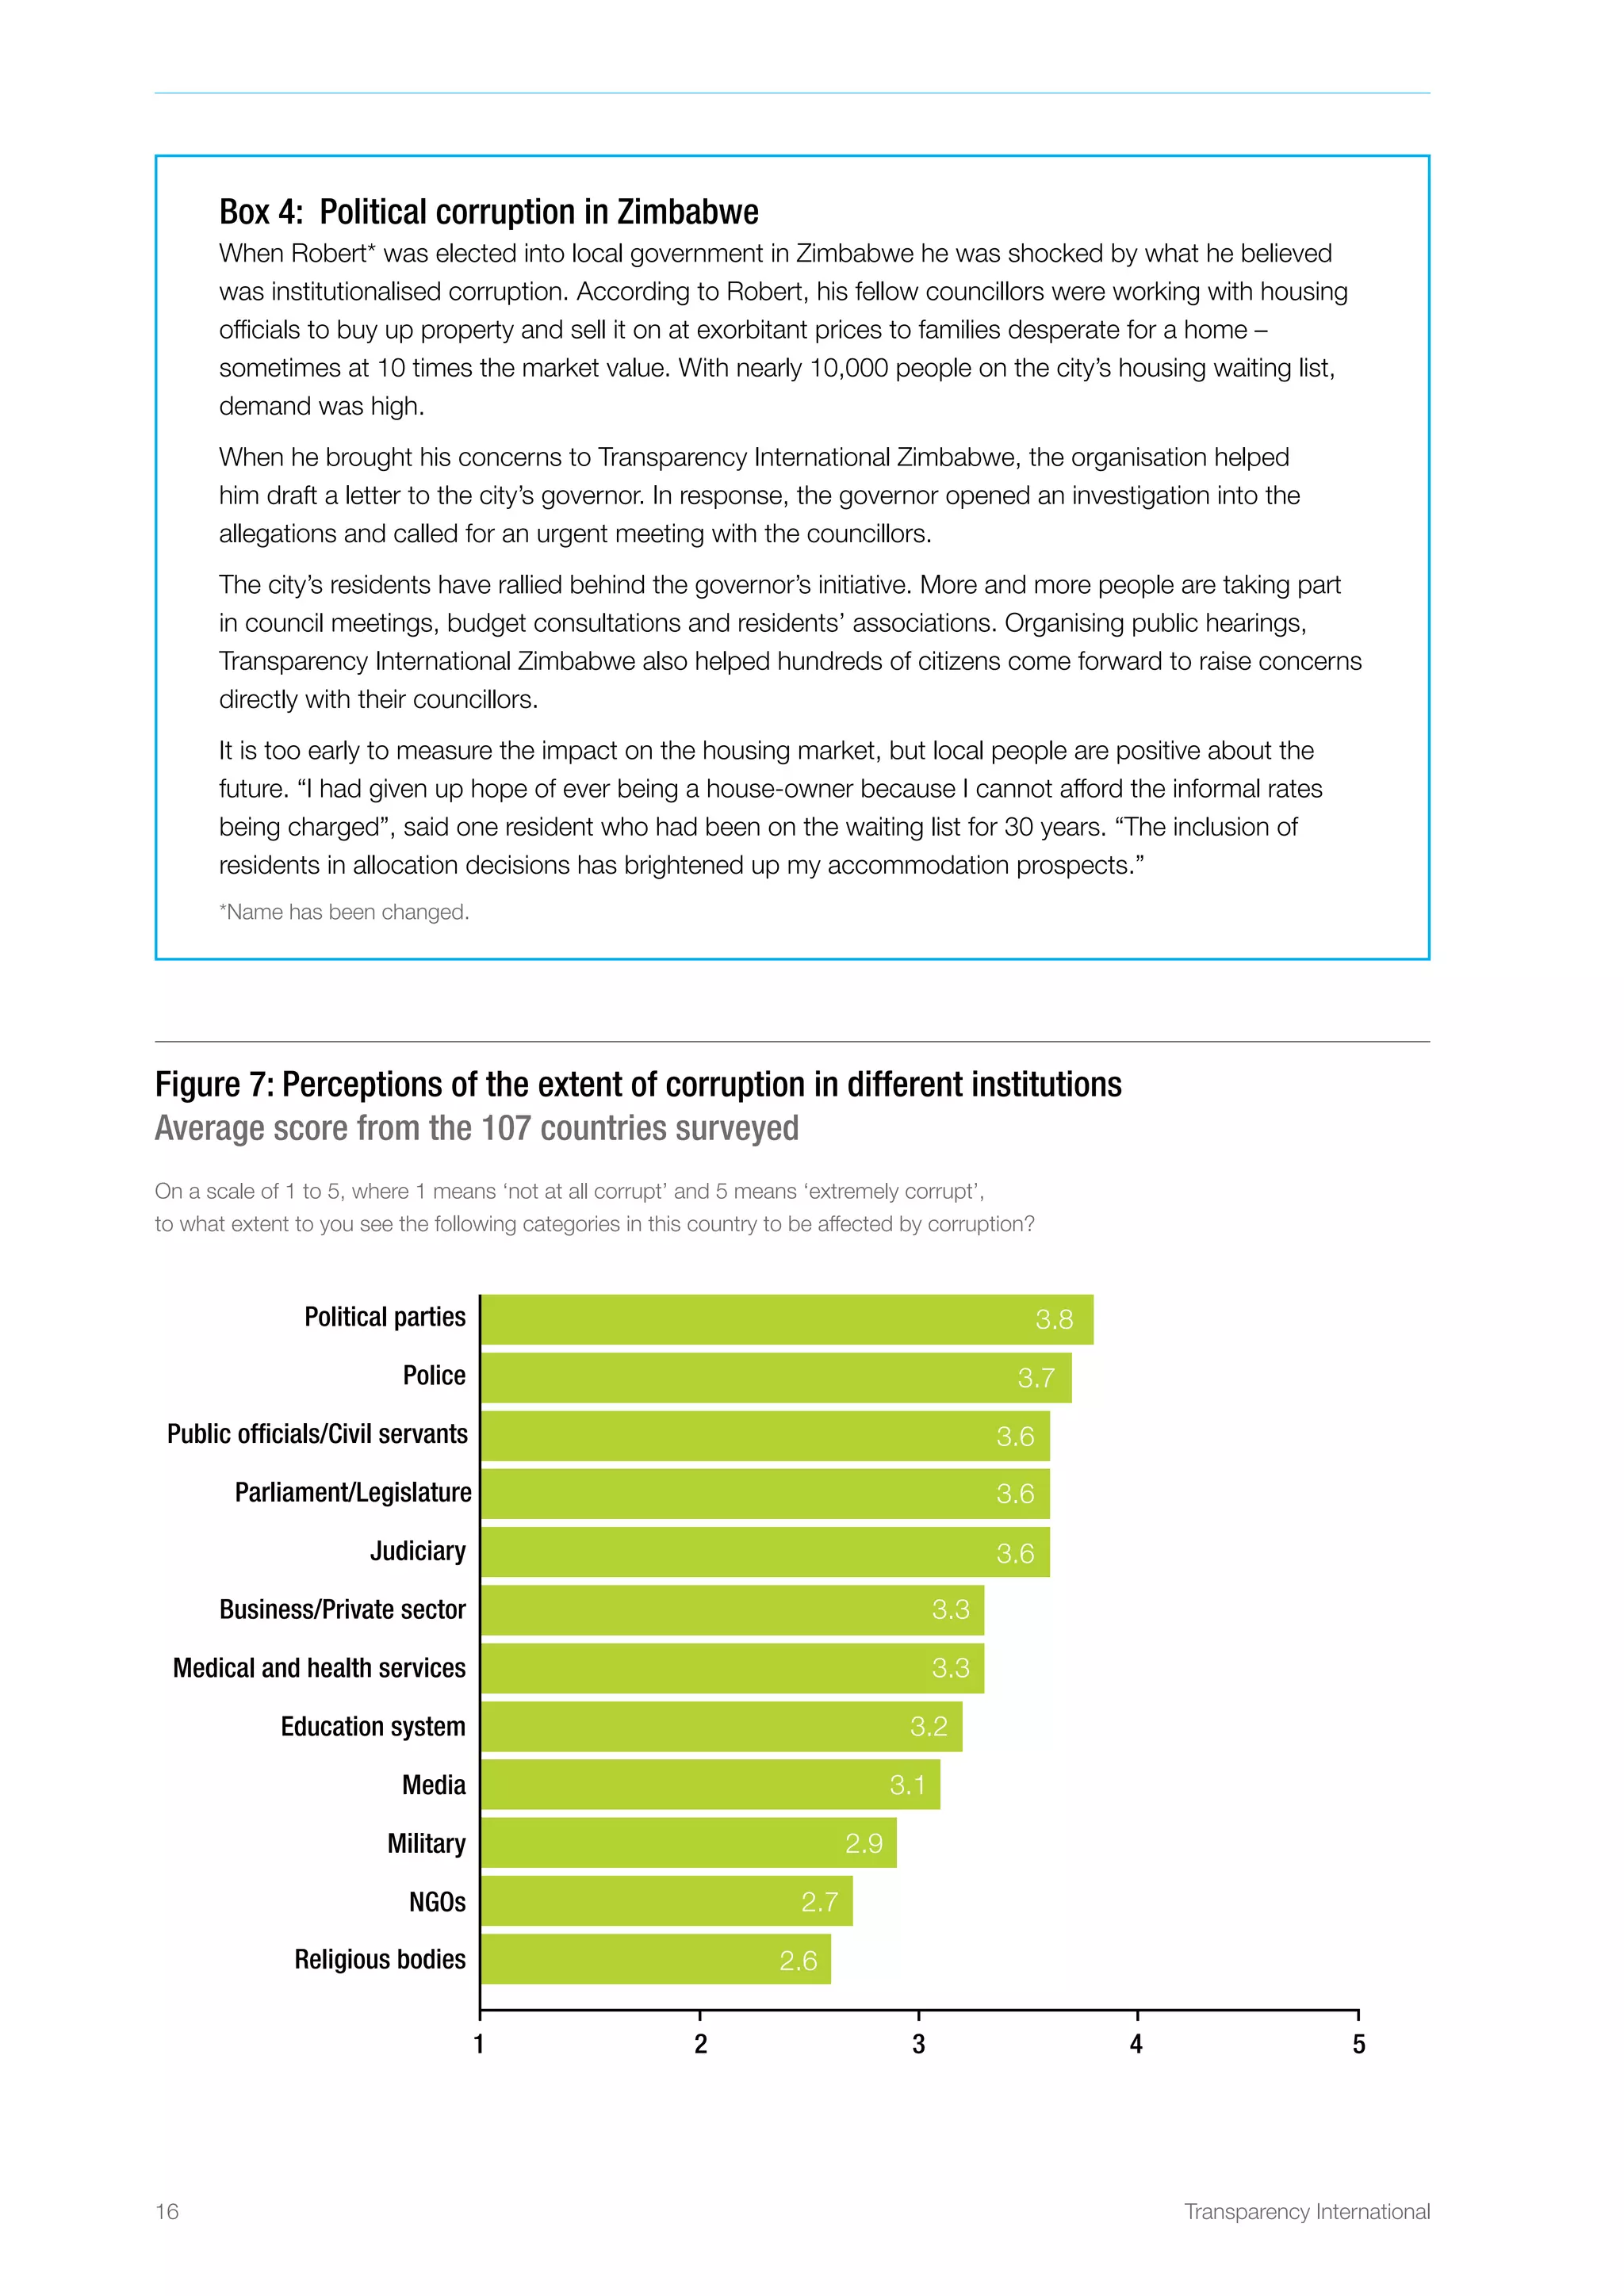
Q6. To what extent do you see the following
categories to be affected by corruption in this
country? Please answer on a scale from 1 to
5, where 1 means ‘not at all corrupt’ and 5
means ‘extremely corrupt’.
A – Political parties
B – Parliament/legislature
C – Military
D – NGOs
E – Media
F – Religious bodies
G – Business/private sector
H – Education system
I – Judiciary
J – Medical and health services
K – Police
L – Public officials/civil servants
Q7. A. In the past 12 months, have you
or anyone living in your household had a
contact or contacts with one of the following
[INSERT CATEGORY NAME 1–8]?
1 – Education system
2 – Judicial system
3 – Medical and health services
4 – Police
5 – Registry and permit services
6 – Utilities
7 – Tax
8 – Land services
Q7. B. If yes to Q7A, in your contact or
contacts have you or anyone living in your
household paid a bribe in any form in the
past 12 months?
Yes/no](https://image.slidesharecdn.com/2013globalcorruptionbarometeren-140826030634-phpapp01/75/Global-Corruption-Barometer-2013-33-2048.jpg)

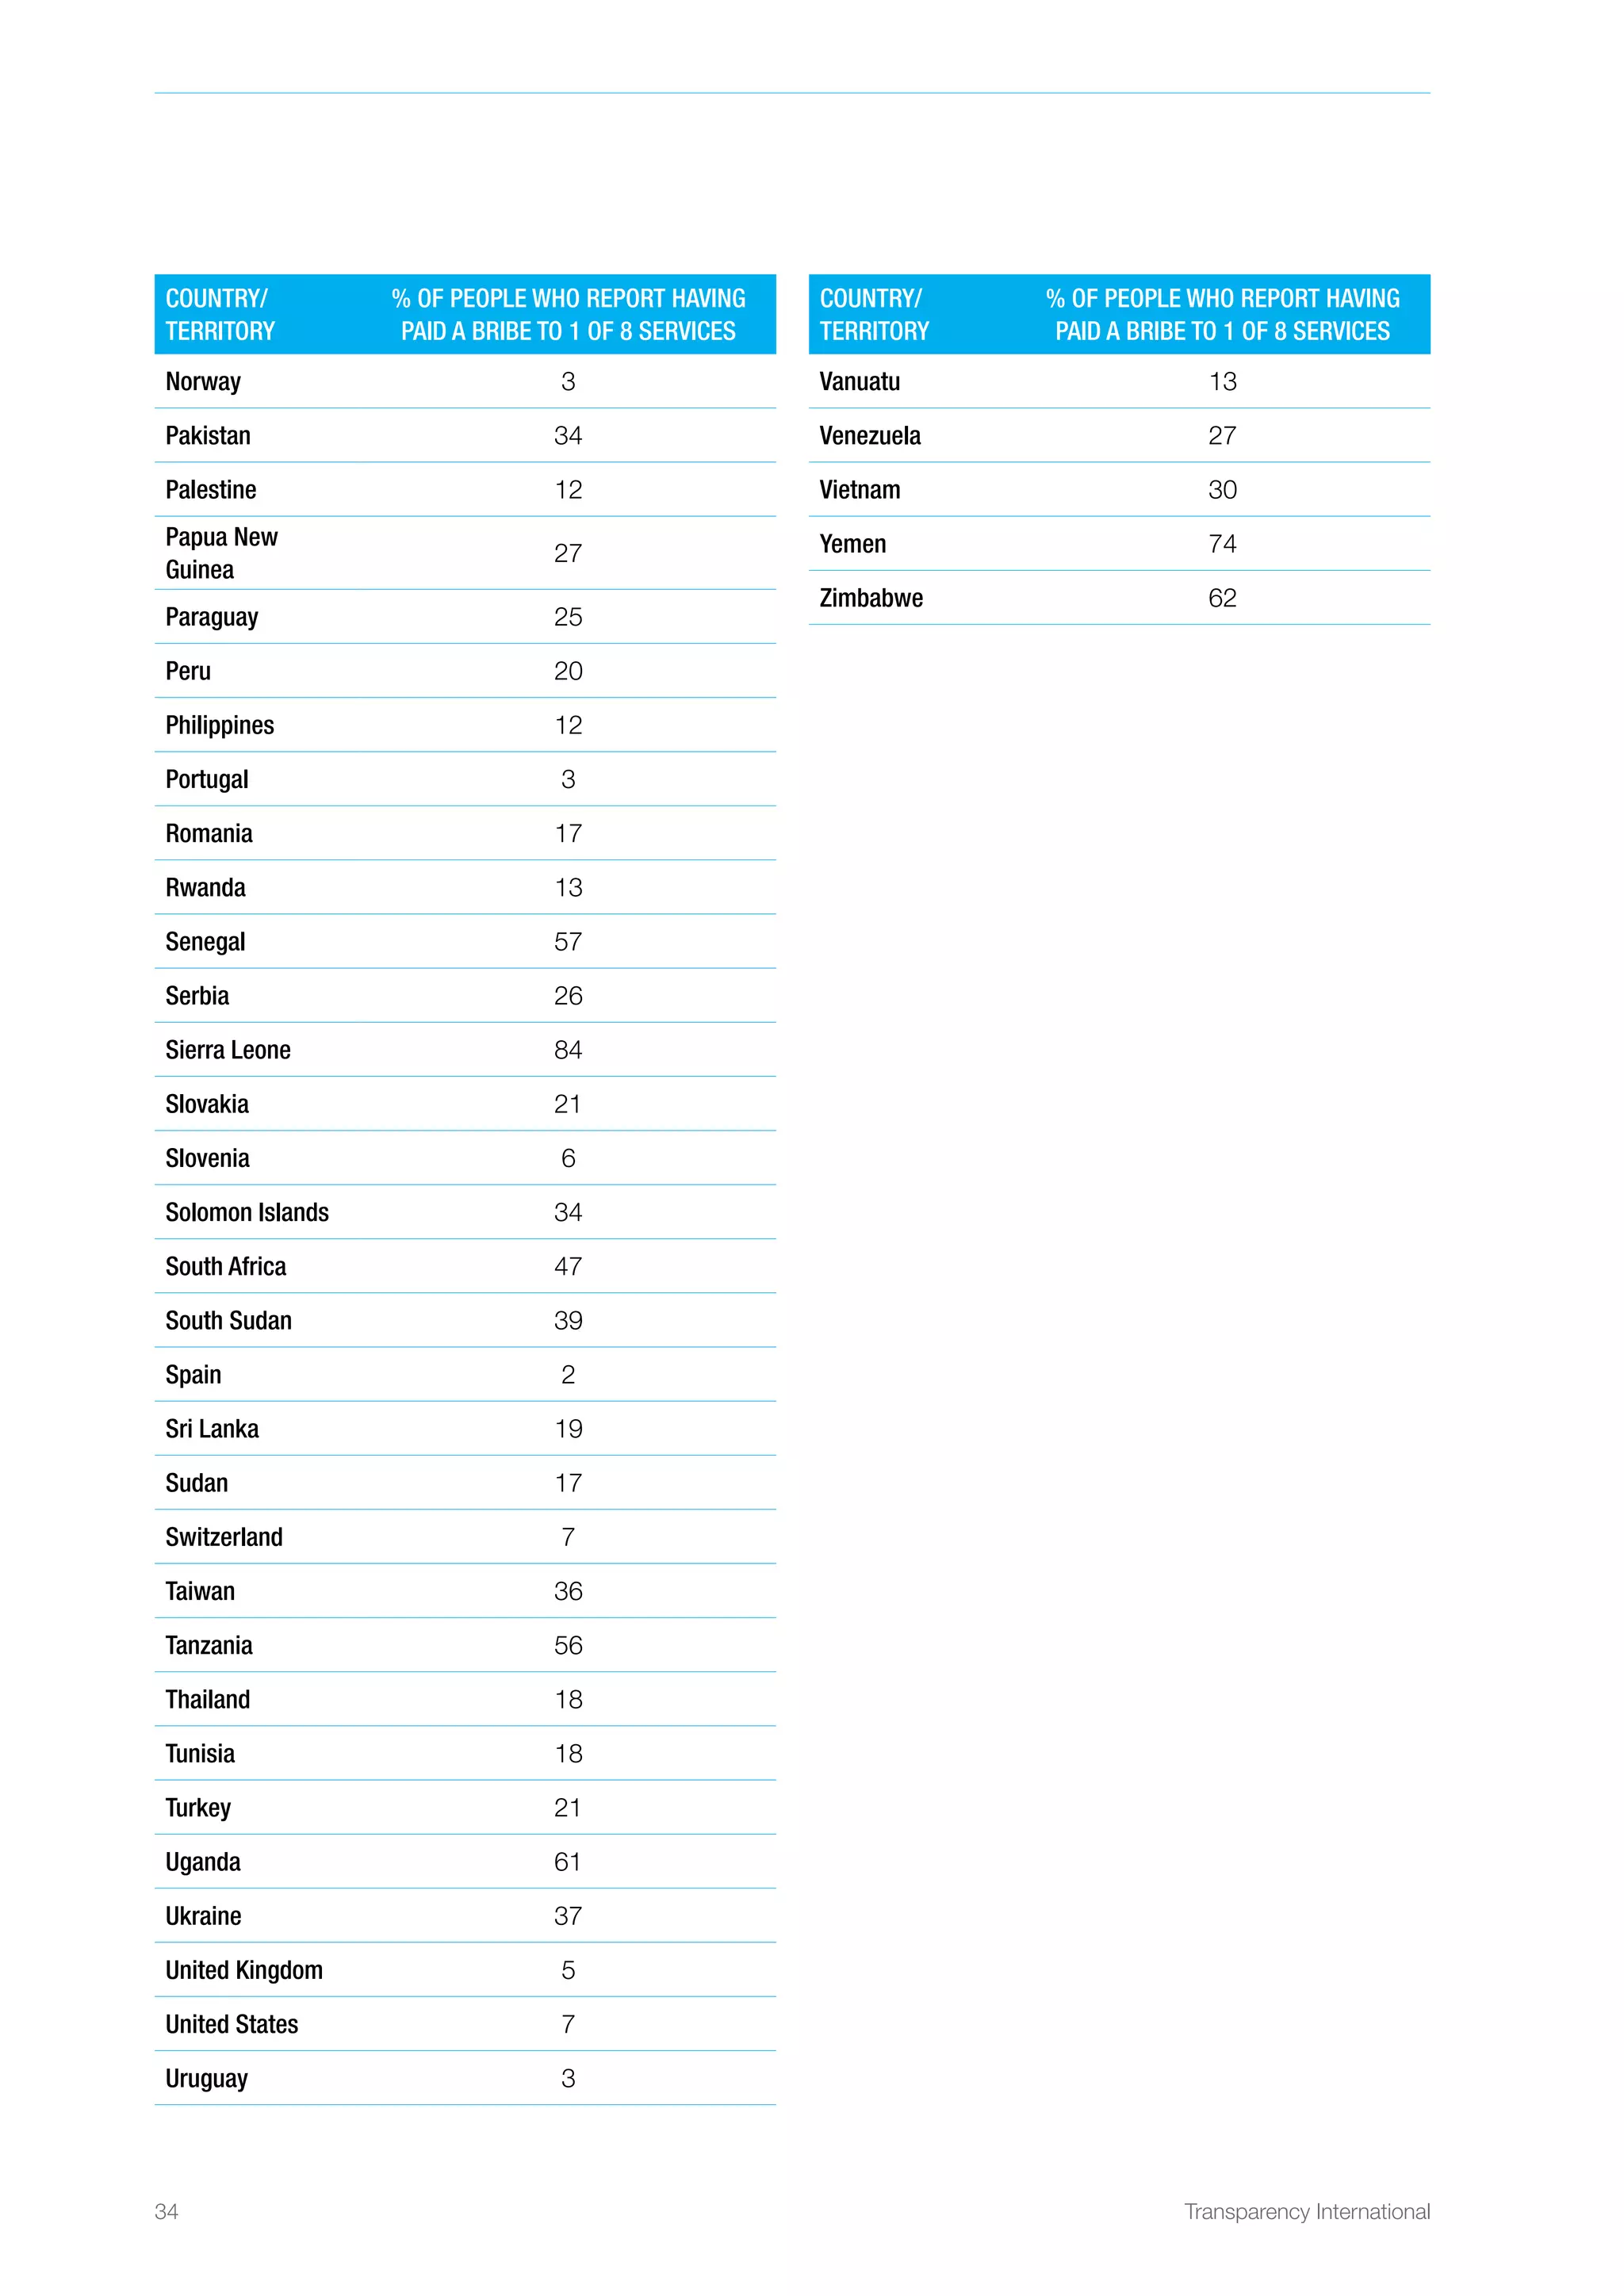

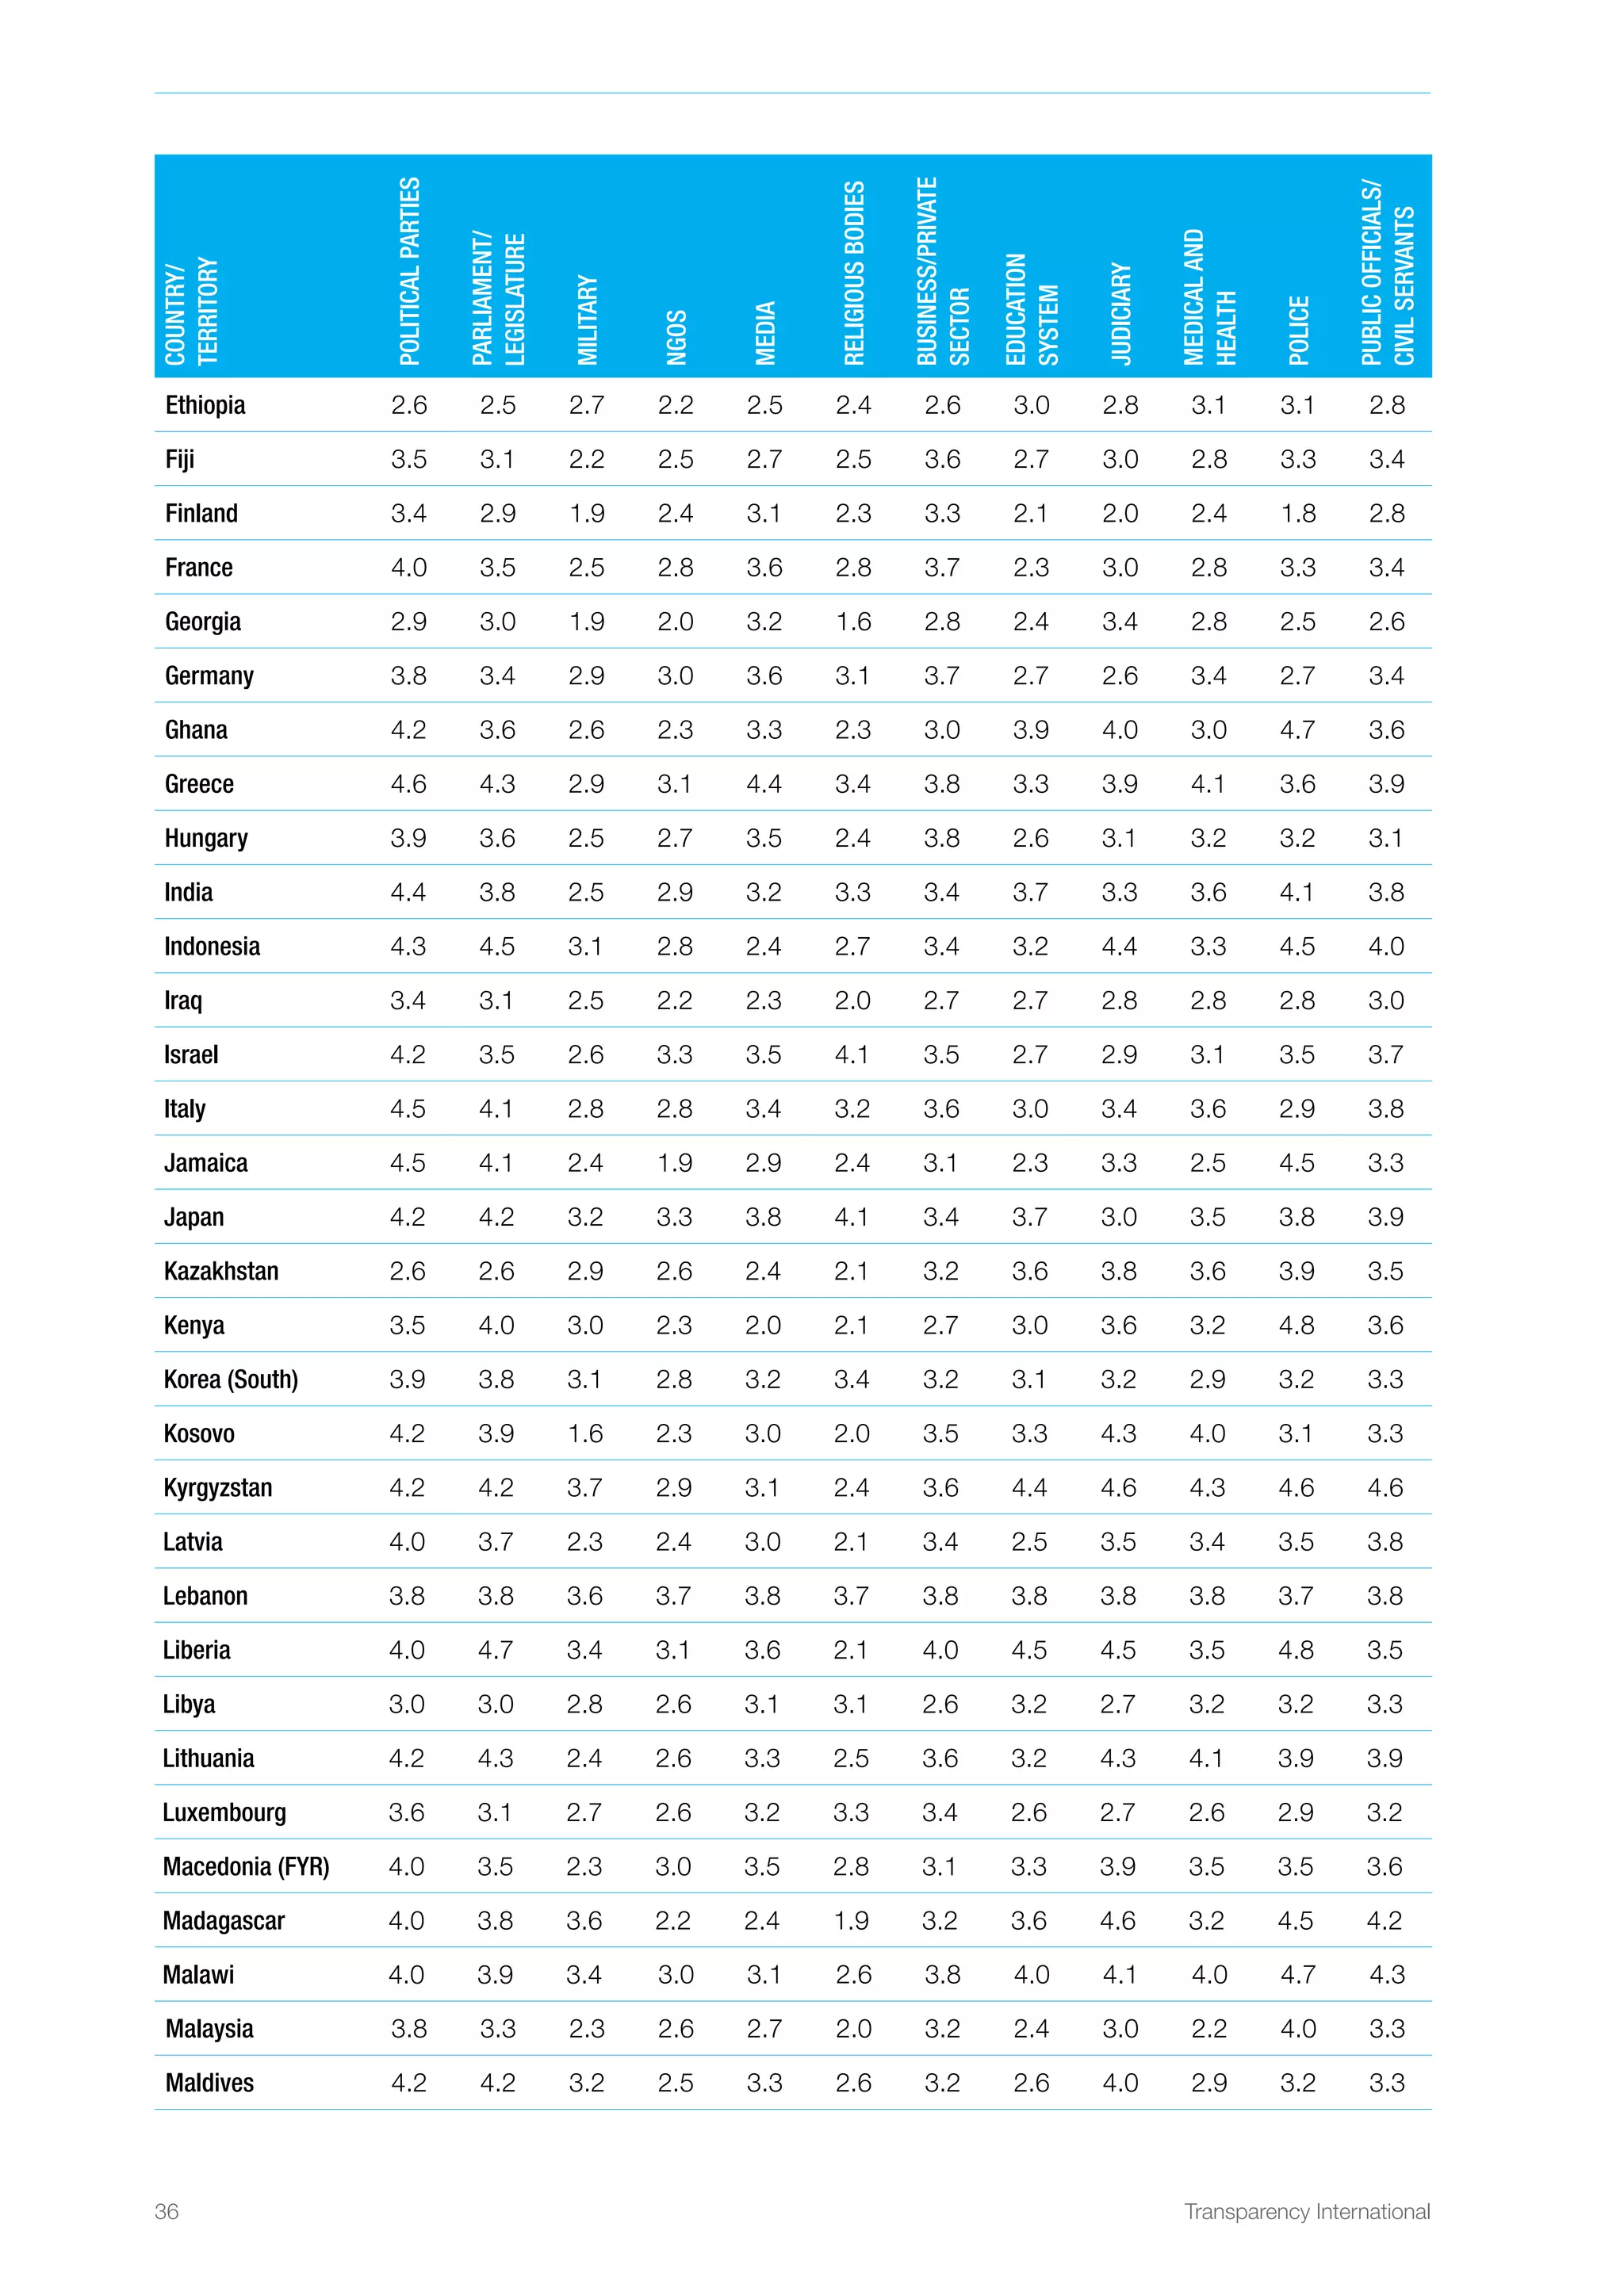

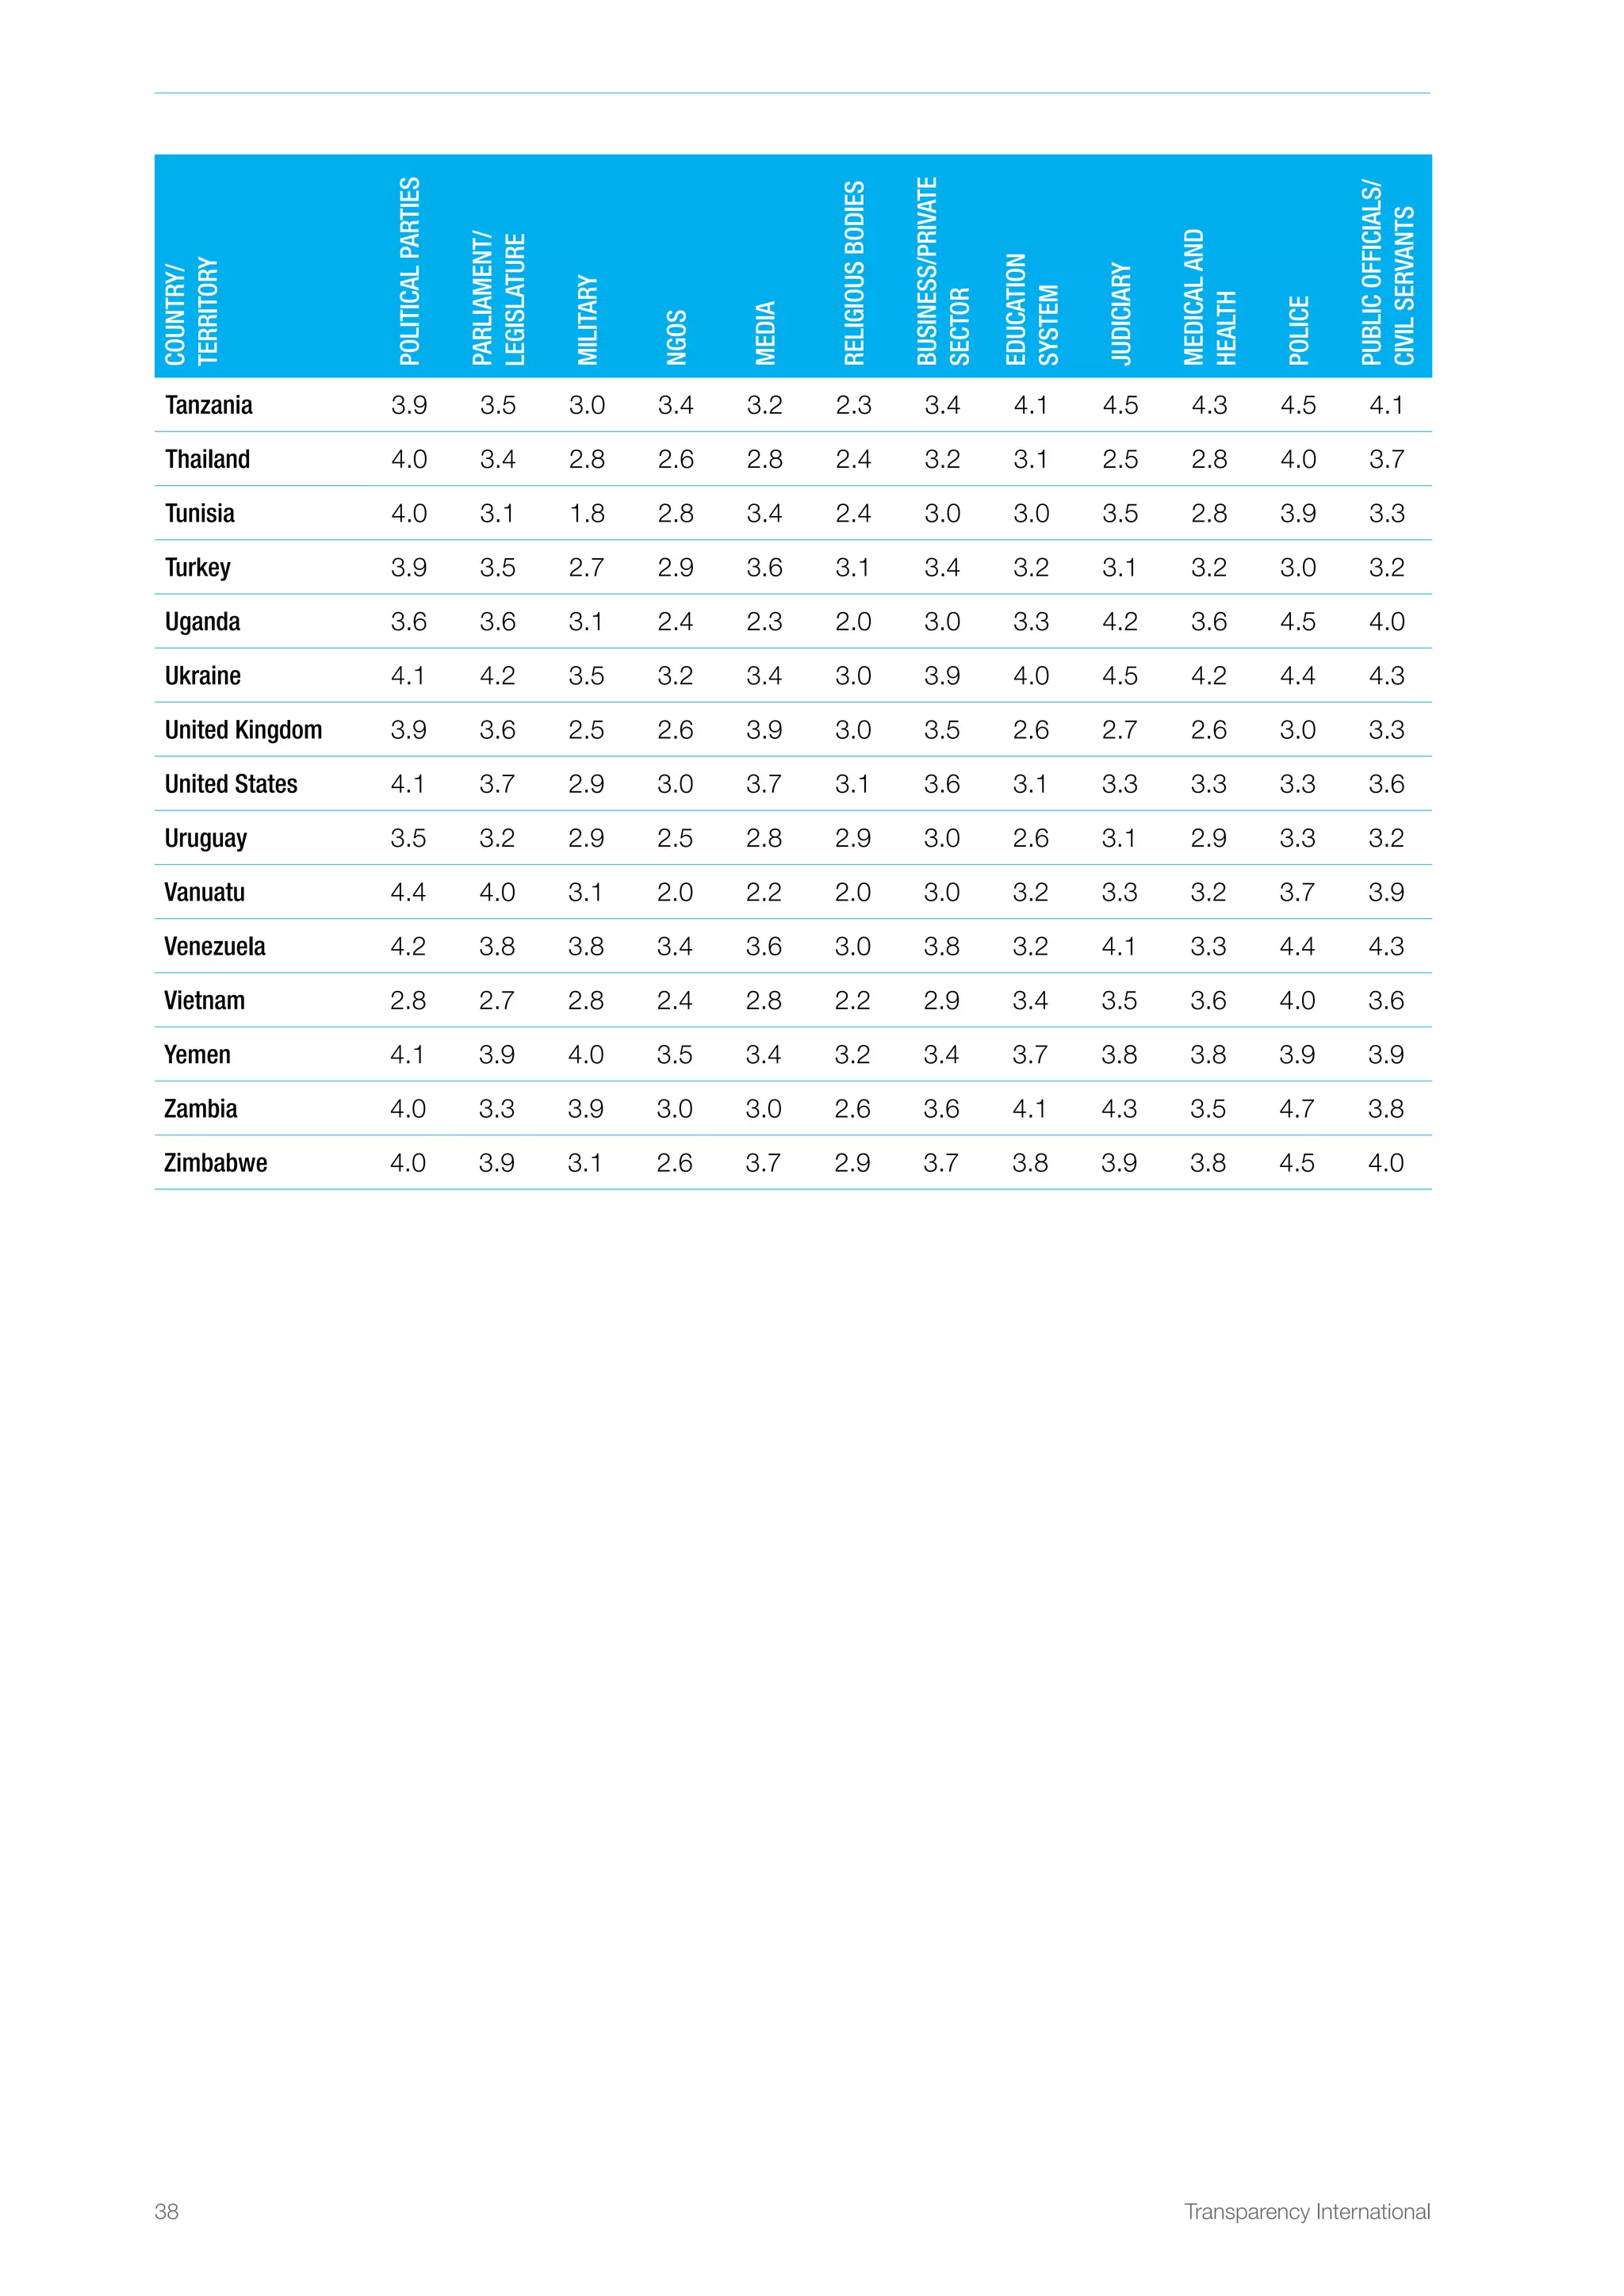

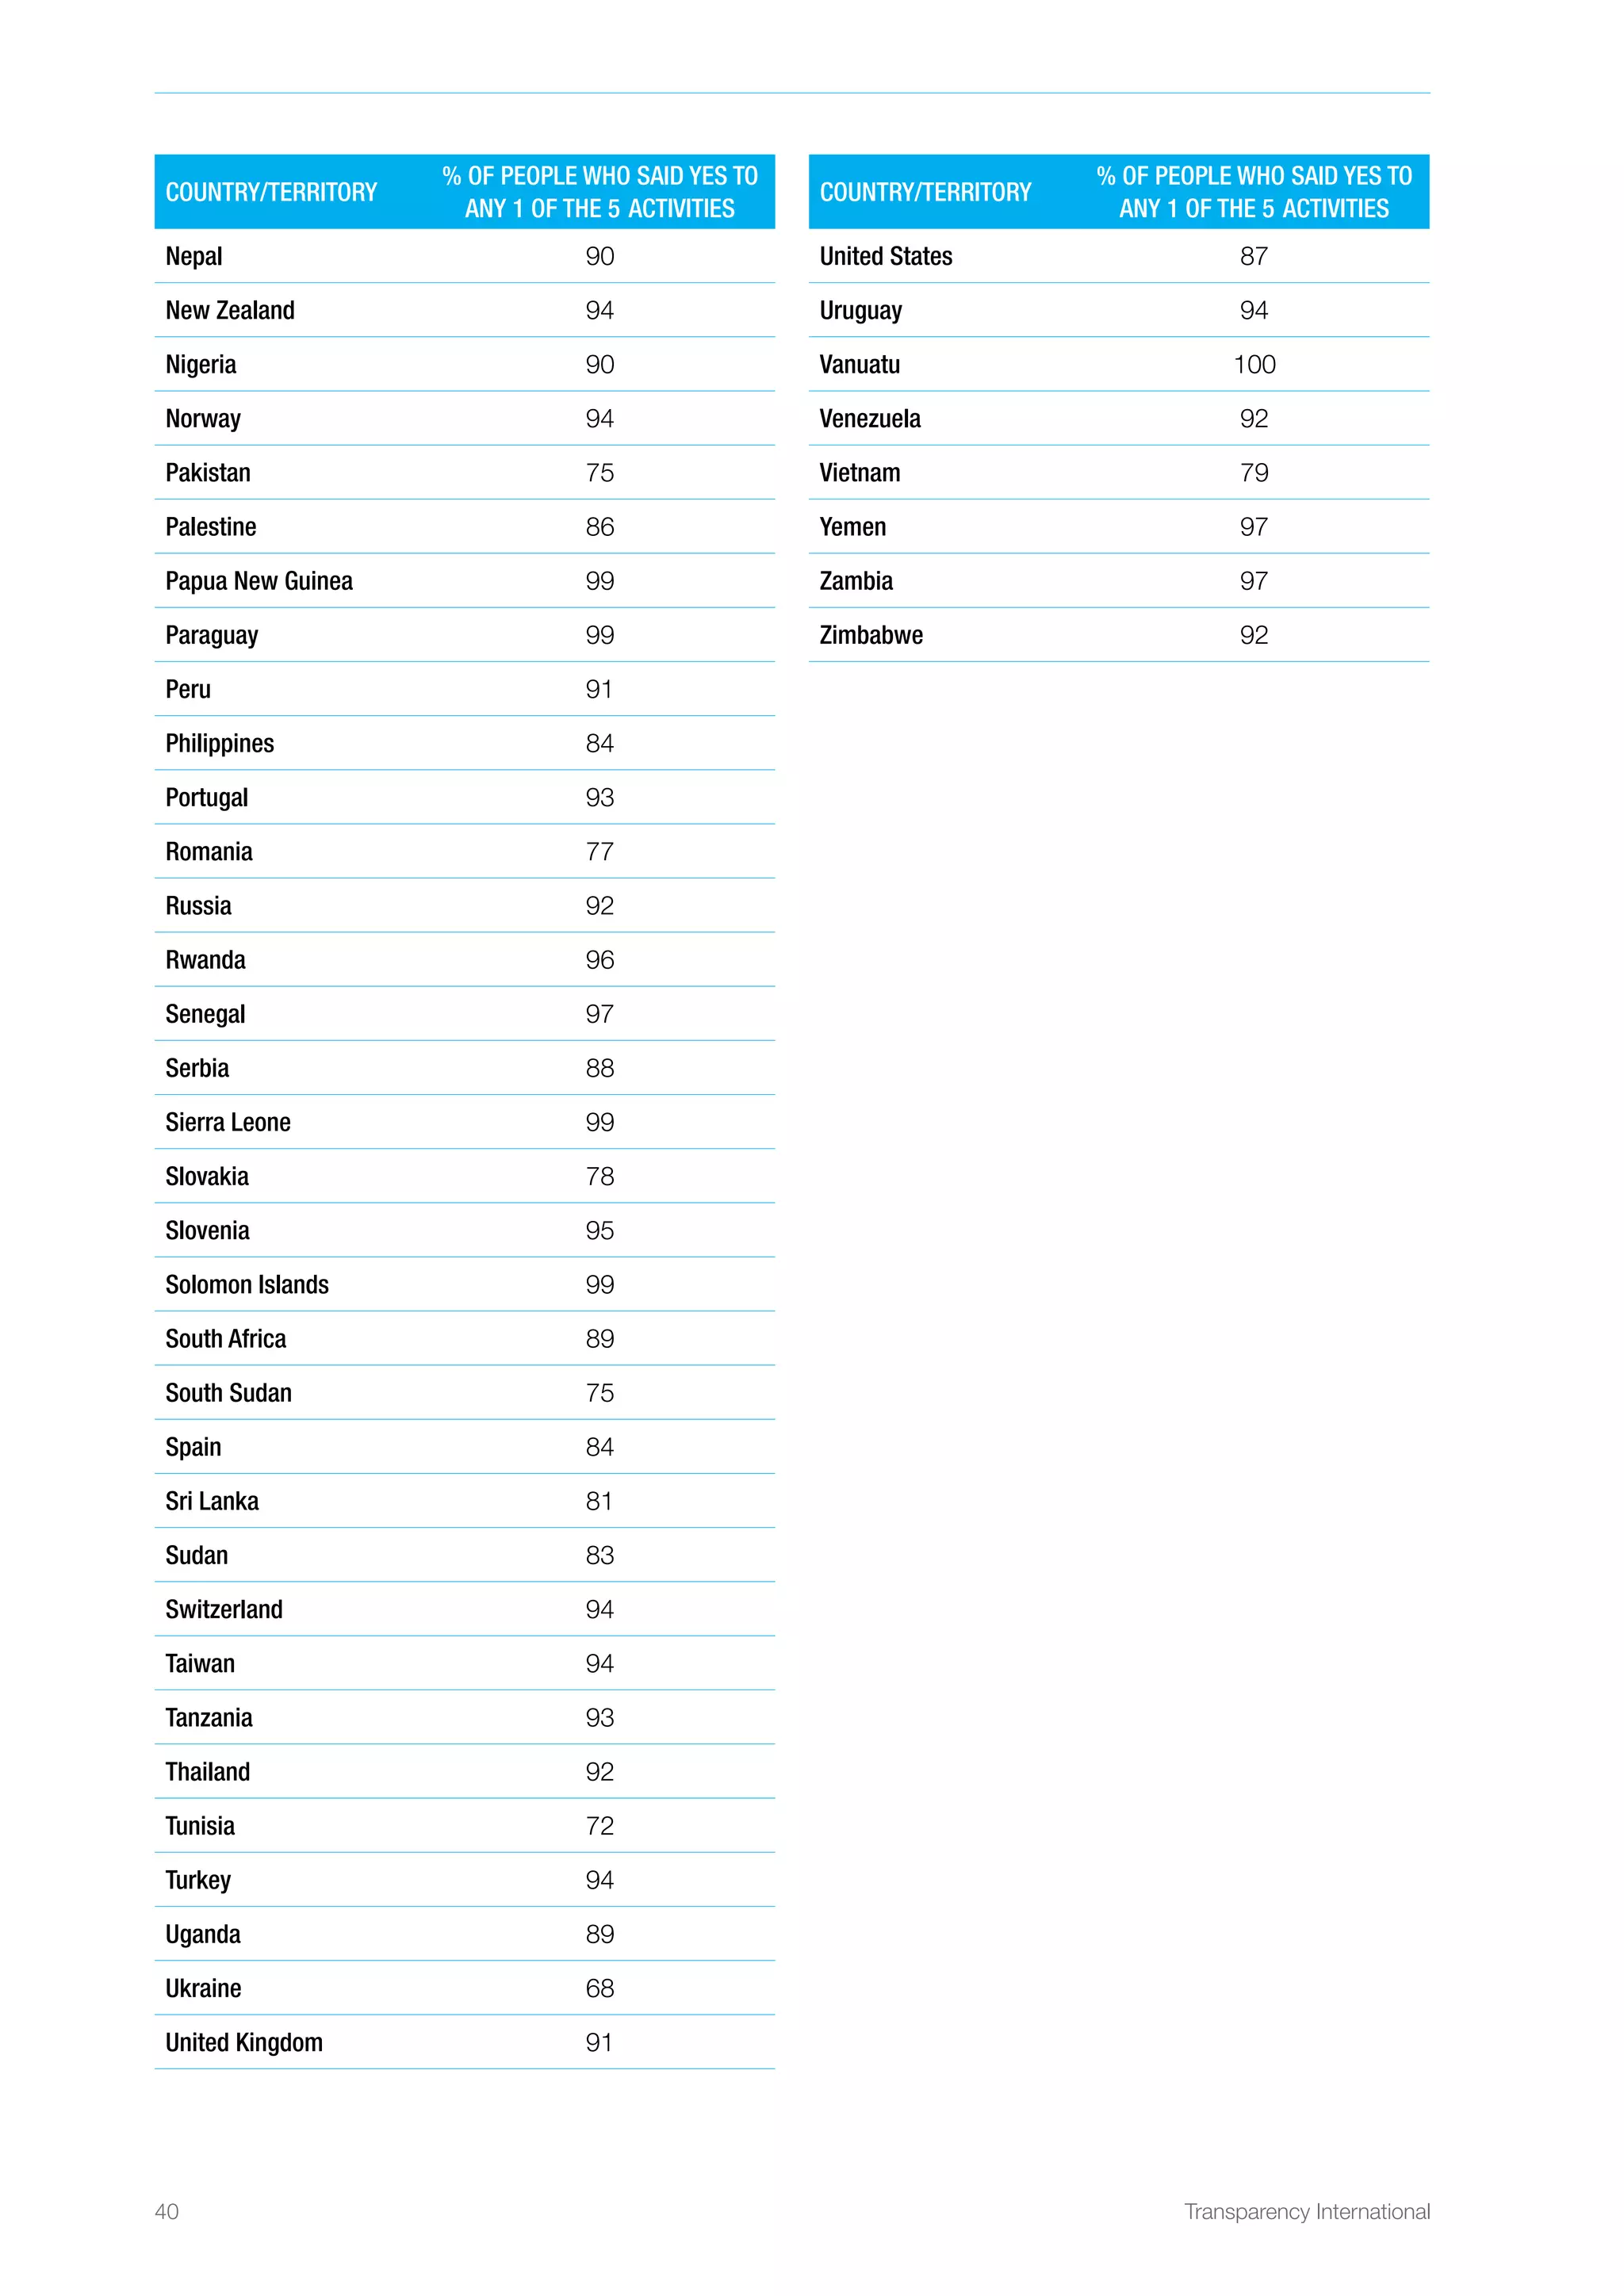


The Global Corruption Barometer 2013 by Transparency International highlights the widespread issue of corruption, revealing that over 27% of respondents globally have paid a bribe in the past year, particularly in public institutions like the police and judiciary. The report emphasizes a growing public awareness of corruption's detrimental effects and a strong willingness among citizens to combat it, with nearly 90% expressing readiness to take action. The document also outlines key findings and recommendations aimed at fostering integrity, accountability, and transparency in governance.


