
Download as PDF, PPTX

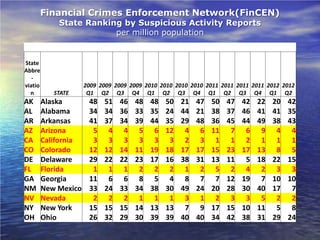
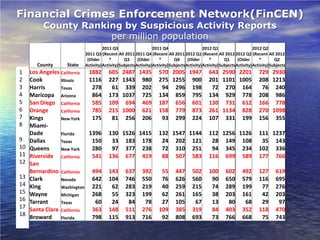
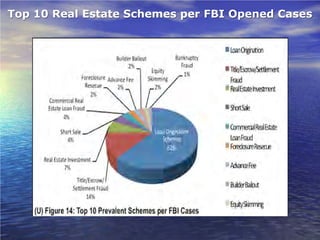
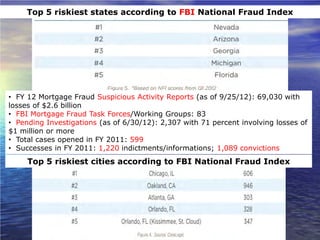
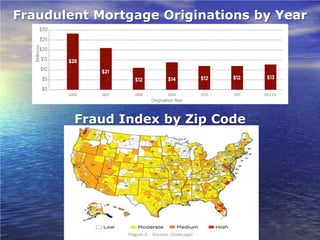
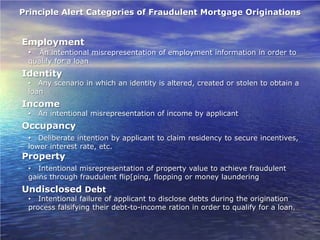
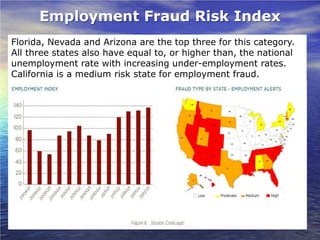
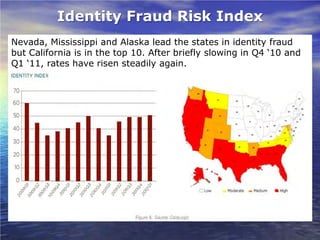
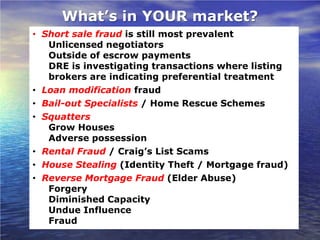
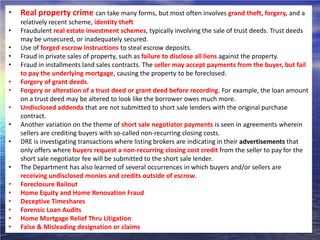

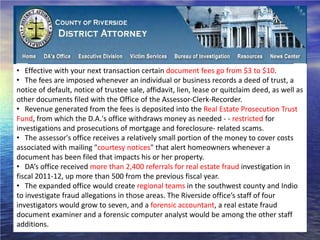
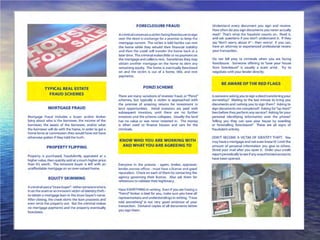
This document discusses various types of real estate and mortgage fraud seen across different states and markets. It provides data on suspicious activity reports and mortgage fraud cases for several states. It also outlines principal categories of fraudulent mortgage originations like employment, identity, income, and property fraud. Specific fraud risks are highlighted for employment, identity, income, and property fraud. Examples of common real estate fraud schemes are also described such as short sale flipping, foreclosure bailouts, and deceptive timeshares.


![[Smart Grid Market Research] 8-Day Hurricane Sandy Report- Zpryme Smart Grid ...](https://cdn.slidesharecdn.com/ss_thumbnails/specialreport8dayhurricanesandyreportnovember2012smartgridinsightszprymeresearch1-121126203744-phpapp02-thumbnail.jpg?width=640&height=640&fit=bounds)


