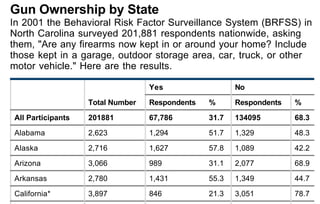
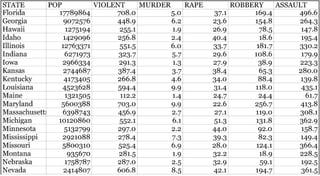
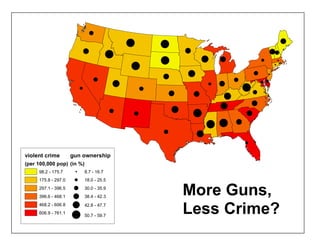
P rl l
                      aale
1                    C odn ts
                      o riae
c n p cu
 o s e ts            U ig
                      sn
                     Goa
                      eD


2           3         4
cs
 ae         dt
             aa       pe e t g
                       rs nin
e a ls
 x mpe      t n et
            r sc
             a        u ig
                       sn
                      P oo h p
                       h ts o
More Guns, Less Crime?

A debate between John Lott, author of More Guns, Less Crime, and Douglas Weil, research director of
Handgun Control, Inc. Transcript from July 1, 1998

Timehost: …John Lott of the University of Chicago, whose book More Guns, Less Crime argues that
allowing citizens to carry concealed weapons actually lowers crime rates. We are also joined by someone
who is in direct opposition to Mr. Lott's theory. He is Douglas Weil, director of research for Handgun
Control, Inc. and the Center To Prevent Handgun Violence. Mr. Lott, perhaps you could first outline what
your book has to say about concealed weapons. We've had a lot of questions about it already.

John Lott: I find that just as criminals can be deterred by higher arrest or conviction rates, they can also be
deterred by the fact that would-be victims might be able to defend themselves with a gun. Criminals are
less likely to commit a crime as the probability that a victim is going to be able to defend themselves
increases.

Douglas Weil First, there's no evidence that we have any significant increase in gun carrying, which means
criminals are not likely to face an increased risk of an armed victim. Most important, when Lott's research
was published, a number of academic researchers looked at this methods and his conclusions and
determined his research was fundamentally flawed. The criticism was so convincing that even Gary Kleck,
a criminologist whose work is often cited by John Lott and the NRA, has dismissed Lott's conclusions.
Kleck wrote in his book, Targeting Guns, that "more likely the declines in crime coinciding with relaxation of
carry laws were largely attributable to other factors not controlled for in the Lott Mustard analysis."
Gun Ownership by State
In 2001 the Behavioral Risk Factor Surveillance System (BRFSS) in
North Carolina surveyed 201,881 respondents nationwide, asking
them, "Are any firearms now kept in or around your home? Include
those kept in a garage, outdoor storage area, car, truck, or other
motor vehicle." Here are the results.

                                  Yes                  No

                   Total Number   Respondents   %      Respondents   %
All Participants   201881         67,786        31.7   134095        68.3

Alabama            2,623          1,294         51.7   1,329         48.3

Alaska             2,716          1,627         57.8   1,089         42.2
Arizona            3,066          989           31.1   2,077         68.9

Arkansas           2,780          1,431         55.3   1,349         44.7

California*        3,897          846           21.3   3,051         78.7
BJS Home Page          Data for Analysis    Data Online Crime Trends           State Level

State and national level crime trend estimates
   Source: FBI's Uniform Crime Reports                      Variables: UCR offenses (counts and rates)
          (UCR)                                                        Violent Crimes: murder and nonnegligent manslaughter,
                                                                       forcible rape, robbery, aggravated assault
   Years available: Since 1960                                         Property Crimes: burglary, larceny/theft, motor vehicle theft
                                                                       (See definitions)
Select a table type:

       State by State and                   OR         Trends in one variable               OR         One year of data
       national trends
                                                       - Multiple jurisdictions                        - Multiple jurisdictions
       > One jurisdiction
                                                        > One variable                                 - Multiple variables
       - Multiple variables
                                                       - Multiple years                                 > One year
       - Multiple years
                                                    Example:                                     Example:
    Example:
                                                    Robbery                                      Crime in   2003
    Reported crime in Alabama
                                                    Year   Alabama   Alaska   Arizona                                    Violent    Violent
                    Violent Violent                                                                         Population   crime      crime
                     crime  crime
                                                                                                      State coverage      total      rate
    Year Population   total  rate                   2001     5,584     514      8,868
                                                    2002     5,962     489      8,000
                                                                                                  Alabama 4,500,752        19,331      429.5
    2001 4,464,356     19,582    438.6              2003     6,038     444      7,619
                                                                                                  Alaska    648,818         3,850      593.4
    2002 4,478,896     19,931    445.0
                                                                                                  Arizona 5,580,811        28,638      513.2
    2003 4,500,752     19,331    429.5
Bivariate Scatterplot: Guns - Crime


   % gun
                    ?
   owner-
   ship

                  violent crimes /
                  100k pop.
violent crime        gun ownership
(per 100,000 pop) (in %)
     98.2 - 175.7          8.7 - 16.7


                                         More Guns,
     175.8 - 297.0         18.0 - 25.5
     297.1 - 396.5         30.0 - 35.9


                                         Less Crime?
     396.6 - 468.1         38.4 - 42.3
     468.2 - 606.8         42.8 - 47.7
     606.9 - 761.1
                           50.7 - 59.7
Parallel Coodinates for Guns and Crime Data

                                   % Gun
        Vars:
                                   ownership


                                   % H.S.
                                   grad. rate


                                   Violent crimes
                                   / 100k pop.
Atlanta Region Homicides
Homicides and selected socio-economic characteristics for counties surrounding Atlanta, GA
aggregated for three time periods: 1979-84 (steady decline in homicides), 1984-88 (stable p
1988-93 (steady increase in homicides).

S. Messner, L. Anselin, D. Hawkins, G. Deane, S. Tolnay, R. Baller (2000). An Atlas of the S
Patterning of County-Level Homicide, 1960-1990. Pittsburgh, PA, National Consortium on V
Research (NCOVR).


Variables

Variable        Description
NAME            county name
STATE_NAME state name
STATE_FIPS      state fips code (character)
CNTY_FIPS       county fips code (character)
FIPS            combined state and county fips code (character)
FIPSNO          fips code as numeric variable
HR7984          homicide rate per 100,000 (1979-84)
HR8488          homicide rate per 100,000 (1984-88)
HR8893          homicide rate per 100,000 (1988-93)
HC7984          homicide count (1979-84)
HC8488          homicide count (1984-88)
HC8893          homicide count (1988-93)
PO7984          population total (1979-84)
PO8488          population total (1984-88)
PO8893          population total (1988-93)
PE77            police expenditures per capita, 1977
PE82            police expenditures per capita, 1982
PE87            police expenditures per capita, 1987
RDAC80          resource deprivation/affluence composite variable, 1980
RDAC85          resource deprivation/affluence composite variable, 1985
RDAC90          resource deprivation/affluence composite variable, 1990
Parallel Coodinates for Georgia Homicide Data

                                   Resource
        Vars:
                                   deprivation


                                   Homicides
                                   / 100k pop.


                                   Police ex-
                                   pend. / cap.
Case examples credits (slide #, author/s, affiliation, source)

Slide 2, Yahoo Chat and Time.com, website
Slide 3, Washington Post, website
Slide 4, Bureau of Justice Statistics, U.S. Department of
Justice, web portal
Slide 8, Statemaster.com, web portal
Slide 15, Stephen Haas, Statistical Analysis Center /
WV Division of Criminal Justice, Powerpoint presentation
Slide 16, SAL, University of Illinois, web portal
Spatial Interaction of
Two Key Indicators of
Sustainability Among
Mäori of New Zealand

J. Kevin Byrne, July 20, 2007
Tables to be used as source matter:


Per capita ecological footprints and land productivity of New Zealand regions,
   1997/98
Ecological surplus/deficit and degree of overshoot of New Zealand regions,
   1997/98
   Source: Ecological Footprints of New Zealand and its Regions

Percentage of Regional Population Belonging to Mäori Ethnic Group, 2001
   Source: Statistics New Zealand

NZDE2001 Index of Deprivation, 2001
  Source: Department of Health, Wellington School of Medicine and Health
  Sciences
• Index purpose: resource allocation, research, advocacy.
• Variables in order of decreasing weight in index: income, employment,
  communication, transport, support, qualifications, living space, owned
  home.
• The index is an ordinal scale ranging from 1 to 10, where 1 represents the
  areas with least deprived scores and 10 with the most.
Idealized Process

Question: What is the relationship between eco-consumption,
   indigenous ethnicity, and social deprivation in New Zealand?
Thesis: Eco-consumption and indigenous ethnicity are
   negatively correlated, i.e. Mäori are low eco-consumers.
   One reason may be due to cultural roots of environmental
   conservation as inherent within Mäoritanga.
Research + data gathering: three tables required, collect and clean up in
   Excel
Analysis: Import into Geoda, and do parallel coordinate plotting,
   mapping and trivariate modeling in 3D
Synthesis - diagrams: parallel coordinate plots; maps: choropleth,
   cartogram, and possibly trivariate 3D maps
Confirm or disconfirm thesis
New question/s
Feedback
Reflect on learning
Idealized Process (concluded)


Findings Summarized:
• Lowest EF = Lowest % Mäori Ethnicity = Lowest
   Deprivation
• Moderate EF = Highest % Mäori Ethnicity = Highest
   Deprivation
• Regions of Gisborne and Nelson are situated at
   opposite ends of the three-variable PCP continuum
Confirm thesis: provisionally yes, but with interesting caveats
New questions: In what specific ways might Kiwi social
   deprivation constrain eco-conservation motivations
   and/or behavior? Does wine increase Marlborough’s EF? 
   Why is the Nelson Region comparatively so small in size?
Feedback: TBD, Reflections on learning: TBD
Recycling Patterns of 140 Households in Midland Hills Neighborhood, Roseville, November 24, 2007


                                             Roselawn Avenue


  Bins Counted
         3.0 - 3.5                                             Data Source: for parcels, Metropolitan Council;
         2.0 - 2.5                                             for bin counts, Kevin Byrne
         1.0 - 1.5
         0.0
Recycling Participation on 21xx-22xx Draper Avenue, Roseville, 4 sample weeks in 2007


                                       Draper Avenue


                                               Roselawn Avenue


    Bins Count
    (one month total)
                                                       Data Source: for parcels, Metropolitan Council;
            7.5 - 10.5                                 for bin counts, Kevin Byrne
            4.5 - 6.5
            2.0 - 4.0
            0.0 - 1.0
Kevin Byrne's Paracoords Using GeoDa Offered as a Software Workshop, 2008, Part 2: Case Examples

Kevin Byrne's Paracoords Using GeoDa Offered as a Software Workshop, 2008, Part 2: Case Examples

  • 1.
    P rl l aale 1 C odn ts o riae c n p cu o s e ts U ig sn Goa eD 2 3 4 cs ae dt aa pe e t g rs nin e a ls x mpe t n et r sc a u ig sn P oo h p h ts o
  • 2.
    More Guns, LessCrime? A debate between John Lott, author of More Guns, Less Crime, and Douglas Weil, research director of Handgun Control, Inc. Transcript from July 1, 1998 Timehost: …John Lott of the University of Chicago, whose book More Guns, Less Crime argues that allowing citizens to carry concealed weapons actually lowers crime rates. We are also joined by someone who is in direct opposition to Mr. Lott's theory. He is Douglas Weil, director of research for Handgun Control, Inc. and the Center To Prevent Handgun Violence. Mr. Lott, perhaps you could first outline what your book has to say about concealed weapons. We've had a lot of questions about it already. John Lott: I find that just as criminals can be deterred by higher arrest or conviction rates, they can also be deterred by the fact that would-be victims might be able to defend themselves with a gun. Criminals are less likely to commit a crime as the probability that a victim is going to be able to defend themselves increases. Douglas Weil First, there's no evidence that we have any significant increase in gun carrying, which means criminals are not likely to face an increased risk of an armed victim. Most important, when Lott's research was published, a number of academic researchers looked at this methods and his conclusions and determined his research was fundamentally flawed. The criticism was so convincing that even Gary Kleck, a criminologist whose work is often cited by John Lott and the NRA, has dismissed Lott's conclusions. Kleck wrote in his book, Targeting Guns, that "more likely the declines in crime coinciding with relaxation of carry laws were largely attributable to other factors not controlled for in the Lott Mustard analysis."
  • 3.
    Gun Ownership byState In 2001 the Behavioral Risk Factor Surveillance System (BRFSS) in North Carolina surveyed 201,881 respondents nationwide, asking them, "Are any firearms now kept in or around your home? Include those kept in a garage, outdoor storage area, car, truck, or other motor vehicle." Here are the results. Yes No Total Number Respondents % Respondents % All Participants 201881 67,786 31.7 134095 68.3 Alabama 2,623 1,294 51.7 1,329 48.3 Alaska 2,716 1,627 57.8 1,089 42.2 Arizona 3,066 989 31.1 2,077 68.9 Arkansas 2,780 1,431 55.3 1,349 44.7 California* 3,897 846 21.3 3,051 78.7
  • 4.
    BJS Home Page Data for Analysis Data Online Crime Trends State Level State and national level crime trend estimates Source: FBI's Uniform Crime Reports Variables: UCR offenses (counts and rates) (UCR) Violent Crimes: murder and nonnegligent manslaughter, forcible rape, robbery, aggravated assault Years available: Since 1960 Property Crimes: burglary, larceny/theft, motor vehicle theft (See definitions) Select a table type: State by State and OR Trends in one variable OR One year of data national trends - Multiple jurisdictions - Multiple jurisdictions > One jurisdiction > One variable - Multiple variables - Multiple variables - Multiple years > One year - Multiple years Example: Example: Example: Robbery Crime in 2003 Reported crime in Alabama Year Alabama Alaska Arizona Violent Violent Violent Violent Population crime crime crime crime State coverage total rate Year Population total rate 2001 5,584 514 8,868 2002 5,962 489 8,000 Alabama 4,500,752 19,331 429.5 2001 4,464,356 19,582 438.6 2003 6,038 444 7,619 Alaska 648,818 3,850 593.4 2002 4,478,896 19,931 445.0 Arizona 5,580,811 28,638 513.2 2003 4,500,752 19,331 429.5
  • 6.
    Bivariate Scatterplot: Guns- Crime % gun ? owner- ship violent crimes / 100k pop.
  • 7.
    violent crime gun ownership (per 100,000 pop) (in %) 98.2 - 175.7 8.7 - 16.7 More Guns, 175.8 - 297.0 18.0 - 25.5 297.1 - 396.5 30.0 - 35.9 Less Crime? 396.6 - 468.1 38.4 - 42.3 468.2 - 606.8 42.8 - 47.7 606.9 - 761.1 50.7 - 59.7
  • 9.
    Parallel Coodinates forGuns and Crime Data % Gun Vars: ownership % H.S. grad. rate Violent crimes / 100k pop.
  • 17.
    Atlanta Region Homicides Homicidesand selected socio-economic characteristics for counties surrounding Atlanta, GA aggregated for three time periods: 1979-84 (steady decline in homicides), 1984-88 (stable p 1988-93 (steady increase in homicides). S. Messner, L. Anselin, D. Hawkins, G. Deane, S. Tolnay, R. Baller (2000). An Atlas of the S Patterning of County-Level Homicide, 1960-1990. Pittsburgh, PA, National Consortium on V Research (NCOVR). Variables Variable Description NAME county name STATE_NAME state name STATE_FIPS state fips code (character) CNTY_FIPS county fips code (character) FIPS combined state and county fips code (character) FIPSNO fips code as numeric variable HR7984 homicide rate per 100,000 (1979-84) HR8488 homicide rate per 100,000 (1984-88) HR8893 homicide rate per 100,000 (1988-93) HC7984 homicide count (1979-84) HC8488 homicide count (1984-88) HC8893 homicide count (1988-93) PO7984 population total (1979-84) PO8488 population total (1984-88) PO8893 population total (1988-93) PE77 police expenditures per capita, 1977 PE82 police expenditures per capita, 1982 PE87 police expenditures per capita, 1987 RDAC80 resource deprivation/affluence composite variable, 1980 RDAC85 resource deprivation/affluence composite variable, 1985 RDAC90 resource deprivation/affluence composite variable, 1990
  • 18.
    Parallel Coodinates forGeorgia Homicide Data Resource Vars: deprivation Homicides / 100k pop. Police ex- pend. / cap.
  • 26.
    Case examples credits(slide #, author/s, affiliation, source) Slide 2, Yahoo Chat and Time.com, website Slide 3, Washington Post, website Slide 4, Bureau of Justice Statistics, U.S. Department of Justice, web portal Slide 8, Statemaster.com, web portal Slide 15, Stephen Haas, Statistical Analysis Center / WV Division of Criminal Justice, Powerpoint presentation Slide 16, SAL, University of Illinois, web portal
  • 27.
    Spatial Interaction of TwoKey Indicators of Sustainability Among Mäori of New Zealand J. Kevin Byrne, July 20, 2007
  • 28.
    Tables to beused as source matter: Per capita ecological footprints and land productivity of New Zealand regions, 1997/98 Ecological surplus/deficit and degree of overshoot of New Zealand regions, 1997/98 Source: Ecological Footprints of New Zealand and its Regions Percentage of Regional Population Belonging to Mäori Ethnic Group, 2001 Source: Statistics New Zealand NZDE2001 Index of Deprivation, 2001 Source: Department of Health, Wellington School of Medicine and Health Sciences • Index purpose: resource allocation, research, advocacy. • Variables in order of decreasing weight in index: income, employment, communication, transport, support, qualifications, living space, owned home. • The index is an ordinal scale ranging from 1 to 10, where 1 represents the areas with least deprived scores and 10 with the most.
  • 35.
    Idealized Process Question: Whatis the relationship between eco-consumption, indigenous ethnicity, and social deprivation in New Zealand? Thesis: Eco-consumption and indigenous ethnicity are negatively correlated, i.e. Mäori are low eco-consumers. One reason may be due to cultural roots of environmental conservation as inherent within Mäoritanga. Research + data gathering: three tables required, collect and clean up in Excel Analysis: Import into Geoda, and do parallel coordinate plotting, mapping and trivariate modeling in 3D Synthesis - diagrams: parallel coordinate plots; maps: choropleth, cartogram, and possibly trivariate 3D maps Confirm or disconfirm thesis New question/s Feedback Reflect on learning
  • 36.
    Idealized Process (concluded) FindingsSummarized: • Lowest EF = Lowest % Mäori Ethnicity = Lowest Deprivation • Moderate EF = Highest % Mäori Ethnicity = Highest Deprivation • Regions of Gisborne and Nelson are situated at opposite ends of the three-variable PCP continuum Confirm thesis: provisionally yes, but with interesting caveats New questions: In what specific ways might Kiwi social deprivation constrain eco-conservation motivations and/or behavior? Does wine increase Marlborough’s EF?  Why is the Nelson Region comparatively so small in size? Feedback: TBD, Reflections on learning: TBD
  • 38.
    Recycling Patterns of140 Households in Midland Hills Neighborhood, Roseville, November 24, 2007 Roselawn Avenue Bins Counted 3.0 - 3.5 Data Source: for parcels, Metropolitan Council; 2.0 - 2.5 for bin counts, Kevin Byrne 1.0 - 1.5 0.0
  • 40.
    Recycling Participation on21xx-22xx Draper Avenue, Roseville, 4 sample weeks in 2007 Draper Avenue Roselawn Avenue Bins Count (one month total) Data Source: for parcels, Metropolitan Council; 7.5 - 10.5 for bin counts, Kevin Byrne 4.5 - 6.5 2.0 - 4.0 0.0 - 1.0