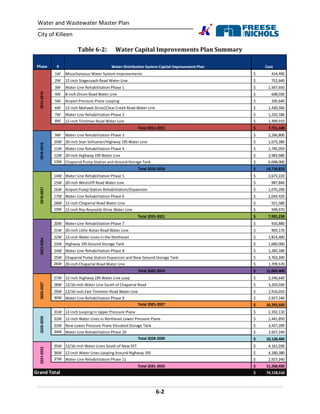
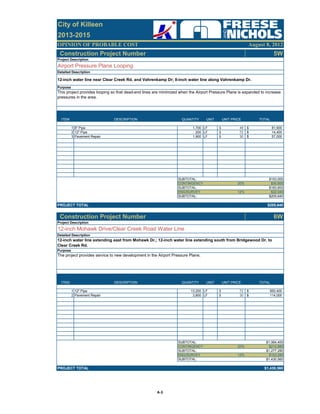
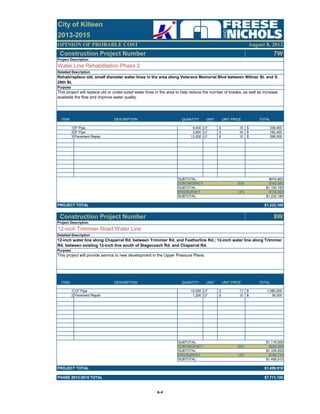
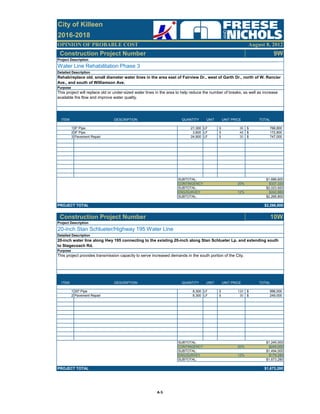
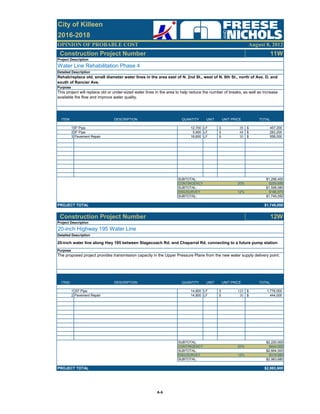
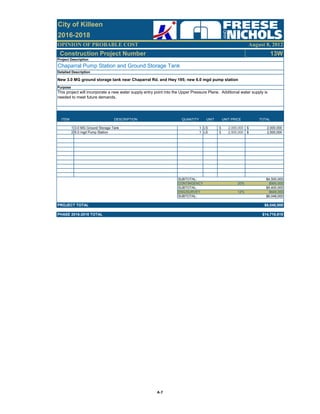
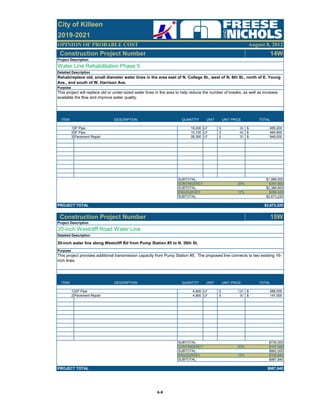
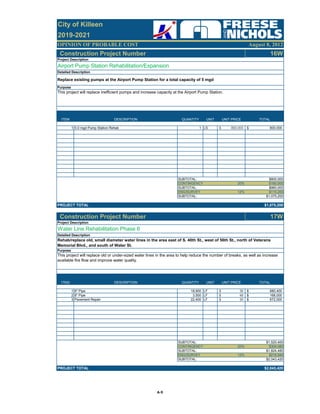
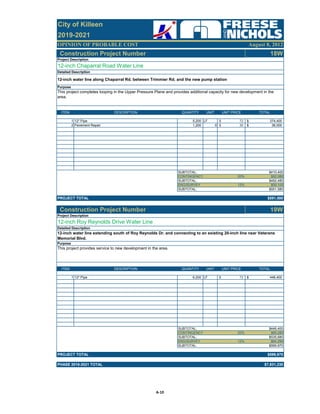
This document is a water and wastewater master plan prepared by Freese and Nichols, Inc. for the City of Killeen. It includes analyses of the existing water distribution and wastewater collection systems to identify deficiencies, projects population growth through 2032, and develops a capital improvement plan to accommodate growth and renew aging infrastructure for both systems over a 20-year period. Key recommendations include increasing water supply capacity, expanding transmission mains, adding elevated storage, and extending services to new growth areas for the water system, and rehabilitating sewer lines and upgrading lift stations for the wastewater system. The total estimated cost for improvements to the water system is $30,359,140 and for the wast
The document is a final report from Kerr Wood Leidal Associates Ltd. to the City of Grand Forks summarizing utilities capital planning. It contains sections on the existing sanitary system, potable water system, stormwater system, road infrastructure, a multi-utility upgrading strategy, capital plan, and conclusions and recommendations. Figures and tables in the report provide information on aspects of each system such as the existing infrastructure, capital projects, unit rates, and upgrading priorities.
This document proposes the CycleSafe Network (CSN), a connected system of cycling, walking and shared paths across Newcastle and Lake Macquarie, Australia. The CSN would connect existing paths and add 140km of new infrastructure to encourage active transport. It would be developed over three phases from 2016-2024 for $164 million total. A cost-benefit analysis estimates annual benefits ranging from $9-306 million depending on usage scenarios, recovering the cost within 1-18 years. Implementation of the CSN is supported by government policies and would provide health, environmental, education and economic benefits for the region. Future research is needed to better evaluate active transport infrastructure investments in Australia.
GHACCO organized several activities from June 2015 to April 2016, as outlined in their technical report. This included recruiting staff, holding elections for regional steering committees, hosting the Global Clean Cooking Forum 2015, participating in capacity building workshops, and undertaking various awareness campaigns and collaborations. Some of the key events were recruiting a National Coordinator and Program Officer, electing regional steering committees in Ashanti, Greater Accra, and Volta regions, and successfully hosting the Global Clean Cooking Forum 2015 in Accra, which brought together over 500 participants. GHACCO also engaged in various capacity building initiatives for members and stakeholders in the clean cooking sector.
This document provides guidance on California's Disaster Service Worker Volunteer Program (DSWVP). It summarizes the program's history and origins during World War II when volunteers were needed for disaster response but lacked workers' compensation protections. The War Powers Act of 1943 addressed this by allowing volunteer registration with accredited disaster councils, providing coverage. Today, registered volunteers and impressed citizens receive liability protections and compensation through the DSWVP if injured during assigned duties. The guidance defines key terms like disaster service, convergent volunteers, and accredited disaster councils. It explains registration, training, and claims procedures to administer the program and support volunteers.
This document provides a summary of Nicholas P. Antonio's 25 years of experience in project management roles across various refineries and industrial sites. His responsibilities included scheduling, planning, estimating, cost control, and overseeing the execution of mechanical and piping projects. He has strong skills in communication, computer programs like Primavera and AutoCAD, and ensuring projects are completed on time and on budget. His current role is as a TA Planner at Braskem where he utilizes SAP and SharePoint to manage turnaround projects.
RS-16-154 Nolan Creek Flood Protection PlanCityofKilleen
The document discusses a Nolan Creek Flood Protection Plan grant opportunity through the Texas Water Development Board. The plan would coordinate additional monitoring stations along Nolan Creek and its tributaries, develop early warning software, and update flood hazard maps. It would position entities in the watershed to apply for other grants to fund flood mitigation projects that could increase storage capacity and water quality. The plan has regional support from Bell County WCID #6, Belton, Brazos River Authority, Harker Heights, Nolanville, and Killeen. The total cost is $462,038 with the City of Killeen's identified portion being $146,599, requiring $54,227.67 in cash and $92
A Guide to SlideShare Analytics - Excerpts from Hubspot's Step by Step Guide ...SlideShare
This document provides a summary of the analytics available through SlideShare for monitoring the performance of presentations. It outlines the key metrics that can be viewed such as total views, actions, and traffic sources over different time periods. The analytics help users identify topics and presentation styles that resonate best with audiences based on view and engagement numbers. They also allow users to calculate important metrics like view-to-contact conversion rates. Regular review of the analytics insights helps users improve future presentations and marketing strategies.
This document provides a rapid assessment of hydropower potential in Gilgit-Baltistan (GB), Pakistan. It summarizes GB's significant water resources, including numerous glacial fed rivers and tributaries of the Indus River. Over 236 perennial streams flow into the Indus and its tributaries in GB. The document identifies GB's existing and under construction hydropower plants. It also analyzes GB's hydropower potential, population growth, and future power demand. Finally, it outlines investment opportunities for private sector run-of-river hydropower projects in GB and provides recommendations for an enabling energy policy to attract investment and promote sustainable development.
This document provides a rapid assessment of hydropower potential and investment opportunities in Gilgit-Baltistan, Pakistan. It finds that Gilgit-Baltistan has tremendous potential to generate renewable energy from hydro and solar sources due to its unique mountain ecology and location along the Indus River. Specifically, the document identifies hundreds of potential small to medium hydropower project sites that could be developed by the private sector. These smaller projects are seen as more strategically attractive than large dams due to lower costs and complexity, as well as falling under provincial versus national authority. The assessment provides data on Gilgit-Baltistan's hydropower resources, existing and planned power projects, power demand forecasts, and recommendations to realize the region's potential
The document provides a summary of socio-economic and environmental data for Pakistan across multiple sectors. It includes 3 sections:
Section A provides data on demographics, housing, labor, agriculture, water, livestock, forestry and transportation. Section B discusses environmental impacts of activities in these sectors such as human settlements, population growth, wastewater, and air pollution. Section C covers responses to these impacts like climate patterns. Section D includes inventories, stocks, and background data on education, health, family planning and more. The document aims to compile relevant statistics from secondary sources to help assess environmental problems and support sustainable development planning.
PROPOSITION 1 STORM WATER GRANT PROGRAM GUIDELIN.docxShiraPrater50
PROPOSITION 1
STORM WATER GRANT PROGRAM
GUIDELINES
Public Review Draft
August 2015
Proposition 1 Storm Water Grant Program
PUBLIC REVIEW DRAFT ii August 2015
This Page Intentionally Left Blank
To Allow for Double-sided Printing
Proposition 1 Storm Water Grant Program
PUBLIC REVIEW DRAFT iii August 2015
TABLE OF CONTENTS
TOPIC Page #
I. PURPOSE...................................................................................................................................... 1
II. OVERVIEW .................................................................................................................................... 1
A. SOLICITATIONS ............................................................................................................................ 2
I. Planning Grants ....................................................................................................................... 2
II. Implementation Grants............................................................................................................ 2
III. ELIGIBILITY REQUIREMENTS ..................................................................................................... 3
A. ELIGIBLE APPLICANTS ................................................................................................................ 3
B. ELIGIBLE PROJECT TYPES ......................................................................................................... 3
I. Planning Grants ....................................................................................................................... 3
II. Implementation Grants............................................................................................................ 4
C. GRANT AMOUNT .......................................................................................................................... 5
D. MATCH REQUIREMENT ............................................................................................................... 5
I. Disadvantaged and Economically Distressed Areas Funding Match Reduction ................ 5
E. SCHEDULE .................................................................................................................................... 6
F. EDUCATION AND OUTREACH ..................................................................................................... 6
G. PROGRAM PREFERENCES ......................................................................................................... 7
IV. PROJECT SELECTION PROCESS ............................................................................................... 7
A. APPLICANT ASSISTANCE WORKSHOPS .................................................................................... 7
B. SOLICITATION AND SUBMITTAL OF PROPOSALS ................................................................... ...
PROPOSITION 1 STORM WATER GRANT PROGRAM GUIDELIN.docxpoulterbarbara
PROPOSITION 1
STORM WATER GRANT PROGRAM
GUIDELINES
Public Review Draft
August 2015
Proposition 1 Storm Water Grant Program
PUBLIC REVIEW DRAFT ii August 2015
This Page Intentionally Left Blank
To Allow for Double-sided Printing
Proposition 1 Storm Water Grant Program
PUBLIC REVIEW DRAFT iii August 2015
TABLE OF CONTENTS
TOPIC Page #
I. PURPOSE...................................................................................................................................... 1
II. OVERVIEW .................................................................................................................................... 1
A. SOLICITATIONS ............................................................................................................................ 2
I. Planning Grants ....................................................................................................................... 2
II. Implementation Grants............................................................................................................ 2
III. ELIGIBILITY REQUIREMENTS ..................................................................................................... 3
A. ELIGIBLE APPLICANTS ................................................................................................................ 3
B. ELIGIBLE PROJECT TYPES ......................................................................................................... 3
I. Planning Grants ....................................................................................................................... 3
II. Implementation Grants............................................................................................................ 4
C. GRANT AMOUNT .......................................................................................................................... 5
D. MATCH REQUIREMENT ............................................................................................................... 5
I. Disadvantaged and Economically Distressed Areas Funding Match Reduction ................ 5
E. SCHEDULE .................................................................................................................................... 6
F. EDUCATION AND OUTREACH ..................................................................................................... 6
G. PROGRAM PREFERENCES ......................................................................................................... 7
IV. PROJECT SELECTION PROCESS ............................................................................................... 7
A. APPLICANT ASSISTANCE WORKSHOPS .................................................................................... 7
B. SOLICITATION AND SUBMITTAL OF PROPOSALS ....................................................................
This report identifies potential hydro power sites in County Kilkenny and provides guidance on developing hydro projects. It was commissioned by Kilkenny LEADER Partnership. Twenty-seven sites were assessed for their power generation potential. Sites with capacities from 11-50kW and <11kW were identified as good candidates for development. The report also provides an overview of the development process, including feasibility studies, permitting, environmental assessments, grid connection and revenue options. Its aim is to help landowners and communities develop local hydro power and support rural development in Kilkenny.
This draft wastewater facilities plan by Carollo Engineers summarizes the existing wastewater system for the City of Oak Harbor and evaluates alternatives to address the city's future needs. The plan identifies expanding population growth as driving the need for increased treatment capacity. Two potential sites, Windjammer Vicinity and Crescent Harbor North, are evaluated in detail as locations for a new membrane bioreactor wastewater treatment plant. The recommended alternative includes a new 7.5 million gallon per day plant in Phase 1 to be located at Crescent Harbor North along with conveyance system upgrades.
The document is a long range transportation plan for the KACTS region from 2010-2035. It provides an introduction to the KACTS region and membership, the planning process, and federal and state requirements. It also summarizes existing transportation characteristics and trends in the region related to roadways, bridges, public transit, freight, and socioeconomic factors. The plan is required to maintain federal transportation funding and address transportation needs and funding over the planning period.
The document provides a greenhouse gas inventory for the City of Beaverton's internal operations from 2008-2013. It finds that in 2013, emissions totaled 25,185 metric tons of CO2 equivalent. This is a 13% reduction from 2008 levels, putting Beaverton on track to meet its goal of a 20% reduction by 2020. Emissions increased for refrigerants, business travel, and fossil fuels used in vehicles. Emissions decreased for biofuels used in vehicles, natural gas, electricity, commuting, and solid waste. The inventory analyzed scopes 1, 2, and 3 emissions and provides details on methodology and emissions sources.
It's not just about Alberta: Oilsands generate thousands of jobs, billions in...Ports-To-Plains Blog
This report provides strategic insights by examining the impacts the oil sands industry has made on North American economies and how the industry will likely develop into the future. Two themes are central to the report: impact on Canadian provincial and national economies, and the oil sands’ ripple effects on US state and federal economies.
This document describes the development of automated workflows for analyzing well permit applications in Weber County and Northern Utah County, Utah. ArcGIS and Arc Hydro Groundwater were used to create workflows that add proposed wells to a MODFLOW groundwater model, run the model, and import the results. The Northern Utah County workflow analyzes impacts to springs and allows for drawdown limits. The Weber County workflow was adapted for its permitting criteria and model characteristics. The workflows are intended to streamline the permitting process and reduce the time required for analysis.
This document is the introductory letter to the Upper Occoquan Service Authority's (UOSA) Comprehensive Annual Financial Report for fiscal year 2014. It introduces UOSA as the regional water authority formed in 1971 to protect the Occoquan Reservoir, which provides drinking water to over 2 million people. It notes that UOSA operates one of the largest water reclamation facilities in the country and is committed to environmental stewardship. The letter also indicates that management is responsible for the accuracy and completeness of the financial data presented in the report.
The document is the May/June 2005 issue of Building Australia magazine. It contains several articles about recent government budgets that include funding for infrastructure, skills training programs, and housing initiatives. The federal budget commits to expanding apprenticeships and skilled migration. State budgets provide funding for projects outlined in their strategic plans such as Melbourne 2030. The budgets aim to address skills shortages and support the building and construction industry.
This document provides an outline for a study that aims to use GIS to locate potential new solid waste landfill sites in the Nelson Mandela Bay Municipality in South Africa. The study will involve a literature review on solid waste management issues and how GIS has been used to address siting problems. A methodology will be developed using GIS-based suitability analysis and a questionnaire to stakeholders. Potential sites will be identified and analyzed based on exclusion and non-exclusion criteria. The results will provide recommendations for new landfill sites and contribute to improving solid waste management in the municipality.
This document discusses how rural communities in Kenya can develop sustainable water supplies with assistance from the Water Services Trust Fund. It describes six water projects built by Danish International Development Agency (DANIDA) in partnership with local communities between 2003-2006. The projects trained community members to construct and maintain infrastructure like intakes, dams, and kiosks to provide local water access. Communities contributed labor and materials to lower costs. Ongoing training on financial management, record keeping, and maintenance aims to ensure communities independently operate and maintain their water systems over the long term.
This document discusses how rural communities in Kenya can develop sustainable water supplies with assistance from the Water Services Trust Fund. It describes six water projects built by Danish International Development Agency (DANIDA) in partnership with local communities between 2003-2006. The projects trained community members to construct and maintain infrastructure like intakes, dams, and kiosks to provide access to water. Communities contributed labor and materials to reduce costs. Ongoing support included training managers in financial planning, record keeping, and operating projects as businesses to ensure long-term sustainability.
Kenya; Water for Rural Communities: How Kenyan Rural Communities Can Create...V9X
The document discusses preparations for constructing rural water projects and training communities in Kenya. It emphasizes the importance of gender equality, highlighting that women play a major role in water collection and management. Six water projects were implemented with assistance from the communities. Over 120 committee members and 113 local builders were trained to support project construction and long-term management. The training focused on community organization, financial management, and developing local skills to promote self-employment and economic development in the rural areas.
This document provides guidelines for energy efficient building design. It covers lighting, electric power and distribution, building envelope, air conditioning systems, and boiler and hot water systems. For lighting, it recommends efficient lamp types and design approaches to reduce energy use. It sets maximum power density limits for interior and exterior lighting. For other building systems, it provides requirements for equipment efficiency and design criteria to improve energy performance. The guidelines aim to reduce building energy use while maintaining occupant comfort.
This document provides an overview and extracts from the main AD Deployment in the UK report which is available from NNFCC.
NNFCC has published the definitive report on Anaerobic Digestion Deployment in the UK. The report provides a comprehensive regional breakdown of sector development in Scotland, Wales, Northern Ireland and the 10 regions of England, providing detailed information on feedstock requirements, installed capacity and output type (combined heat & power or biomethane-to grid) for every project.There are over 130 operational AD plants in the UK outside of the sewage treatment sector, with more than 340 projects currently under development. NNFCC has now published the definitive report on Anaerobic Digestion Deployment in the UK. The report provides a comprehensive regional breakdown of sector development in Scotland, Wales, Northern Ireland and the 10 regions of England, giving detailed information on feedstock requirements, installed capacity and output type (combined heat & power or biomethane-to grid) for every project.
http://www.nnfcc.co.uk/bioenergy/ad-deployment-report
Results from the study identified areas across Summit County sensitive to ground water. Using this information, Environmental Health staff can ensure septic systems are appropriately suited to the area where they are installed, ultimately increasing the life of the system and its ability to protect the environment. The end goal is to prevent future septic system failure due to growth and protect overall water quality throughout the county.
Sampling was done in both Snyderville Basin and parts of Eastern Summit County to determine sensitive areas optimal for sewer or septic upgrades. Water samples were taken during peak runoff (spring) and baseflow conditions (summer) to test for Escherichia coli (E. coli), nitrates, general bacteria and human-associated bacteria.
The document discusses rules and protocols for council membership on committees. It outlines that the mayor appoints members to council committees, subject to council consent. It describes how the council can create other boards and committees to assist city operations. It defines different types of committee members, including regular members, ex officio members, and honorary members, and their roles and voting privileges. It also provides guidelines for declaring a position vacant due to excessive absences from committee meetings.
The document summarizes the sale of a 0.505 acre lot located on the corner of Camilla Road and Buckley Avenue. The lot is zoned residential and surrounded by other residential uses. It is fenced and may contain an abandoned underground water pipe. The city mows the property but it is no longer needed for city purposes. The city council agreed to a competitive bidding process for sale with a minimum bid of $5,000. One bid was received for the property. Staff recommends approving the sale to the highest bidder to return the land to the tax roll and reduce maintenance duties.
This document provides a rapid assessment of hydropower potential and investment opportunities in Gilgit-Baltistan, Pakistan. It finds that Gilgit-Baltistan has tremendous potential to generate renewable energy from hydro and solar sources due to its unique mountain ecology and location along the Indus River. Specifically, the document identifies hundreds of potential small to medium hydropower project sites that could be developed by the private sector. These smaller projects are seen as more strategically attractive than large dams due to lower costs and complexity, as well as falling under provincial versus national authority. The assessment provides data on Gilgit-Baltistan's hydropower resources, existing and planned power projects, power demand forecasts, and recommendations to realize the region's potential
The document provides a summary of socio-economic and environmental data for Pakistan across multiple sectors. It includes 3 sections:
Section A provides data on demographics, housing, labor, agriculture, water, livestock, forestry and transportation. Section B discusses environmental impacts of activities in these sectors such as human settlements, population growth, wastewater, and air pollution. Section C covers responses to these impacts like climate patterns. Section D includes inventories, stocks, and background data on education, health, family planning and more. The document aims to compile relevant statistics from secondary sources to help assess environmental problems and support sustainable development planning.
PROPOSITION 1 STORM WATER GRANT PROGRAM GUIDELIN.docxShiraPrater50
PROPOSITION 1
STORM WATER GRANT PROGRAM
GUIDELINES
Public Review Draft
August 2015
Proposition 1 Storm Water Grant Program
PUBLIC REVIEW DRAFT ii August 2015
This Page Intentionally Left Blank
To Allow for Double-sided Printing
Proposition 1 Storm Water Grant Program
PUBLIC REVIEW DRAFT iii August 2015
TABLE OF CONTENTS
TOPIC Page #
I. PURPOSE...................................................................................................................................... 1
II. OVERVIEW .................................................................................................................................... 1
A. SOLICITATIONS ............................................................................................................................ 2
I. Planning Grants ....................................................................................................................... 2
II. Implementation Grants............................................................................................................ 2
III. ELIGIBILITY REQUIREMENTS ..................................................................................................... 3
A. ELIGIBLE APPLICANTS ................................................................................................................ 3
B. ELIGIBLE PROJECT TYPES ......................................................................................................... 3
I. Planning Grants ....................................................................................................................... 3
II. Implementation Grants............................................................................................................ 4
C. GRANT AMOUNT .......................................................................................................................... 5
D. MATCH REQUIREMENT ............................................................................................................... 5
I. Disadvantaged and Economically Distressed Areas Funding Match Reduction ................ 5
E. SCHEDULE .................................................................................................................................... 6
F. EDUCATION AND OUTREACH ..................................................................................................... 6
G. PROGRAM PREFERENCES ......................................................................................................... 7
IV. PROJECT SELECTION PROCESS ............................................................................................... 7
A. APPLICANT ASSISTANCE WORKSHOPS .................................................................................... 7
B. SOLICITATION AND SUBMITTAL OF PROPOSALS ................................................................... ...
PROPOSITION 1 STORM WATER GRANT PROGRAM GUIDELIN.docxpoulterbarbara
PROPOSITION 1
STORM WATER GRANT PROGRAM
GUIDELINES
Public Review Draft
August 2015
Proposition 1 Storm Water Grant Program
PUBLIC REVIEW DRAFT ii August 2015
This Page Intentionally Left Blank
To Allow for Double-sided Printing
Proposition 1 Storm Water Grant Program
PUBLIC REVIEW DRAFT iii August 2015
TABLE OF CONTENTS
TOPIC Page #
I. PURPOSE...................................................................................................................................... 1
II. OVERVIEW .................................................................................................................................... 1
A. SOLICITATIONS ............................................................................................................................ 2
I. Planning Grants ....................................................................................................................... 2
II. Implementation Grants............................................................................................................ 2
III. ELIGIBILITY REQUIREMENTS ..................................................................................................... 3
A. ELIGIBLE APPLICANTS ................................................................................................................ 3
B. ELIGIBLE PROJECT TYPES ......................................................................................................... 3
I. Planning Grants ....................................................................................................................... 3
II. Implementation Grants............................................................................................................ 4
C. GRANT AMOUNT .......................................................................................................................... 5
D. MATCH REQUIREMENT ............................................................................................................... 5
I. Disadvantaged and Economically Distressed Areas Funding Match Reduction ................ 5
E. SCHEDULE .................................................................................................................................... 6
F. EDUCATION AND OUTREACH ..................................................................................................... 6
G. PROGRAM PREFERENCES ......................................................................................................... 7
IV. PROJECT SELECTION PROCESS ............................................................................................... 7
A. APPLICANT ASSISTANCE WORKSHOPS .................................................................................... 7
B. SOLICITATION AND SUBMITTAL OF PROPOSALS ....................................................................
This report identifies potential hydro power sites in County Kilkenny and provides guidance on developing hydro projects. It was commissioned by Kilkenny LEADER Partnership. Twenty-seven sites were assessed for their power generation potential. Sites with capacities from 11-50kW and <11kW were identified as good candidates for development. The report also provides an overview of the development process, including feasibility studies, permitting, environmental assessments, grid connection and revenue options. Its aim is to help landowners and communities develop local hydro power and support rural development in Kilkenny.
This draft wastewater facilities plan by Carollo Engineers summarizes the existing wastewater system for the City of Oak Harbor and evaluates alternatives to address the city's future needs. The plan identifies expanding population growth as driving the need for increased treatment capacity. Two potential sites, Windjammer Vicinity and Crescent Harbor North, are evaluated in detail as locations for a new membrane bioreactor wastewater treatment plant. The recommended alternative includes a new 7.5 million gallon per day plant in Phase 1 to be located at Crescent Harbor North along with conveyance system upgrades.
The document is a long range transportation plan for the KACTS region from 2010-2035. It provides an introduction to the KACTS region and membership, the planning process, and federal and state requirements. It also summarizes existing transportation characteristics and trends in the region related to roadways, bridges, public transit, freight, and socioeconomic factors. The plan is required to maintain federal transportation funding and address transportation needs and funding over the planning period.
The document provides a greenhouse gas inventory for the City of Beaverton's internal operations from 2008-2013. It finds that in 2013, emissions totaled 25,185 metric tons of CO2 equivalent. This is a 13% reduction from 2008 levels, putting Beaverton on track to meet its goal of a 20% reduction by 2020. Emissions increased for refrigerants, business travel, and fossil fuels used in vehicles. Emissions decreased for biofuels used in vehicles, natural gas, electricity, commuting, and solid waste. The inventory analyzed scopes 1, 2, and 3 emissions and provides details on methodology and emissions sources.
It's not just about Alberta: Oilsands generate thousands of jobs, billions in...Ports-To-Plains Blog
This report provides strategic insights by examining the impacts the oil sands industry has made on North American economies and how the industry will likely develop into the future. Two themes are central to the report: impact on Canadian provincial and national economies, and the oil sands’ ripple effects on US state and federal economies.
This document describes the development of automated workflows for analyzing well permit applications in Weber County and Northern Utah County, Utah. ArcGIS and Arc Hydro Groundwater were used to create workflows that add proposed wells to a MODFLOW groundwater model, run the model, and import the results. The Northern Utah County workflow analyzes impacts to springs and allows for drawdown limits. The Weber County workflow was adapted for its permitting criteria and model characteristics. The workflows are intended to streamline the permitting process and reduce the time required for analysis.
This document is the introductory letter to the Upper Occoquan Service Authority's (UOSA) Comprehensive Annual Financial Report for fiscal year 2014. It introduces UOSA as the regional water authority formed in 1971 to protect the Occoquan Reservoir, which provides drinking water to over 2 million people. It notes that UOSA operates one of the largest water reclamation facilities in the country and is committed to environmental stewardship. The letter also indicates that management is responsible for the accuracy and completeness of the financial data presented in the report.
The document is the May/June 2005 issue of Building Australia magazine. It contains several articles about recent government budgets that include funding for infrastructure, skills training programs, and housing initiatives. The federal budget commits to expanding apprenticeships and skilled migration. State budgets provide funding for projects outlined in their strategic plans such as Melbourne 2030. The budgets aim to address skills shortages and support the building and construction industry.
This document provides an outline for a study that aims to use GIS to locate potential new solid waste landfill sites in the Nelson Mandela Bay Municipality in South Africa. The study will involve a literature review on solid waste management issues and how GIS has been used to address siting problems. A methodology will be developed using GIS-based suitability analysis and a questionnaire to stakeholders. Potential sites will be identified and analyzed based on exclusion and non-exclusion criteria. The results will provide recommendations for new landfill sites and contribute to improving solid waste management in the municipality.
This document discusses how rural communities in Kenya can develop sustainable water supplies with assistance from the Water Services Trust Fund. It describes six water projects built by Danish International Development Agency (DANIDA) in partnership with local communities between 2003-2006. The projects trained community members to construct and maintain infrastructure like intakes, dams, and kiosks to provide local water access. Communities contributed labor and materials to lower costs. Ongoing training on financial management, record keeping, and maintenance aims to ensure communities independently operate and maintain their water systems over the long term.
This document discusses how rural communities in Kenya can develop sustainable water supplies with assistance from the Water Services Trust Fund. It describes six water projects built by Danish International Development Agency (DANIDA) in partnership with local communities between 2003-2006. The projects trained community members to construct and maintain infrastructure like intakes, dams, and kiosks to provide access to water. Communities contributed labor and materials to reduce costs. Ongoing support included training managers in financial planning, record keeping, and operating projects as businesses to ensure long-term sustainability.
Kenya; Water for Rural Communities: How Kenyan Rural Communities Can Create...V9X
The document discusses preparations for constructing rural water projects and training communities in Kenya. It emphasizes the importance of gender equality, highlighting that women play a major role in water collection and management. Six water projects were implemented with assistance from the communities. Over 120 committee members and 113 local builders were trained to support project construction and long-term management. The training focused on community organization, financial management, and developing local skills to promote self-employment and economic development in the rural areas.
This document provides guidelines for energy efficient building design. It covers lighting, electric power and distribution, building envelope, air conditioning systems, and boiler and hot water systems. For lighting, it recommends efficient lamp types and design approaches to reduce energy use. It sets maximum power density limits for interior and exterior lighting. For other building systems, it provides requirements for equipment efficiency and design criteria to improve energy performance. The guidelines aim to reduce building energy use while maintaining occupant comfort.
This document provides an overview and extracts from the main AD Deployment in the UK report which is available from NNFCC.
NNFCC has published the definitive report on Anaerobic Digestion Deployment in the UK. The report provides a comprehensive regional breakdown of sector development in Scotland, Wales, Northern Ireland and the 10 regions of England, providing detailed information on feedstock requirements, installed capacity and output type (combined heat & power or biomethane-to grid) for every project.There are over 130 operational AD plants in the UK outside of the sewage treatment sector, with more than 340 projects currently under development. NNFCC has now published the definitive report on Anaerobic Digestion Deployment in the UK. The report provides a comprehensive regional breakdown of sector development in Scotland, Wales, Northern Ireland and the 10 regions of England, giving detailed information on feedstock requirements, installed capacity and output type (combined heat & power or biomethane-to grid) for every project.
http://www.nnfcc.co.uk/bioenergy/ad-deployment-report
Results from the study identified areas across Summit County sensitive to ground water. Using this information, Environmental Health staff can ensure septic systems are appropriately suited to the area where they are installed, ultimately increasing the life of the system and its ability to protect the environment. The end goal is to prevent future septic system failure due to growth and protect overall water quality throughout the county.
Sampling was done in both Snyderville Basin and parts of Eastern Summit County to determine sensitive areas optimal for sewer or septic upgrades. Water samples were taken during peak runoff (spring) and baseflow conditions (summer) to test for Escherichia coli (E. coli), nitrates, general bacteria and human-associated bacteria.
Similar to 2012 Water & Wastewater Master Plan (20)
The document discusses rules and protocols for council membership on committees. It outlines that the mayor appoints members to council committees, subject to council consent. It describes how the council can create other boards and committees to assist city operations. It defines different types of committee members, including regular members, ex officio members, and honorary members, and their roles and voting privileges. It also provides guidelines for declaring a position vacant due to excessive absences from committee meetings.
The document summarizes the sale of a 0.505 acre lot located on the corner of Camilla Road and Buckley Avenue. The lot is zoned residential and surrounded by other residential uses. It is fenced and may contain an abandoned underground water pipe. The city mows the property but it is no longer needed for city purposes. The city council agreed to a competitive bidding process for sale with a minimum bid of $5,000. One bid was received for the property. Staff recommends approving the sale to the highest bidder to return the land to the tax roll and reduce maintenance duties.
The quarterly investment report for the City of Killeen shows that as of December 31, 2016:
- The investment portfolio totaled $97.7 million and was in compliance with regulations.
- The largest holdings were in pools/money market accounts (55%) and certificates of deposit (35%).
- The total portfolio average yield was 0.66% for the quarter.
The audit of the City of Killeen's financial statements for the year ended September 30, 2016 resulted in unmodified opinions and no findings. The auditors found no issues with internal controls over financial reporting, compliance with laws and regulations, or compliance with requirements for major federal programs. Management's estimates and judgments were deemed reasonable. The auditors encountered no difficulties during the audit and had no independence issues.
The document outlines a proposed $394,456 budget amendment for auditing services, with the costs to be allocated 70% to the general fund ($276,119), 20% to the water and sewer fund ($78,891), and 10% to the solid waste fund ($39,446). It also shows the current and amended budgets as well as revised fund balances for each impacted fund.
The document outlines the objectives and scope of a forensic audit of the City of Killeen, TX. The audit will examine several areas of risk, including capital outlays from 2002-2016, use of bond money from 2002-2017, inter-fund transfers from 2010-2017, pay increases from 2014-2017, city/owner agreements from 2002-2016, private roadway ownership from 2002-2016, and post-recall spending from 2011-2012. The document discusses the audit process and seeks input from city officials on past issues, current risks, and future visions for each area to guide the risk-based analysis.
DS-17-046 - Policy for Citizen AppointmentsCityofKilleen
This draft policy establishes the procedure for appointing and reappointing citizens to boards, commissions, and committees in the city. It outlines that appointments will be made by October 1 annually and that staff will compile applications for council review. It also describes that some committees will have appointments made by subcommittees of two councilmembers each, while others will be reviewed and appointed by the full city council. The policy provides for term limits of six consecutive years and exceptions. It lists criteria for appointments such as residency, prior service, qualifications, and term limits. The council has responsibility and authority to review appointments annually.
This document provides an overview and update to Killeen's Parks Master Plan. It summarizes the plan's scope, existing parks system, public involvement process, needs assessment findings, and recommendations. The needs assessment found deficits in parkland acreage and uneven distribution. Key recommendations include developing new neighborhood parks, protecting green space, coordinating with schools, improving park connectivity and safety, and adopting a parkland ordinance. The document outlines the prioritization process for recommendations, including survey results prioritizing actions like protecting green space, developing parks on school lands, and improving park lighting, connectivity, and recreation opportunities. It invites the City Council to complete an online prioritization survey to help finalize the plan.
This document provides a first quarter financial review for the city of Killeen for various departments and funds. It shows that for the general fund, water and sewer fund, solid waste fund, drainage fund, Killeen-Fort Hood Regional Airport, and Skylark Field revenues and expenditures from October to December were below budgeted amounts for the first quarter, representing 25% of the fiscal year budget. Charts display revenue and expenditure amounts for October to December compared to annual budgets.
DS-17-038 Election Signs on City PropertyCityofKilleen
Election signs are allowed without a permit 90 days before through 10 days after an election. Residential signs must be 6 square feet or less on tracts of 1 acre or less, and 32 square feet or less on larger tracts or commercial property. Signs cannot be taller than 8 feet, illuminated, or have moving elements. Signs are prohibited on public easements and rights-of-way. Both city code and state law prohibit placing signs on city property or in public road rights-of-way unless authorized by law. The candidate notebook informs that campaigning is not allowed inside city buildings but grounds can be used for press conferences, and no campaign materials are permitted at council meetings.
The Killeen Police Department has operated a red light camera program since 2008 to decrease crashes at intersections. The program issues civil citations without points or warrants. While violations decreased over time, crashes increased slightly in 2011. The document discusses the program history, intersections monitored, crash data trends, population increases, financial details, and options for complying with new state laws requiring traffic studies and reporting or canceling the program.
DS-17-041 Process for Making Recommendations for Citizen AppointmentsCityofKilleen
The document outlines the process for making citizen appointments to boards and commissions in Killeen, Texas. It lists the current appointment subcommittees for various boards and notes which boards have appointments made by the entire city council. It presents options for the appointment process, such as continuing the current process with adjustments, making all boards appointed by the full council, or creating one central subcommittee to review applicants for all boards.
The document outlines the estimated budget and scope of a management audit and risk-based analysis of selected areas for the City of Killeen. It includes $394,456 in estimated costs to cover planning, analyzing seven specific areas of city management from 2002-2017, providing a mid-audit briefing, and delivering a final written report with findings and recommendations. The seven areas to be analyzed are: capital outlays, use of bond money, inter-fund transfers, pay increases, city/owner agreements, private roadway ownership, and spending during a post-recall period without a full city council.
This document outlines 16 action items related to establishing an impact fee study for the City of Killeen. It assigns responsible parties and target dates for tasks like engaging a consultant, establishing an advisory committee, conducting public hearings, and ultimately adopting an impact fee ordinance by June 2017.
The document summarizes the Community Development Block Grant program funding process for fiscal year 2017-2018. It outlines that CDBG funding must meet national objectives of benefiting low to moderate income individuals, preventing slums or blight, or addressing urgent community needs. It describes the Community Development Advisory Committee's role in ensuring citizen participation and addressing needs identified in the city's 5-year plan. The process includes community meetings, a request for project proposals, committee review and presentations, public hearings, and council approval before the annual plan is submitted to HUD for funding in October.
The existing animal shelter is well kept but too small for the community and has significant deficiencies. It lacks proper animal housing, medical clinic, and education center. The needs assessment recommends expanding capacity for the growing population and replacing or renovating the existing shelter to address deficiencies like drainage, HVAC, and finishes. A new shelter is estimated to cost $8.2 million in the first phase plus land.
City staff developed and adopted a mission, vision, and values statement in 2001. In 2006, the City and Chamber collaborated to build a branding platform assisted by Northstar Destination Strategies. In 2007, as part of VISION 2030, the City Council adopted a new mission statement, vision statement, and "A Community for" statements. The document then lists the mission, vision, values, and branding platform statements from 2001, 2006, and 2007.
This document is the 2017 Killeen Parks Master Plan Update, which was developed by the City of Killeen with assistance from Halff Associates, Inc. It provides an overview of the city's parks system and recommendations to guide future improvements and expansion. The plan analyzes trends, conducts a community engagement process, inventories existing parks and facilities, assesses needs, and establishes goals. It then provides recommendations in areas like parkland acquisition, design, connectivity, and programming to help meet needs over the next 20 years as the city continues to grow.
DS-17-014 City Council Chambers ConceptCityofKilleen
The document outlines the plans for renovating a city council chambers between January 2017 and November 2016. It involved evaluating relocation sites in November 2016, creating architectural renderings in December 2016 to January 2017, and demolishing the existing space to install new walls, doors, lighting, flooring, and accessibility features. The renovation would create a new broadcast studio, move broadcasting equipment, and hardwire audiovisual equipment to improve broadcasting and streaming of city council meetings. The advantages listed are keeping meetings in one space, reusing existing equipment, an improved flexible floorplan and sound, while disadvantages include the cost of moving and having workshops located at city hall during construction.
Bell County MUD #2 provided a briefing to the City Council on January 17, 2016 about a proposed residential development project. The briefing covered the MUD's background and amendments, obligations of the city to provide water, wastewater and transportation infrastructure, anticipated project timeline of initial construction in 2017-2018 with buildout over 10+ years, and future action items around water storage, road improvements, and continued updates.
This report explores the significance of border towns and spaces for strengthening responses to young people on the move. In particular it explores the linkages of young people to local service centres with the aim of further developing service, protection, and support strategies for migrant children in border areas across the region. The report is based on a small-scale fieldwork study in the border towns of Chipata and Katete in Zambia conducted in July 2023. Border towns and spaces provide a rich source of information about issues related to the informal or irregular movement of young people across borders, including smuggling and trafficking. They can help build a picture of the nature and scope of the type of movement young migrants undertake and also the forms of protection available to them. Border towns and spaces also provide a lens through which we can better understand the vulnerabilities of young people on the move and, critically, the strategies they use to navigate challenges and access support.
The findings in this report highlight some of the key factors shaping the experiences and vulnerabilities of young people on the move – particularly their proximity to border spaces and how this affects the risks that they face. The report describes strategies that young people on the move employ to remain below the radar of visibility to state and non-state actors due to fear of arrest, detention, and deportation while also trying to keep themselves safe and access support in border towns. These strategies of (in)visibility provide a way to protect themselves yet at the same time also heighten some of the risks young people face as their vulnerabilities are not always recognised by those who could offer support.
In this report we show that the realities and challenges of life and migration in this region and in Zambia need to be better understood for support to be strengthened and tuned to meet the specific needs of young people on the move. This includes understanding the role of state and non-state stakeholders, the impact of laws and policies and, critically, the experiences of the young people themselves. We provide recommendations for immediate action, recommendations for programming to support young people on the move in the two towns that would reduce risk for young people in this area, and recommendations for longer term policy advocacy.
Monitoring Health for the SDGs - Global Health Statistics 2024 - WHOChristina Parmionova
The 2024 World Health Statistics edition reviews more than 50 health-related indicators from the Sustainable Development Goals and WHO’s Thirteenth General Programme of Work. It also highlights the findings from the Global health estimates 2021, notably the impact of the COVID-19 pandemic on life expectancy and healthy life expectancy.
RFP for Reno's Community Assistance CenterThis Is Reno
Property appraisals completed in May for downtown Reno’s Community Assistance and Triage Centers (CAC) reveal that repairing the buildings to bring them back into service would cost an estimated $10.1 million—nearly four times the amount previously reported by city staff.
Jennifer Schaus and Associates hosts a complimentary webinar series on The FAR in 2024. Join the webinars on Wednesdays and Fridays at noon, eastern.
Recordings are on YouTube and the company website.
https://www.youtube.com/@jenniferschaus/videos
Food safety, prepare for the unexpected - So what can be done in order to be ready to address food safety, food Consumers, food producers and manufacturers, food transporters, food businesses, food retailers can ...
Jennifer Schaus and Associates hosts a complimentary webinar series on The FAR in 2024. Join the webinars on Wednesdays and Fridays at noon, eastern.
Recordings are on YouTube and the company website.
https://www.youtube.com/@jenniferschaus/videos
Jennifer Schaus and Associates hosts a complimentary webinar series on The FAR in 2024. Join the webinars on Wednesdays and Fridays at noon, eastern.
Recordings are on YouTube and the company website.
https://www.youtube.com/@jenniferschaus/videos
AHMR is an interdisciplinary peer-reviewed online journal created to encourage and facilitate the study of all aspects (socio-economic, political, legislative and developmental) of Human Mobility in Africa. Through the publication of original research, policy discussions and evidence research papers AHMR provides a comprehensive forum devoted exclusively to the analysis of contemporaneous trends, migration patterns and some of the most important migration-related issues.
A Guide to AI for Smarter Nonprofits - Dr. Cori Faklaris, UNC CharlotteCori Faklaris
Working with data is a challenge for many organizations. Nonprofits in particular may need to collect and analyze sensitive, incomplete, and/or biased historical data about people. In this talk, Dr. Cori Faklaris of UNC Charlotte provides an overview of current AI capabilities and weaknesses to consider when integrating current AI technologies into the data workflow. The talk is organized around three takeaways: (1) For better or sometimes worse, AI provides you with “infinite interns.” (2) Give people permission & guardrails to learn what works with these “interns” and what doesn’t. (3) Create a roadmap for adding in more AI to assist nonprofit work, along with strategies for bias mitigation.
Contributi dei parlamentari del PD - Contributi L. 3/2019Partito democratico
DI SEGUITO SONO PUBBLICATI, AI SENSI DELL'ART. 11 DELLA LEGGE N. 3/2019, GLI IMPORTI RICEVUTI DALL'ENTRATA IN VIGORE DELLA SUDDETTA NORMA (31/01/2019) E FINO AL MESE SOLARE ANTECEDENTE QUELLO DELLA PUBBLICAZIONE SUL PRESENTE SITO
Contributi dei parlamentari del PD - Contributi L. 3/2019
2012 Water & Wastewater Master Plan
1. Water and Wastewater Master Plan
Prepared for:
City of Killeen
Prepared by:
FREESE AND NICHOLS, INC.
4055 International Plaza, Suite 200
Fort Worth, Texas 76109
817-735-7300
KIL11275
3. Water and Wastewater Master Plan
City of Killeen
i
TABLE OF CONTENTS
Executive Summary....................................................................................................................................... ES-1
1.0 INTRODUCTION ..................................................................................................................................1-1
1.1 Scope of Work...............................................................................................................................1-1
1.2 List of Abbreviations ..................................................................................................................1-2
2.0 POPULATION........................................................................................................................................2-1
2.1 Service Area...................................................................................................................................2-1
2.2 Historical Population .................................................................................................................2-3
2.3 Projected Population..................................................................................................................2-3
3.0 WATER DEMANDS .............................................................................................................................3-1
3.1 Historical Water Demands.......................................................................................................3-1
3.2 Projected Water Demands .......................................................................................................3-2
4.0 DESCRIPTION OF THE EXISTING WATER SYSTEM ..............................................................4-1
4.1 Pressure Planes............................................................................................................................4-1
4.2 Water Lines....................................................................................................................................4-4
4.3 Wholesale Water Supply...........................................................................................................4-4
4.4 Pump Stations...............................................................................................................................4-5
4.5 Storage Facilities..........................................................................................................................4-5
5.0 WATER SYSTEM ANALYSES AND HYDRAULIC MODELING ..............................................5-1
5.1 Water Model Development......................................................................................................5-1
5.2 Existing Water System Analysis.............................................................................................5-8
5.3 Future Water System Analysis ............................................................................................ 5-14
6.0 WATER SYSTEM CAPITAL IMPROVEMENTS PLAN..............................................................6-1
6.1 Water Projects from 2013 to 2015.......................................................................................6-4
6.2 Water Projects from 2016 to 2018.......................................................................................6-5
6.3 Water Projects from 2019 to 2021.......................................................................................6-6
6.4 Water Projects from 2022 to 2024.......................................................................................6-7
6.5 Water Projects from 2025 to 2027.......................................................................................6-8
6.6 Water Projects from 2028 to 2030.......................................................................................6-9
6.7 Water Projects from 2031 to 2033.................................................................................... 6-10
7.0 WASTEWATER FLOWS ....................................................................................................................7-1
7.1 Historical Wastewater Flows..................................................................................................7-1
7.2 Projected Wastewater Flows ..................................................................................................7-2
8.0 DESCRIPTION OF THE EXISTING WASTEWATER SYSTEM...............................................8-1
8.1 Major Basins..................................................................................................................................8-1
4. Water and Wastewater Master Plan
City of Killeen
ii
8.2 Wastewater Lines........................................................................................................................8-1
8.3 Wastewater Treatment Plants................................................................................................8-3
8.4 Lift Stations....................................................................................................................................8-3
9.0 WASTEWATER SYSTEM ANALYSES AND HYDRAULIC MODELING...............................9-1
9.1 Wastewater Hydraulic Model Development.....................................................................9-1
9.2 Existing Wastewater System Analysis.................................................................................9-2
9.3 Future Wastewater System Analysis ...................................................................................9-4
10.0 WASTEWATER SYSTEM CAPITAL IMPROVEMENTS PLAN............................................ 10-1
10.1 Wastewater Projects from 2013 to 2015........................................................................ 10-4
10.2 Wastewater Projects from 2016 to 2018........................................................................ 10-5
10.3 Wastewater Projects from 2019 to 2021........................................................................ 10-6
10.4 Wastewater Projects from 2022 to 2024........................................................................ 10-7
10.5 Wastewater Projects from 2025 to 2027........................................................................ 10-9
10.6 Wastewater Projects from 2028 to 2030........................................................................ 10-9
10.7 Wastewater Projects from 2031 to 2033......................................................................10-10
LIST OF TABLES
Table 2-1: Historical Population ..........................................................................................................2-3
Table 2-2: Population Projections.......................................................................................................2-4
Table 3-1: Historical Water Usage.......................................................................................................3-2
Table 3-2: 2012 Water Demand Projections by Pressure Plane..............................................3-4
Table 3-3: 2017 Water Demand Projections by Pressure Plane..............................................3-4
Table 3-4: 2022 Water Demand Projections by Pressure Plane..............................................3-4
Table 3-5: 2032 Water Demand Projections by Pressure Plane..............................................3-5
Table 4-1: Summary of Pumping Facilities......................................................................................4-6
Table 4-2: Existing Ground Storage Tanks.......................................................................................4-7
Table 4-3: Existing Elevated Storage Tanks ....................................................................................4-7
Table 5-1: Initial C-value Assignments..............................................................................................5-1
Table 5-2: Existing System TCEQ Storage Requirements...........................................................5-8
Table 5-3: TCEQ Service Pumping Requirements.........................................................................5-9
Table 5-4: Existing System TCEQ Pumping Requirements........................................................5-9
Table 6-1: Water Projects Unit Costs .................................................................................................6-1
Table 6-2: Water Capital Improvements Plan Summary............................................................6-2
Table 7-1: Historical Wastewater Flows...........................................................................................7-2
Table 7-2: 2012 Wastewater Flows by Basin..................................................................................7-3
Table 7-3: 2017 Wastewater Flows by Basin..................................................................................7-3
5. Water and Wastewater Master Plan
City of Killeen
iii
Table 7-4: 2022 Wastewater Flows by Basin..................................................................................7-4
Table 7-5: 2032 Wastewater Flows by Basin..................................................................................7-4
Table 8-1: Lift Station Capacity.............................................................................................................8-3
Table 9-1: TCEQ Slope Requirements................................................................................................9-4
Table 10-1: Wastewater Projects Unit Costs ..................................................................................10-1
Table 10-2: Wastewater Capital Improvements Plan Summary.............................................10-2
LIST OF FIGURES
Figure 2-1: Service Area............................................................................................................................2-2
Figure 2-2: Service Population by Census Tract..............................................................................2-5
Figure 3-1: Historical and Projected Water Demands...................................................................3-3
Figure 4-1: Existing Water System........................................................................................................4-2
Figure 4-2: Existing System Schematic ...............................................................................................4-3
Figure 4-3: Pipeline Diameter by Length............................................................................................4-4
Figure 4-4: Pipeline Material by Length .............................................................................................4-4
Figure 5-1: Pressure Recording Data for Lower Pressure Plane...............................................5-3
Figure 5-2: Pressure Recording Data for Upper, Middle, and Douglas Mt.............................5-4
Figure 5-3: Pressure Recording Data for Transmission Main to PS #4..................................5-5
Figure 5-4: Pressure Recorder Locations...........................................................................................5-6
Figure 5-5: Existing System Minimum Pressures ........................................................................5-12
Figure 5-6: Existing System Minimum Pressures ........................................................................5-13
Figure 6-1: Water System Capital Improvement Plan...................................................................6-3
Figure 8-1: Pipeline Diameter by Length............................................................................................8-1
Figure 8-2: Pipeline Material by Length .............................................................................................8-1
Figure 8-3: Existing Wastewater System............................................................................................8-2
Figure 9-1: Existing Wastewater System Analysis..........................................................................9-3
Figure 9-2: Proposed Basin Delineation.............................................................................................9-6
Figure 9-3: Sewer System Rehabilitation...........................................................................................9-8
Figure 10-1: Wastewater System Capital Improvement Plan ..............................................10-3
APPENDICES
Appendix A – Water Capital Improvement Plan Cost Tables
Appendix B – Wastewater Capital Improvement Plan Cost Tables
Appendix C – Water Model Calibration Results
Appendix D – Modeled Pumping and Tank Levels
Appendix E – Modeled Pressure and Fire Flow Maps
6. Water and Wastewater Master Plan
City of Killeen
ES-1
EXECUTIVE SUMMARY
1.0 INTRODUCTION
The City of Killeen is a growing community located in central Texas, within Bell County. The City
currently provides water and wastewater service to over 131,000 people. The population within the
service area is projected to grow by almost 50,000 people in the next 20 years. Accommodating this
growth in an efficient and cost effective manner, while also focusing on the maintenance of existing
aging water and wastewater system assets, is the purpose of this 2012 Water and Wastewater Master
Plan. This report has been prepared to provide the City of Killeen a planning tool that will serve as a
guide for short-term and long-term improvements to the infrastructure within the water and
wastewater systems.
2.0 POPULATION
Population and projected land use are important elements in the analysis of water distribution and
wastewater collection systems. Water demands and wastewater loads are dependent on the residential
population and commercial development served by the systems and determine the sizing and location
of system infrastructure. A thorough analysis of historical and projected populations provides the basis
for future water demands and wastewater loads.
Based on our analysis and historical trends, an annual growth rate of 1.3% was used to project the 5-
year population. The annual growth rate was increased for the subsequent planning periods assuming
growth would increase into the future due to the availability of developable land in the service area and
the recovery of the economy. Table ES-1 presents the water and wastewater service population
projections for each planning period.
Table ES-1: Population Projections
Planning Year Population
2012 131,474
2017 139,919
2022 151,330
2032 179,825
7. Water and Wastewater Master Plan
City of Killeen
ES-2
3.0 WATER DEMANDS
Reviewing historical water demands provides insight into selecting design criteria used to project future
water demands. Annual average day demand, maximum day to average day peaking factors, and per-
capita consumption were reviewed and provided a basis for determining the design criteria used to
project water demands. Figure ES-1 illustrates the historical and projected water demands for the City
of Killeen. Maximum day demand data from 2006 to 2010 was not included due to inaccurate water
metering.
Figure ES-1: Historical and Projected Water Demands
4.0 DESCRIPTION OF EXISTING WATER SYSTEM
The City of Killeen’s distribution system consists of 617 miles of water lines. Pipeline diameters range in
size from 1-inch to 30-inches. The City acquires water from a wholesale water supplier to provide
service to its residents. Currently, the City exclusively purchases treated surface water from Bell County
Water Control and Improvement District #1. The surface water is part of the 39,000 acre-feet/year of
raw water that Killeen has secured in Lake Belton. The existing maximum daily supply of treated water
is 32.0 mgd. The City of Killeen receives the treated water at four delivery points. Five pump stations
are utilized to supply water throughout the distribution system. Twelve ground storage tanks and five
elevated storage tanks also make up the distribution system facilities.
17.09 18.19 19.67
23.38
28.20
30.01
32.46
38.57
47.94
51.02
55.18
65.57
0
10
20
30
40
50
60
70
1995 2000 2005 2010 2015 2020 2025 2030 2035
WaterDemand(mgd)
Year
Average Day Maximum Day Peak Hour
ProjectedHistorical
8. Water and Wastewater Master Plan
City of Killeen
ES-3
5.0 WATER SYSTEM ANALYSES AND HYDRAULIC MODELING
Hydraulic analyses were conducted to identify deficiencies in the City of Killeen’s existing water
distribution system and to establish a capital improvements plan to improve the existing system and
meet projected water demands through 2032. Various combinations of improvements and system
modifications were investigated to determine the most appropriate approach for meeting projected
demands. Parameters used in developing the capital improvements plan included increasing system
reliability, renewing aging infrastructure, simplifying system operations, meeting required fire flows, and
maintaining proper residual pressures.
The City of Killeen’s water model was developed using H2OMap Water software by Innovyze and
consists of all pipes and facilities in the distribution system. In order to verify that the hydraulic model
accurately represented the actual distribution system, a model calibration analysis was performed. The
calibration process involved adjusting system operation, C-values, demand allocation, and peaking
factors to match a known condition. Calibration is an important component of building and using a
hydraulic model. Achieving a good calibration to real-world conditions instills confidence that the model
elements are reflective of the actual distribution system infrastructure and operation.
The hydraulic model was used to evaluate the existing distribution system to assess current pumping
and storage capacity, residual pressures, and fire flow capacity. This analysis is performed to determine
if there are any existing system deficiencies and also to provide a baseline for the current level of
service. The results of the analysis are summarized below:
The City is currently exceeding all TCEQ requirements for storage and pumping capacity.
A review of existing pressures throughout the system revealed three areas of low pressure due
to high ground elevations.
The majority of the water system can provide at least 1,000 gpm, which is a typical residential
fire flow demand. Available fire flows below 1,000 gpm are due to small diameter lines in
isolated areas.
Once the existing system was evaluated, hydraulic analyses were performed on the distribution system
under future demand conditions. Water system improvements were developed to accommodate the
anticipated residential and non-residential growth over the next 20 years. Challenges facing the water
system include providing additional supply and transmission capacity, meeting elevated storage and
pumping requirements, providing service to areas of growth south of the existing City limits where little
9. Water and Wastewater Master Plan
City of Killeen
ES-4
or no infrastructure currently exists, and maintaining aging infrastructure through asset management.
Key observations and recommendations resulting from modeling and evaluation of the distribution
system are:
The projected demands exceed the existing treated water rate of 32 mgd in 2022. Therefore, it
is recommended that an additional water supply facility be constructed near Highway 195 and
Chaparral Road.
Several areas were identified that need additional transmission capacity to convey water
throughout the distribution system. Transmission lines are larger diameter pipelines primarily
used to transfer water from the source to areas of demand.
Based on the evaluation of existing and future system operations, it is recommended that the
City maintain 150 gallons/connection of elevated storage, which is more than the minimum
TCEQ requirement.
As new development occurs within Killeen’s water service area, new water lines are needed to
extend service to unserved areas. It is recommended that a minimum line size of 12-inches be
installed, creating one-mile grids where possible.
Water line break data along with pipe material and diameter were used to identify water lines
to be replaced and/or rehabilitated. Replacing or rehabilitating aging water lines can potentially
reduce the number of breaks, as well as increase available fire flow and improve water quality in
the area.
6.0 WATER SYSTEM CAPITAL IMPROVEMENT PLAN
Freese and Nichols, Inc. (FNI) developed a capital improvements plan for the City of Killeen to ensure
high quality water service that promotes residential and commercial development. The recommended
improvements will provide the required capacity and reliability to meet projected water demands
through the year 2032. Utilizing the hydraulic model to analyze the water distribution system,
improvements were phased into the three year planning period in which they become hydraulically
necessary. It is recommended that these projects be constructed generally in the order listed; however,
development patterns may make it necessary to construct some projects sooner or later than
anticipated. Table ES-2 summarizes the costs of the recommended water system capital improvements
plan for the City of Killeen.
10. Water and Wastewater Master Plan
City of Killeen
ES-5
Table ES-2: Summary of Water Capital Improvements Plan
Phase Cost
2013-2015 $7,711,100
2016-2018 $14,716,810
2019-2021 $7,931,230
2022-2024 $12,069,400
2025-2027 $10,292,920
2028-2030 $10,128,400
2031-2033 $11,268,650
Total $74,118,510
7.0 WASTEWATER FLOWS
FNI analyzed monthly flow data provided by the City from January 2005 through February 2012 to
determine the historical trends in system-wide average daily flow and per-capita flow. Nearly two years
of monthly flow data at each of the two wastewater treatment plants were also provided to determine
if the average day per-capita flow was the same for both plants. To project future average wastewater
flows, FNI recommends using 125 gpcd for wastewater flow in the North WWTP service area and an
average flow rate of 75 gpcd was selected for the basins contributing to the South WWTP as determined
through a review of historical data. Future average daily wastewater loads were calculated by applying
the selected per-capita loadings to the growth in population for the 2012, 2017, 2022 and 2032 planning
periods. To determine the peak wet weather to average day peaking factor FNI utilized the peaking
factors developed in the 2010 SSES Basin Prioritization Study for a 4-inch, 5-year, 6-hour design storm.
Tables ES-3 provides a summary of the population and wastewater flow by basin for each planning
period.
Table ES-3: Summary of Wastewater Flow Projections
Year Population
Average Day Flow
(mgd)
Peak Wet Weather Flow
(mgd)
2012 131,474 13.70 54.78
2017 139,919 14.52 57.65
2022 151,330 15.65 61.32
2032 179,825 18.35 71.04
8.0 DESCRIPTION OF THE EXISTING WASTEWATER SYSTEM
The City of Killeen’s existing wastewater system consists of 535 miles of wastewater collector mains and
interceptors. Pipeline diameters range in size from 4-inches to 42-inches. The wastewater system is
11. Water and Wastewater Master Plan
City of Killeen
ES-6
served by two wastewater treatment plants that are owned and operated by Bell County Water Control
and Improvement District #1. The North WWTP has a total treatment capacity of 21 mgd, while the
South WWTP has a treatment capacity of 6 mgd. Lift stations are necessary when wastewater needs to
be pumped to a higher elevation where the gravity flow can resume to the outfall of the system. Due to
the varying topography citywide, Killeen operates 14 lift stations throughout the service area. The lift
stations vary in size from small development addition lift stations near the city limits to the three large
lift stations in the center of the City.
9.0 WASTEWATER SYSTEM ANALYSES AND HYDRAULIC MODELING
Hydraulic analyses were conducted to identify deficiencies in the City of Killeen’s existing wastewater
collection system and to establish a capital improvements plan to improve the existing system and
handle projected wastewater flows through 2032. Various combinations of improvements and
modifications were investigated to determine the most appropriate approach for conveying projected
flows. Parameters used in developing the improvements plan included increasing system reliability,
simplifying system operations, handling peak wet weather flows, maintaining proper velocities, and
reducing surcharging and sanitary sewer overflows.
FNI built a hydraulic model of the City of Killeen’s wastewater system using H2OMap Sewer. FNI
compared the average day and peak wet weather flows to the flows that were measured during the
2010 SSES Basin Prioritization Study to verify the model and imitate real world operations. The City also
provided permanent flow metering data from March 20, 2012, when 4.3 inches of rain fell across the
City. The data was used to compare flows from the model to an existing storm event.
The hydraulic model was used to evaluate the existing collection system to assess the ability of the
system to adequately convey wastewater without excessively surcharging or overflowing. This analysis
was performed to determine if there are any existing system deficiencies and also to provide a baseline
for the current level of service. The results of the analysis are summarized below:
Modeling showed no overflows under existing system conditions.
Areas in the northern and western portion of the City in the WWTP, South Nolan Creek, and
Long Branch Basins that flow to the North WWTP experience high levels of I/I based on the
observed peaking factors from the 2010 SSES Basin Prioritization Study.
The interceptor that flows into Lift Station #1 experiences significant surcharging.
12. Water and Wastewater Master Plan
City of Killeen
ES-7
The 21-inch and 12-inch wastewater line that runs parallel to the west of Twin Creek Dr. and the
upstream 12-inch portion that is parallel to Westcliff Road experience a significant amount of
surcharging under existing peak wet weather flows. The model indicates that the line is
exceeding capacity and is nearly overflowing under design storm conditions at the intersection
where there are two 12-inch wastewater lines conveying to a single 12-inch line.
Once the existing system was evaluated, hydraulic analyses were performed on the collection system
under future peak flow conditions. Wastewater system improvements were developed to accommodate
the anticipated residential and non-residential growth over the next 20 years. To serve the future
growth, the City of Killeen must rehabilitate, replace or upsize existing infrastructure and provide
additional service to areas of growth where little or no infrastructure currently exists. Key observations
and recommendations resulting from modeling and evaluation of the collection system are:
Ground elevations and recommended improvements to various lift stations and force mains
revealed a change in delineation of wastewater basin boundaries.
Evaluating the feasibility of a regional WWTP in the southern portion of the service area may be
beneficial in the future depending on how development occurs and the interest of other
potential regional partners.
FNI recommends that the City limit and/or reduce the number of lift stations where possible due
to the cost of operating and maintaining the facilities. Lift Station #24A can be abandoned in the
future after the flow is diverted by gravity to the Trimmier Creek Basin. There are also three
recommended projects to divert flow from Lift Stations #20, #23, and #24 from the South Nolan
Creek and the Central basins to the Trimmier Creek basin.
Multiple lift stations are needed in the very southern portion of the wastewater service area to
pump the flow to the South WWTP. Model results also indicate that there are existing
wastewater mains that do not have capacity to convey future wastewater flows without
excessive surcharging or overflowing.
Additional SSES work performed by Pipeline Analysis was used to identify manhole and sewer
line rehabilitation candidates. Performing a city wide rehabilitation program will reduce the
amount of I/I in the system while extending the life of the existing pipes and manholes.
13. Water and Wastewater Master Plan
City of Killeen
ES-8
10.0 WASTEWATER SYSTEM CAPITAL IMPROVEMENTS PLAN
FNI developed a capital improvements plan (CIP) for the City of Killeen to ensure the wastewater
collection system will effectively and efficiently continue to convey flow to the wastewater treatment
plants. The recommended improvements will provide the required capacity and reliability to meet
projected wastewater flows through year 2032. Utilizing the hydraulic model to analyze the wastewater
collection system, improvements were phased into the three year planning period in which they become
hydraulically necessary. It is recommended that these projects be constructed generally in the order
listed; however, development patterns may make it necessary to construct some projects sooner or
later than anticipated. Table ES-4 summarizes the costs of the recommended wastewater system
capital improvements plan for the City of Killeen. The total water and wastewater costs are presented in
Table ES-5.
Table ES-4: Summary of Wastewater Capital Improvements Plan
Phase Cost
2013-2015 $12,470,240
2016-2018 $9,981,550
2019-2021 $9,295,360
2022-2024 $6,875,650
2025-2027 $8,238,460
2028-2030 $8,889,490
2031-2033 $9,270,390
Total $65,021,140
Table ES-5: Summary of Water and Wastewater Costs
Phase Water Cost Wastewater Cost Total
2013-2015 $7,711,100 $12,470,240 $20,181,340
2016-2018 $14,716,810 $9,981,550 $24,698,360
2019-2021 $7,931,230 $9,295,360 $17,226,590
2022-2024 $12,069,400 $6,875,650 $18,945,050
2025-2027 $10,292,920 $8,238,460 $18,531,380
2028-2030 $10,128,400 $8,889,490 $19,017,890
2031-2033 $11,268,650 $9,270,390 $20,539,040
Total $74,118,510 $65,021,140 $139,139,650
14. Water and Wastewater Master Plan
City of Killeen
1-1
1.0 INTRODUCTION
The City of Killeen is a growing community located in central Texas, within Bell County. The City
currently provides water and wastewater service to over 131,000 people. The population within the
service area is projected to grow by almost 50,000 people in the next 20 years. Accommodating this
growth in an efficient and cost effective manner, while also focusing on the maintenance of existing
water and wastewater system assets, is the purpose of this 2012 Water and Wastewater Master Plan.
This report has been prepared to provide the City of Killeen a planning tool that will serve as a guide for
short-term and long-term improvements to the infrastructure within the water and wastewater
systems.
1.1 SCOPE OF WORK
Freese and Nichols, Inc. (FNI) was retained in 2011 by the City of Killeen to prepare a Water and
Wastewater Master Plan. The goals of the Water and Wastewater Master Plan were to evaluate the
integrity of the existing water and wastewater systems and to recommend a phased CIP through the
year 2032. The recommended improvements will serve as a basis for the design, construction, and
financing of facilities required to meet Killeen’s water and wastewater capacity and system renewal
needs. The major elements of the scope of this project included:
Water and Wastewater Model Development and Calibration
Population Projections
Water Demand and Wastewater Flow Projections
Water and Wastewater Hydraulic Analyses
Water and Wastewater System Capital Improvements Plan
Water and Wastewater System Master Plan Report
15. Water and Wastewater Master Plan
City of Killeen
1-2
1.2 LIST OF ABBREVIATIONS
Abbreviation Actual
AD Average Day Demand
CCN Certificate of Convenience and Necessity
CIP Capital Improvement Program
EPS Extended Period Simulation
EST Elevated Storage Tank
ETJ Extraterritorial Jurisdiction
FNI Freese and Nichols, Inc.
GIS Geographic Information System
gpcd Gallons per Capita per Day
gpd Gallons per Day
HGL Hydraulic Grade Line
I/I Infiltration and Inflow
lf Linear Feet
LS Lift Station
MD Maximum Day Demand
MG Million Gallons
mgd Million Gallons per Day
PH Peak Hour Demand
PRV Pressure Reducing Valve
PS Pump Station
psi Pounds per Square Inch
SCADA Supervisory Control and Data Acquisition
SSES Sanitary Sewer Evaluation Survey
SSO Sanitary Sewer Overflow
SSOI Sanitary Sewer Overflow Initiative
TCEQ Texas Commission on Environmental Quality
WL Water Line
WTP Water Treatment Plant
WWTP Wastewater Treatment Plant
16. Water and Wastewater Master Plan
City of Killeen
2-1
2.0 POPULATION
Population and projected land use are important elements in the analysis of water distribution and
wastewater collection systems. Water demands and wastewater loads are dependent on the residential
population and commercial development served by the systems and determine the sizing and location
of system infrastructure. A thorough analysis of historical and projected populations provides the basis
for future water demands and wastewater loads.
2.1 SERVICE AREA
The existing water and wastewater service area consists of the current city limits. The future service
area for the Water and Wastewater System Master Plan includes the existing city limits and a portion of
the extra-territorial jurisdiction (ETJ) that extends south of the city limits to the Lampasas River. Figure
2-1 shows the service area evaluated as part of Killeen’s Water and Wastewater Master Plan. For this
study, the future service area for Killeen includes service to new and existing customers within the
current city limits over the next 10 years and service in the ETJ beyond the 10-year planning period.
17. FORTHOODST
US 190
HWY
TRIMMIERRD
WSYOUNGDR
RANCIER AVE
CHAPARRAL RD
STAN SCHLUETER LP
STAGECOACH RD
38TH
ST
CENTRAL TEXAS EXPY
LAKE RD
WESTCLIFF
RD
2NDST
10THST
GRAYST
ONIONRD
VETERANS MEMORIAL
BLVD
ZEPHYR
RD
SHAWNDR
OLDFM440FM
REESE CREEK RD
FAWN DR
60THST
ROBINETT
RD
CLEAR CREEK RD
MESADR
WATERCREST RD
CHANTZDR
JASPER
DR
JANISDR
ELMS RD
ILLINOIS AVE
ROSEWOOD
D
R
GUS DR
TEAL
DR
CUNNINGHAM
RD
EASTTRIMMIERRD
E AVE
TERRACE DR
JIM AVE
COLLEGEST
RUIZDR
ASPEN DR
G AVE
WINDFIELD
DR
FLORENCERD
TW
IN
CREEK
D
R
ESTELLEAVE
WATER
ST
ATKINSON DR
STONETREE
DR
LEVYLN
ROYREYNOLDSDR
M
A
RY
J ANE DR
EXCEL DR
YATESRD
JOHN RD
LOVE RD
DUNCAN AVE
IDA DR
GILMERST
STALLION DR
NEWT DR
ME
A
D
O
WDR
HALLMARK AVE
CORA AVE
SILTSTONE LP
REIN
DR
CODYPOERD
PLATINUMDR
BERMUDADR
WEST LN
LOW
ES
BLVD
18THST
EDGEFIELD ST
LITTLE
NOLAN
RD
LEO LN
16THST
ALVINDR
CLAIRIDGE AVE
TAFT
ST
NINA DR
ROY J SMITH DR
JAMES LP
POLK
ST
ANDOVERDR
FIELDCREST DR
VEGA LN
VAHRENKAMP DR
LAVA
LN
I AVE
ROOTAVE
VIOLA DR
M
ARTIN
LUTH
ER KING JR BLVD
LIBRADR
SHERMANDR
GOWENDR
R
A
M
P
SHIMLADR
LEADER DR
WHITE AVE
FOSTERLN
BUNDRANTDR
HERNDONDR
JASMINELN
SULFUR SPRIN
G
DR
ROSEAVEWATEROAK
DR
WILLOWSPRINGSRD
LAURA DR
HILLST
ANNA LEE DR
WALESD
R
BUNNYTRL
DIANA DR
DICKENSDR
TOWER HILL LN
LAGOTRL
G
REENL
EE DR
CREEKSIDE DR
DEERWOODTRL
HITCHROCKDR
DUNN AVE
GREENGATE DR
MALLARD LN
GOLDEN GATE
DR
TURKEYTROTRD
S
CHWALD RD
SCHORN
D
R
46THST
6TH
ST
OAK HILL DR
58THST
RIOBLVD
JOHN HELEN DR
MONEYPIT
RD
LOOP R
D
AUBURN DR
WEISS DR
WHEELER AVE
BOYDAVE
CURTIS
DR
G
ROVE DR
LLOYD DR
VARDEMAN A
VE
CINCH DR
FLAT SLATE DR
SCHOTTISCHE LN
LIBERTYST
BRISTOL DR
LORENA
DR
CHRISTIEDR
TH
UNDER CREEK
DR
BACON RANCH RD
NATURAL LN
42NDST
KELLEY
LN
HIDDENHILLDR
OAKALLARD
BRANCHDR
GLOVERDR
RAINLILY
ST
PARK RD
CROCKETTDR
PRIVATE
PRIVATE
WESTRIMDR
SWANN
ER
LP
BRIDLEDR
BILLS
RD
BACHELORBUTTONBLVD
DAN
DR
LOHSE RD
SALT FORK DR
BLAKE ST
LLEWELLYN
DR
SERPENTINE DR
ERIC DR
LARK
SPURDR
ALA
N
CIR
WOOD AVE
PRIVATE DR
LUXOR DR
TIFFANY CIR
SILVERHILLDR
PRATHERDR
22NDST
BIRMIN G
HAM
CIR
SANTE FE DR
LANCE LOOP
SUNNY LN
OAK
VALLEYDR
POWDER
RIVER
DR
RILEY DR
LIO
NS
G
ATELN
CHESTNUTDR
BOWFIELDDR
SIS
SO
M
RD
QUARRYDR
OSTERDR
CA
RMEN
ST
54TH
ST
FEATHERLINERD
SPARROWRD
ZINC DR
FM
3481
RD
TYRELDR
TUMBLEWEEDDR
8THST
ADEELDR
BRYCE AVE
TIM
BERLINEDR
TOLEDODR
BOSWELL
DR
BENDING TRL
PLAINS
DR
ALI DR
ALAMOCITOS CREEK DR
ALEXANDERST
BARBED WIRE DR
DRIFTWOOD DR
PECOSDR
SAVAGEDR
LEWIS
ST
LOYAL LN
GALLOP
DR
KILPATRIC
K
DR
LYDIA DR
LYRADR
GOODHUEDR
MANDALAY
DR
CLOUD
LN
FLANIGANDR
RIMES RANCH DR
CROSS
DR
LEE DR
HAZEL DR
MAEDELL DR
MATTIE
DR
PARKST
WILLOWSWAY
JENNIFER
DR
GAUTIERAVE
SHEILA DR
PONDVIEW
DR
CHIPS DR
DEXTERDR
LEROYCIR
TUMUT LN
DAYTONDR
ELMS RD
RAMP
CENTRAL TEXAS
EXPY
RAMP
US 190
HWY
PARKRD
8THST
ROY REY
N
OLDSDR
RAMP
FORTHOODST
CUNNIN
GHAM
RD
Ushy 190
Sthy195
I35
Farm
To Market Road 2484
TrimmerRd
E Rancier Ave
SWSYoungDr
SFortHoodSt
HillRd
Battalion Ave
IndianTrl
E Elms Rd
Clear Creek Rd
E Stagecoach Rd
W
es
tcliff R
d
Farm To Market Road 439
E Stan Schlueter Lp
W Veterans Memorial Blvd
HoodRd
E
Farm To Market Road 2410
W
Stan Schlueter Lp
N
38thSt
Zephyr Rd
Tank Destroyer Blvd
Central Dr
S
AnnBlvd
NRoyReynoldsDr
FarmToMarketRoad440
StonetreeDr
NWSYoungDr
E Veterans Memorial Blvd
NolaRuthBlvd
Mountain Lion Rd
MartinLutherKingBlvd
LevyCrossingRd
60thSt
NFortHoodSt
N
C
entral Texas Expy
Terminal Ave
Sthy 138
Farm
To
M
ark
etRoad
440
Sthy195
Sthy195
ClearCreekRd
W Veterans Memorial Blvd
Sthy195
Ushy 190
Tank Destroyer Blvd
FIGURE 2-1
CITY OF KILLEEN
FUTURE SERVICE AREA
Created by Freese and Nichols, Inc.
Job No.: KIL11275
Location: H:W_WW_PLANNINGDELIVERABLES11-Final_W_WW_Report(Figure-2-1)-Service_area.mxd
Updated: October 16, 2012
0 4,000 8,000
SCALE IN FEET
I
LEGEND
Future Service Area
Road
Lake
Stream
Parcel
City Limits
Fort Hood
ETJ
18. Water and Wastewater Master Plan
City of Killeen
2-3
2.2 HISTORICAL POPULATION
The City of Killeen Planning and Development Services Department provided yearly population data
from 2000 through 2011. The data indicated an increasing growth rate with an average annual growth of
3.68% over the last 11 years. Table 2-1 presents the historical populations for the City of Killeen. The
2010 population listed in Table 2-1 is the official population posted by the U.S Census Bureau. The
significant increase in population from 2009 to 2010 is likely due to underestimating the City population
in the years between the 2000 Census and the 2010 Census. No adjustments were made to past data
when the 2010 Census population was released.
Table 2-1: Historical Population
Year Population Growth Rate
2000* 86,911 -
2001 89,858 3.39%
2002 93,587 4.15%
2003 100,911 7.83%
2004 102,461 1.54%
2005 104,032 1.53%
2006 105,604 1.51%
2007 112,434 6.47%
2008 116,934 4.00%
2009 119,510 2.20%
2010* 127,921 7.04%
2011 128,967 0.82%
Average 3.68%
*Official Census population
2.3 PROJECTED POPULATION
Population projections are an important component of the water and wastewater master planning
process. The magnitude and distribution of the growth in population will dictate where future water
and wastewater infrastructure is required. It is important to note that projecting future population is
challenging, especially for relatively small geographic areas such as individual cities because it can be
difficult to predict how fast or slow development will occur when there are a variety of circumstances
that can impact it.
19. Water and Wastewater Master Plan
City of Killeen
2-4
The Planning and Development Service Department provided an estimated 2012 population. Future
population projections for each planning year were developed based on the population forecasts in the
City’s 2010 Comprehensive Plan, input from City staff on proposed developments, and FNI’s analysis.
The 2010 Comprehensive Plan lists annual growth rates ranging from 1.26% to 2.06% through 2040.
Based on our analysis and historical trends, an annual growth rate of 1.3% was used to project the 5-
year population. The annual growth rate was increased for the subsequent planning periods assuming
growth would increase into the future due to the availability of developable land in the service area and
recovery of the economy. Table 2-2 presents the projected water and wastewater service population
for each planning period.
In the City’s Comprehensive Plan, it was stressed that cities should think in terms of a range of potential
growth rather than absolute numbers given the uncertainty of any small-area forecast that extends
beyond a few years; however, for master planning purposes, specific years are assigned to planning
periods so that improvements can be identified and phased by years. Therefore, although the
population projections were developed for specific years (2017, 2022, and 2032), the associated water
demands and wastewater flows should serve as triggers for improvements rather than being solely
based on the years identified in the phasing plan.
Table 2-2: Population Projections
Year Population
Average Annual
Growth Rate
2012 131,474 -
2017 139,919 1.3%
2022 151,330 1.6%
2032 179,825 1.9%
The total population for each planning year was distributed throughout the City using census tracts. The
tracts in the southern portion of the service area were rather large, so those were divided into smaller
planning areas to better distribute the population and represent growth trends. Figure 2-2 shows the
projected water and wastewater service population by census tract. Population was distributed based
on known future developments and the amount of developable land within each census tract.
20. 233-5
0
0
0
3800
233-3
0
0
0
1500
225.02
9942
11500
13500
17500
233-4
0
0
0
300
233-2
0
0
0
500
231.05
8805
10000
11250
16000
0
0
200
700
223
4258
5505
7200
9080
230
7028
7500
8500
9500
231.06
9716
9716
10000
12000
233-1
2000
3100
3700
6200
222
3258
3800
3900
5315
224.02
4602
4802
5000
8200
231.08
13856
14000
14500
14500
220
1300
1400
1550
1800
224.04
7400
7500
7650
7650
231.07
7105
7200
7500
7500
224.01
5567
5900
6500
6500
229
3672
3700
3800
3800
221.03
5518
5600
5600
5600
224.05
1850
2300
3500
4200
225.01
3423
3550
3550
3550
224.03
4513
4600
4600
4600
231.04
3235
3235
3325
3325
226
4292
4400
4600
4600
231.03
4467
4467
4500
4500
221.01
4256
4550
5060
5060
235
2155
2155
2155
2155
221.05
2317
2500
2650
2650
221.04
4399
4399
4500
4700
228.01
2540
2540
2540
2540
FORTHOODST
US 190
HWY
TRIMMIERRD
WSYOUNGDR
RANCIER AVE
CHAPARRAL RD
STAN SCHLUETER LP
STAGECOACH RD
ELMS RD
38TH
ST
CENTRAL TEXAS EXPY
LAKE RD
WESTCLIFF RD
2NDST
10THST
GRAYST
ONIONRD
VETERANS
MEMORIAL
BLVD
ZEPHYR RD
SHAWNDR
OLDFM440FM
REESE CREEK RD
FAWN DR
60THST
CLEAR CREEK RD
MESADR
WATERCREST RD
CHANTZDR
JASPER DR
JANISDR
ILLINOIS AVE
ROSEWO
OD
DR
GUS DR
TEALDR
CUNNINGHAM
RD
EASTTRIMMIERRD
E AVE
TERRACE DR
JIM AVE
RUIZDR
G AVE
WINDFIELDDR
FLORENCERD
TW
IN
CREEK
DR
ESTELLEAVE
WA
T
E
R
ST
B AVE
ATKINSON DR
STONETREE
DR
LEVYLN
CONDER
S
T
ROYREYNOLDSDR
M
ARY
J ANE DR
EXCEL DR
YATESRD
JOHN RD
LOVE RD
DUNCAN AVE
IDA DR
GILMERST
GRANEX DR
STALLION DR
NEWT DR
HALLMARK AVE
CORA AVE
SILTSTONE LP
REINDR
P
LATINUMDR
BERMUDADR
WEST LN
POAGE AVE
LOWES
BLVD
GOODEDR
FARHILLS DR
18THST
EDGEFIELD ST
LITTLE
NOLAN
RD
CITRINEDR
LEO LN
ROBINETTRD
ALVINDR
CLAIRIDGE AVE
TALLWOODDR
TAFT ST
C AVE
NINA DR
ROY J SMITH DR
JAMES LP
POLKST
ANDOVERDR
FIELDCREST DR
VEGA LN
VAHRENKAMP DR
LAVA LN
I AVE
HOOTENST
VIOLA DR
MARTIN
LU
TH
E
R
KING
JR BLVD
LIBRADR
SHERMANDR
GOWENDR
R
A
M
P
SHIMLADR
ATLAS AVE
WESTWOOD DR
FOSTERLN
HERNDONDR
JASMINELN
SULFUR SPRIN
G
DR
GEMINI LN
WATEROAKD
R
WILLOW
SPRINGSRD
LAUR A
DR
ANNA LEE DR
VALLEY
RD
PINEDR
WALESDR
BUNNYTRL
DIANA DR
TOWER HILL LN
G
REENLEE
D R
HITCHROCKDR
GREENGATE DR
GOLDEN GATE DR
TURKEYTROTRD
SCHWALD RD
SCHORN
D
R
46THST
BURK
D
R
6TH
ST
OAK
HILL
DR
BECKERDR
ESTES DR
RIOBLVD
JOHN HELEN DR
HANK DR
MONEYPITRDLOOP RD
AUBURN DR
WEISS DR
BOWLESDR
LEGACY LN
CACTUS DR
ACORNCREEK
TRL
D
O
FFY DR
GROVE DR
28THST
FEATHERLINERD
VARDEMAN A
VE
CINCH DR
MOSAIC
TRL
BELLAIRE DR
SCHOTTISCHE LN
BRISTOL DR
CHRISTIEDR
THUNDER CREEK
DR
BACON RANCH RD
NATURAL LN
42NDST
KELLEYLN
OAKALLARD
BRANCHDR
WAGONWHEELDR
HEMLOCK DR
OLDFLORENCERD
RAINLILY
ST
AGATE DR
MIKULEC DR
CROCKETTDR
PRIVATE
PRIVATE
WESTRIMDR
SWANN
ER
LP
BRIDLEDR
BILLS
RD
BRIDGEWOODDR
SANDSTONE DR
BACHELORBUTTONBLVD
DAN
DR
CEDARHILLDR
SALT FORK DR
BLAK E ST
LLEWELLYN
DR
TURNER AVE
SERPENTINE DR
ERIC DR
A
LAN CIR
PRIVATE DR
LUXOR DR
TIFFANY CIR
SILVERHILLDR
PENNINGTONAVE
GOLDEN DR
SH
ADY
DR
TATONKA DR
SANTE FE DR
LANCE LOO
P
SUNNY LN
OAK
VALLEYDR
POWDER RIVER
DR
ALMA DR
COY
D R
CHESTNUTDR
BOWFIELDDR
OMAR DR
DRACO
DR
40THST
JOSEPHDR
LAK
ECREST DR
FAIRVIEW
DR
CEDAR RIDGE CIR
SPARROWRD
ALLEGANYDR
DOGWOODBLVD
ZINC DR
FM
3481
RD
SEARCYDR
TYRELDR
MORNING GLEN
LN
TUMBLEWEEDDR
GAIL ST
8THST
PLAZA DR
LAURENLEADR
SOUTHERNBELLEDR
ADEELDR
BRYCE AVE
COMMERCE DR
CARINADR
MULFORDST
ALI DR
LOISLN
LAURENMACKENZIEDR
LITTLE AVE
LARRYLN
BLA
Y
NEYDR
PERSIMM
ON
DR
SYLVIADR
LONE
LY
OAK
LN
ALEXANDERST
BARBED WIRE DR
G
ARY LP
LEWIS
ST
IVORYLN
PEBBLE
DR
GALLO
P DR
KILPATRICK
DR
MAXDALERD
GOODHUEDR
VAILDR
MANDALAY DR
CLOUD
LN
FLANIGANDR
RIMES RANCH DR
CROSS
DR
HEREFORDLN
HUNTERSRIDGETRL
UNIONGROVEPARK
RD
DONNE AVE
MENARDDR
PERSEUS DR
WILLOWSWAY
ED
G
EW
O
O
D
D
R
JENNIFER
DR
SHEILA DR
TUDORDR
REPUBLIC OF TEXAS DR
CHIPS DR
AMBROSE DR
DAYTONDR
HACKBERRY
DR
CHET EDWARDS LP
CLOUDST
FOLLYDR
BELL TOWER RD
ASA
DR
KUM-OK LN
RIVERSIDEDR
KYARADR
RAMP
OLD F M 440 FM
RAMP
US 190
HWY
BACON RANCH RD
ELMS RD
ROY REYNO
L
DSDR
RAMP
FORT
HOOD
ST
RAMP
Ushy 190
Sthy195
TrimmerRd
E Rancier Ave
SWSYoungDr
Farm
ToMarketRoad2484
SFortHoodSt
Battalion Ave
Indian
Trl
E Elms Rd
Clear Creek Rd
E Stagecoach Rd
Westcliff Rd
E Stan Schlueter Lp
W
Veterans Memorial Blvd
HoodRd
N38thSt
Zephyr Rd
Tank Destroyer Blvd
Central Dr
E Farm To Market Road 2410
Lake Rd
S
AnnBlvd
NRoyReynoldsDr
Farm To Market Road 439
Stonetree D
r
CunninghamRd
NWSYoungDr
E Veterans Memorial Blvd
NolaRuthBlvd
Mountain Lion Rd
N10thSt
W Jasper Dr
NFortHoodSt
Farm
To
M
arketRoad
440
N
C
entral Texas Expy
W
Farm To Market Road 2410
Terminal Ave
ClearCreekRd
W Veterans Memorial Blvd
Sthy195
Sthy195
Ushy 190
Tank Destroyer Blvd
FIGURE 2-2
CITY OF KILLEEN
SERVICE POPULATION
BY CENSUS TRACT
Created by Freese and Nichols, Inc.
Job No.: KIL11275
Location: H:W_WW_PLANNINGDELIVERABLESH:W_WW_PLANNINGDELIVERABLES11-Final_W_WW_Report(Figure-2-2)-Population_Census_Tract.mxd
Updated: October 16, 2012
0 3,200 6,400
SCALE IN FEET
I
LEGEND
Census Tract
Lake
Stream
Road
Parcel
City Limits
ETJ
2012 Population = 131,474
2017 Population = 139,919
2022 Population = 151,330
2032 Population = 179,825
21. Water and Wastewater Master Plan
City of Killeen
3-1
3.0 WATER DEMANDS
A water utility must be able to supply water at rates that fluctuate over time. Yearly, monthly, daily, and
hourly variations in water use occur, with higher use during dry years and in hot months. Also, water
use typically follows a diurnal pattern, being low at night and peaking in the early morning and late
afternoon. Flow rates most important to the hydraulic design and operation of a water treatment plant
and distribution system are average day (AD), maximum day (MD), and peak hour (PH) demands.
Average day use is the total annual water use divided by the number of days in the year. The average
day demand rate is used as a basis for estimating maximum day and peak hour demands. Maximum day
demand is the maximum quantity of water used on any one day of the year. Water supply facilities are
typically designed based on the maximum day demand. Peak hour use is the peak rate at which water is
required during any one hour of the year. Since minimum distribution pressures are usually experienced
during peak hour, the sizes and locations of distribution facilities are generally determined based on this
condition.
3.1 HISTORICAL WATER DEMANDS
Reviewing historical water demands provides insight into selecting design criteria used to project future
water demands. Historical monthly water usage records were analyzed from 2000 through 2011. The
City provided recent water usage data consisting of monthly production and maximum day
consumption. Historical annual average day demand, maximum day to average day peaking factors, and
per-capita consumption are summarized in Table 3-1. The historical water usage shows that the City of
Killeen has a relatively low average per-capita consumption and maximum day demand peaking factor
compared to other cities in the area. This is likely due to lower irrigation demands caused by a higher
percentage of multi-family homes and lower percentage of homes with automatic sprinkler systems.
22. Water and Wastewater Master Plan
City of Killeen
3-2
Table 3-1: Historical Water Usage
Year Population
Average Day
Demand (mgd)
Average Per-
capita (gpcd)
Maximum Day
Demand (mgd)
MD:AD
Peaking
Factor
2000 86,911 10.56 122 18.26 1.73
2001 89,858 11.41 127 18.80 1.65
2002 93,587 12.09 129 19.84 1.64
2003 100,911 12.28 122 21.12 1.72
2004 102,461 10.86 106 16.75 1.54
2005 104,032 12.10 116 21.17 1.75
2006 105,604 13.06 124 - -
2007 112,434 11.96 106 - -
2008 116,934 15.02 128 - -
2009 119,510 14.13 118 - -
2010 127,921 13.87 108 23.17 1.67
2011 128,967 16.19 126 24.97 1.54
Average 119 1.67
Note: Maximum Day Demand data was not available from 2006 through 2009 due to meter accuracy.
Water Demand data from 2000 through 2004 was acquired from the 2007 Water and Wastewater
Master Plan.
3.2 PROJECTED WATER DEMANDS
Water demands were projected for 2012, 2017, 2022, and 2032 conditions. The evaluation of historical
data provided a basis for determining the design criteria used to project water demands. Average day
per capita water usage ranged from 106 gpcd to 129 gpcd, with an average of 119 gpcd over the last 11
years. Based on the review of this data and the need to plan for low rainfall (dry) years with minimal
water restrictions, FNI recommends using an average day demand of 130 gpcd. In selecting a peaking
factor to project maximum day demands, FNI reviewed historical peaking factors and the years in which
those peaking factors occurred, as just using the highest values for per-capitas and peaking factors may
not be representative. Historical water usage data indicated the maximum day to average day peaking
factor ranged from 1.54 to 1.75 over the last 11 years; however, data prior to 2010 may be inaccurate
due to water meter accuracy issues. In 2010, the City installed new meters at the pump stations, so
water is being measured more accurately. The peaking factors for the last two years ranged from 1.54
to 1.67; therefore, a peaking factor of 1.65 was selected for future year demands given the data from
the past two years. Hourly SCADA data was reviewed to determine a peak hour to maximum day
peaking factor. The maximum hourly peaking factors were generally between 1.5 and 1.8, so a peak
23. Water and Wastewater Master Plan
City of Killeen
3-3
hour to maximum day peaking factor of 1.7 was selected to project future peak hour demands. Figure
3-1 illustrates the historical and projected water demands for the City of Killeen.
Figure 3-1: Historical and Projected Water Demands
The populations by census tract, shown on Figure 2-2, were overlaid with pressure plane boundaries and
used to distribute water demands by pressure plane throughout the City. The projected population and
water demands are summarized by pressure plane for each planning period in Tables 3-2 through 3-5. It
should be noted that the existing Douglas Mountain Pressure Plane will be incorporated into the Upper
Pressure Plane with the construction of a new water transmission line and the decommissioning of the
Douglas Mountain Ground Storage Tanks (Project 2W).
17.09 18.19 19.67
23.38
28.20
30.01
32.46
38.57
47.94
51.02
55.18
65.57
0
10
20
30
40
50
60
70
1995 2000 2005 2010 2015 2020 2025 2030 2035
WaterDemand(mgd)
Year
Average Day Maximum Day Peak Hour
ProjectedHistorical
24. Water and Wastewater Master Plan
City of Killeen
3-4
Table 3-2: 2012 Water Demand Projections by Pressure Plane
Pressure
Plane Population
Average
Per-capita
(gpcd)
Average
Day
Demand
(mgd)
MD:AD
Peaking
Factor
Maximum
Day
Demand
(mgd)
PH:MD
Peaking
Factor
Peak Hour
Demand
(mgd)
Lower 67,162 130 8.73 1.65 14.41 1.7 24.49
Middle 5,584 130 0.73 1.65 1.20 1.7 2.04
Upper 48,668 130 6.33 1.65 10.44 1.7 17.75
Douglas Mt* 4,023 130 0.52 1.65 0.86 1.7 1.47
Airport 6,037 130 0.78 1.65 1.29 1.7 2.20
2012 Total 131,474 17.09 28.20 47.95
*Project 2W will result in the Douglas Mountain Pressure Plane being incorporated into the Upper
Pressure Plane before 2017.
Table 3-3: 2017 Water Demand Projections by Pressure Plane
Pressure
Plane Population
Average
Per-capita
(gpcd)
Average
Day
Demand
(mgd)
MD:AD
Peaking
Factor
Maximum
Day
Demand
(mgd)
PH:MD
Peaking
Factor
Peak Hour
Demand
(mgd)
Lower 72,463 130 9.42 1.65 15.54 1.7 26.42
Middle 5,736 130 0.75 1.65 1.23 1.7 2.09
Upper 54,508 130 7.09 1.65 11.69 1.7 19.88
Airport 7,212 130 0.94 1.65 1.55 1.7 2.63
2017 Total 139,919 130 18.20 1.65 30.01 1.7 51.02
Table 3-4: 2022 Water Demand Projections by Pressure Plane
Pressure
Plane Population
Average
Per-capita
(gpcd)
Average
Day
Demand
(mgd)
MD:AD
Peaking
Factor
Maximum
Day
Demand
(mgd)
PH:MD
Peaking
Factor
Peak Hour
Demand
(mgd)
Lower 78,612 130 10.22 1.65 16.86 1.7 28.67
Middle 5,907 130 0.77 1.65 1.27 1.7 2.15
Upper 59,057 130 7.68 1.65 12.67 1.7 21.54
Airport 7,754 130 1.01 1.65 1.66 1.7 2.83
2022 Total 151,330 130 19.68 1.65 32.46 1.7 55.19
25. Water and Wastewater Master Plan
City of Killeen
3-5
Table 3-5: 2032 Water Demand Projections by Pressure Plane
Pressure
Plane Population
Average
Per-capita
(gpcd)
Average
Day
Demand
(mgd)
MD:AD
Peaking
Factor
Maximum
Day
Demand
(mgd)
PH:MD
Peaking
Factor
Peak Hour
Demand
(mgd)
Lower 93,867 130 12.20 1.65 20.13 1.7 34.23
Middle 6,040 130 0.79 1.65 1.30 1.7 2.20
Upper 69,749 130 9.07 1.65 14.96 1.7 25.43
Airport 10,169 130 1.32 1.65 2.18 1.7 3.71
2032 Total 179,825 130 23.38 1.65 38.57 1.7 65.57
26. Water and Wastewater Master Plan
City of Killeen
4-1
4.0 DESCRIPTION OF THE EXISTING WATER SYSTEM
The City of Killeen’s water distribution system consists of a network of water lines, four water supply
delivery points with associated ground storage tanks and pump stations, two booster pump stations,
five elevated storage tanks, four ground storage tanks acting as elevated storage, and one pressure
reducing valve. Figure 4-1 shows the existing water distribution system for the City of Killeen.
4.1 PRESSURE PLANES
The distribution system is separated into five pressure planes: Lower, Middle, Upper, Douglas Mountain
and Airport. The Lower Pressure Plane consists of the northern and eastern portions of the City and is
the largest pressure plane, accounting for approximately 51% of the City’s total water usage. Ground
elevations generally range from 715 feet to 910 feet. The Lower Pressure Plane operates at a static
hydraulic gradient of 1,000 feet. The Middle Pressure Plane is a relatively small area between the Upper
and Lower Pressure Planes that is supplied by a pressure reducing valve from the Upper Pressure Plane.
Ground elevations range from 845 feet to 920 feet and are slightly too high to be served from the Lower
and slightly too low to be served from the Upper. The Upper Pressure Plane is the City’s second largest
plane and generally consists of the western portion of the City. Ground elevations range from 860 feet
to 1,025 feet. The Upper Pressure Plane is operated at a static hydraulic gradient of 1,125 feet. The
Douglas Mountain Pressure Plane is an area in the southern portion of the City that was previously
served by West Bell County Water Supply Corporation. Killeen incorporated the existing facilities in the
area into the distribution system and currently supplies water to the area through the Upper Pressure
Plane. The overflow elevation of the Douglas Mountain tanks is 1,099 feet. The Airport Pressure Plane
includes the area in the southwestern portion of the City with higher ground elevations ranging from
950 feet to 1,035 feet. A static hydraulic gradient of 1,164.5 feet is established by one elevated storage
tank. A schematic profile of the existing water distribution system showing elevations and connectivity
is presented on Figure 4-2.
29. Water and Wastewater Master Plan
City of Killeen
4-4
46.3%
29.6%
11.0%
7.1%
5.6% 0.4%
4.2 WATER LINES
The City of Killeen’s distribution system consists of 617 miles of water lines. Pipeline diameters range in
size from 1-inch to 30-inches. Figure 4-3 illustrates the percentage of pipe length by diameter. The
majority of the pipes are PVC, along with asbestos cement, cast iron, and ductile iron. Figure 4-4 shows
a summary of the pipe material based on the City’s GIS data. A large portion of the water lines list
“unknown” in the material field in the GIS. Additionally, the installation date is not defined in the GIS
data. Research of as-built drawings and field investigation would be required to populate these
attributes.
Figure 4-3: Pipeline Diameter by Length Figure 4-4: Pipeline Material by Length
Figure 4-3: Pipeline Diameter by Length
Figure 4-4: Pipeline Material by Length
4.3 WHOLESALE WATER SUPPLY
The City acquires water from a wholesale water supplier to provide service to its residents. Currently,
the City exclusively purchases treated surface water from Bell County Water Control and Improvement
District #1 (BCWCID#1). The surface water that BCWCID#1 treats and then delivers to Killeen is part of
the 39,000 acre-feet/year of raw water that Killeen has secured in Lake Belton. The existing maximum
daily supply of treated water is 32.0 mgd. The City of Killeen receives the treated water at four delivery
points.
0.0%
5.0%
10.0%
15.0%
20.0%
25.0%
30.0%
35.0%
40.0%
45.0%
50.0%
1-inch
2-inch
3-inch
4-inch
5-inch
6-inch
8-inch
10-inch
12-inch
16-inch
18-inch
20-inch
24-inch
30-inch
30. Water and Wastewater Master Plan
City of Killeen
4-5
4.4 PUMP STATIONS
Pump Stations #2, #3, #5, and #6 are wholesale supply facilities. Pump Stations #2, #3, and #5 supply
the Lower Pressure Plane, while Pump Station #6 supplies the Upper Pressure Plane. The City also
operates two booster pump stations. Pump Station #4 is supplied from the Lower Pressure Plane,
primarily from Pump Station #3, and discharges into the Upper Pressure Plane with Pump Station #6.
The Airport Pump Station is supplied by the Upper Pressure Plane and is the only supply for the Airport
Pressure Plane. Table 4-1 provides a summary of the pumping facilities within Killeen’s distribution
system.
4.5 STORAGE FACILITIES
The City currently utilizes 12 ground storage tanks (GSTs) within the distribution system. Seven GSTs are
located at wholesale delivery points and provide supply to the associated pump stations. Three 5.0 MG
GSTs at Pump Station #6 are shared with Fort Hood and Copperas Cove. The Pump Station #4 facility
also includes a GST that is supplied by the Lower Pressure Plane. The remaining four GSTs are located
at higher ground elevations and provide elevated storage for the Upper and Douglas Mountain Pressure
Planes.
Additionally, five elevated storage tanks (ESTs) are located throughout the distribution system. The Park
Street EST, Bundrant EST, Rodeo EST, and Southeast EST serve the Lower Pressure Plane. The remaining
EST is located in the Airport Pressure Plane. Table 4-2 presents a summary of the City’s existing ground
storage tanks, and Table 4-3 shows the elevated storage facilities.
31. Water and Wastewater Master Plan
City of Killeen
4-6
Table 4-1: Summary of Pumping Facilities
Pump Station Name
Pump
No.
Rated Capacity Rated Head
(feet) Pressure Plane(gpm) (mgd)
Pump Station #2
1 1,200 1.73 190 Lower
2 1,200 1.73 190 Lower
3 1,200 1.73 190 Lower
Total 3,600 5.19 - -
Firm 2,400 3.46 - -
Pump Station #3
1 2,450 3.53 165 Lower
2 2,450 3.53 165 Lower
3 2,450 3.53 165 Lower
4 2,450 3.53 165 Lower
Total 9,800 14.12 - -
Firm 7,350 10.59 - -
Pump Station #5
1 2,100 3.02 175 Lower
2 2,100 3.02 175 Lower
3 2,100 3.05 175 Lower
Total 6,300 9.06 - -
Firm 4,200 6.04 - -
Lower Total 20,800 29.95
Pump Station #4
1 2,550 3.67 220 Upper
2 2,550 3.67 220 Upper
3 2,550 3.67 220 Upper
4 2,550 3.67 220 Upper
Total 10,200 14.68 - -
Firm 7,650 11.01 - -
Pump Station #6
1 3,500 5.04 270 Upper
2 3,500 5.04 270 Upper
3 3,500 5.04 270 Upper
Total 10,500 15.12 - -
Firm 7,000 10.08 - -
Upper Total 19,500 28.08
Airport Pump Station
1 1,050 1.51 260 Airport
2 1,050 1.51 260 Airport
Firm 1,050 1.51 - -
Airport Total 2,100 3.02
SYSTEM TOTAL 42,400 61.05
32. Water and Wastewater Master Plan
City of Killeen
4-7
Table 4-2: Existing Ground Storage Tanks
Pressure
Plane Tank Name
Capacity
(MG)
Lower Pump Station #2 GST 2.0
Lower Pump Station #3 GST #1 5.0
Lower Pump Station #3 GST #2 5.0
Lower Pump Station #5 GST 2.5
Lower Pressure Plane Total 14.5
Upper Pump Station #4 GST 1.5
Upper Pump Station #6 GST #1 5.0
Upper Pump Station #6 GST #2 5.0
Upper Pump Station #6 GST #3 5.0
Upper Pressure Plane Total 16.5
TOTAL GROUND STORAGE 31.0
Note: GSTs at Pump Station #6 are shared facilities and owned by
BCWCID #1.
Table 4-3: Existing Elevated Storage Tanks
Pressure
Plane Tank Name
Capacity
(MG)
Overflow
Elevation
(feet)
Sidewater
Depth
(feet)
Lower Park Street EST 0.25 1,000 30
Lower Bundrant EST 1.50 1,000 40
Lower Rodeo EST 1.00 1,000 35
Lower Southeast EST 2.50 1,000 45
Lower Pressure Plane Total 5.25
Upper McMillan GST #1 1.50 1,125 32
Upper McMillan GST #2 1.50 1,125 32
Upper Pressure Plane Total 3.00
Douglas Mt. Douglas Mountain GST #1 0.63 1,099 30
Douglas Mt. Douglas Mountain GST #2 0.22 1,099 30
Douglas Mountain Pressure Plane Total 0.85
Airport Airport EST 1.00 1164.5 40
TOTAL ELEVATED STORAGE 10.10
33. Water and Wastewater Master Plan
City of Killeen
5-1
5.0 WATER SYSTEM ANALYSES AND HYDRAULIC MODELING
Hydraulic analyses were conducted utilizing the water model to identify deficiencies in the City of
Killeen’s existing water distribution system and to establish a capital improvements plan to improve the
existing system and meet projected water demands through 2032. Various combinations of
improvements and system modifications were investigated to determine the most appropriate approach
for meeting projected demands. Parameters used in developing the capital improvements plan included
increasing system reliability, renewing aging infrastructure, simplifying system operations, meeting
required fire flows, and maintaining proper residual pressures.
5.1 WATER MODEL DEVELOPMENT
FNI spent a significant amount of effort on water model development and calibration, as the model is a
valuable tool to evaluate system operation and serves as the basis for determining the timing of future
improvements. The City of Killeen’s water model was developed using H2OMap Water software by
Innovyze and consists of all pipes in the distribution system. The pipes were imported into the model
from the City’s Geographic Information System (GIS). The model includes approximately 15,800 pipes,
ranging in size from 3- to 30-inches. Initial Hazen-Williams roughness coefficients for pipes were
assigned based on the pipe material and are listed in Table 5-1. Because installation year was not
available in the GIS, the roughness coefficient could not be varied by pipe age. Some roughness
coefficients were adjusted during model calibration based on model results.
Table 5-1: Initial C-value Assignments
Pipe Material C-value
Cast Iron 100
Asbestos Cement, Unknown 110
Ductile Iron, Concrete Steel 120
PVC 130
All pumping, storage, and valve facilities were manually added to the model based on as-built drawings
and information provided by the City. Demands were allocated to the model using customer billing
accounts. The active water meters in August 2011 were spatially located, and the associated
consumption was assigned to the nearest model node.
Several rounds of field pressure testing were conducted to collect data for use in model calibration.
Fifteen pressure recorders were installed throughout the Lower Pressure Plane from July 22 to August 2,
34. Water and Wastewater Master Plan
City of Killeen
5-2
2011. A second round of pressure testing was done with 15 recorders in the Upper, Middle, Airport, and
Douglas Mountain Pressure Planes from August 2 to 12, 2011. Shortly after this pressure recording
period, City staff located several closed valves along a transmission main in the Upper Pressure Plane
that should have been open. In order to calibrate to a typical operating condition, 16 pressure recorders
were installed again in the Upper Pressure Plane once the valves were opened. This testing period was
from September 12 to 19, 2011. Initial model calibration results from the August and September field
testing revealed some discrepancies in the modeled versus recorded data. After further investigation by
City staff, several valves that should be closed to isolate the Upper and Lower Pressure Planes were
found to be open. To get a better understanding of the system operation, it was decided to conduct an
additional round of pressure recording. This time, 15 pressure recorders were installed in all of the
pressure planes simultaneously from December 20 to 30, 2011. Additionally, during the third round of
pressure recording three pressure recorders were placed on the transmission line from Pump Station #3
to Pump Station #4. The data from these pressure recorders provided valuable insight into the
operation of the Pump Station #4 ground storage tank. A summary of the pressure recording data for
the December 2011 testing is shown on Figures 5-1 through 5-3. The locations of the pressure recorders
can be found on Figure 5-4.
35. Water and Wastewater Master Plan
City of Killeen
5-3
Figure 5-1: Pressure Recording Data for Lower Pressure Plane
36. Water and Wastewater Master Plan
City of Killeen
5-4
Figure 5-2: Pressure Recording Data for Upper, Middle, and Douglas Mt.
37. Water and Wastewater Master Plan
City of Killeen
5-5
Figure 5-3: Pressure Recording Data for Transmission Main to PS #4