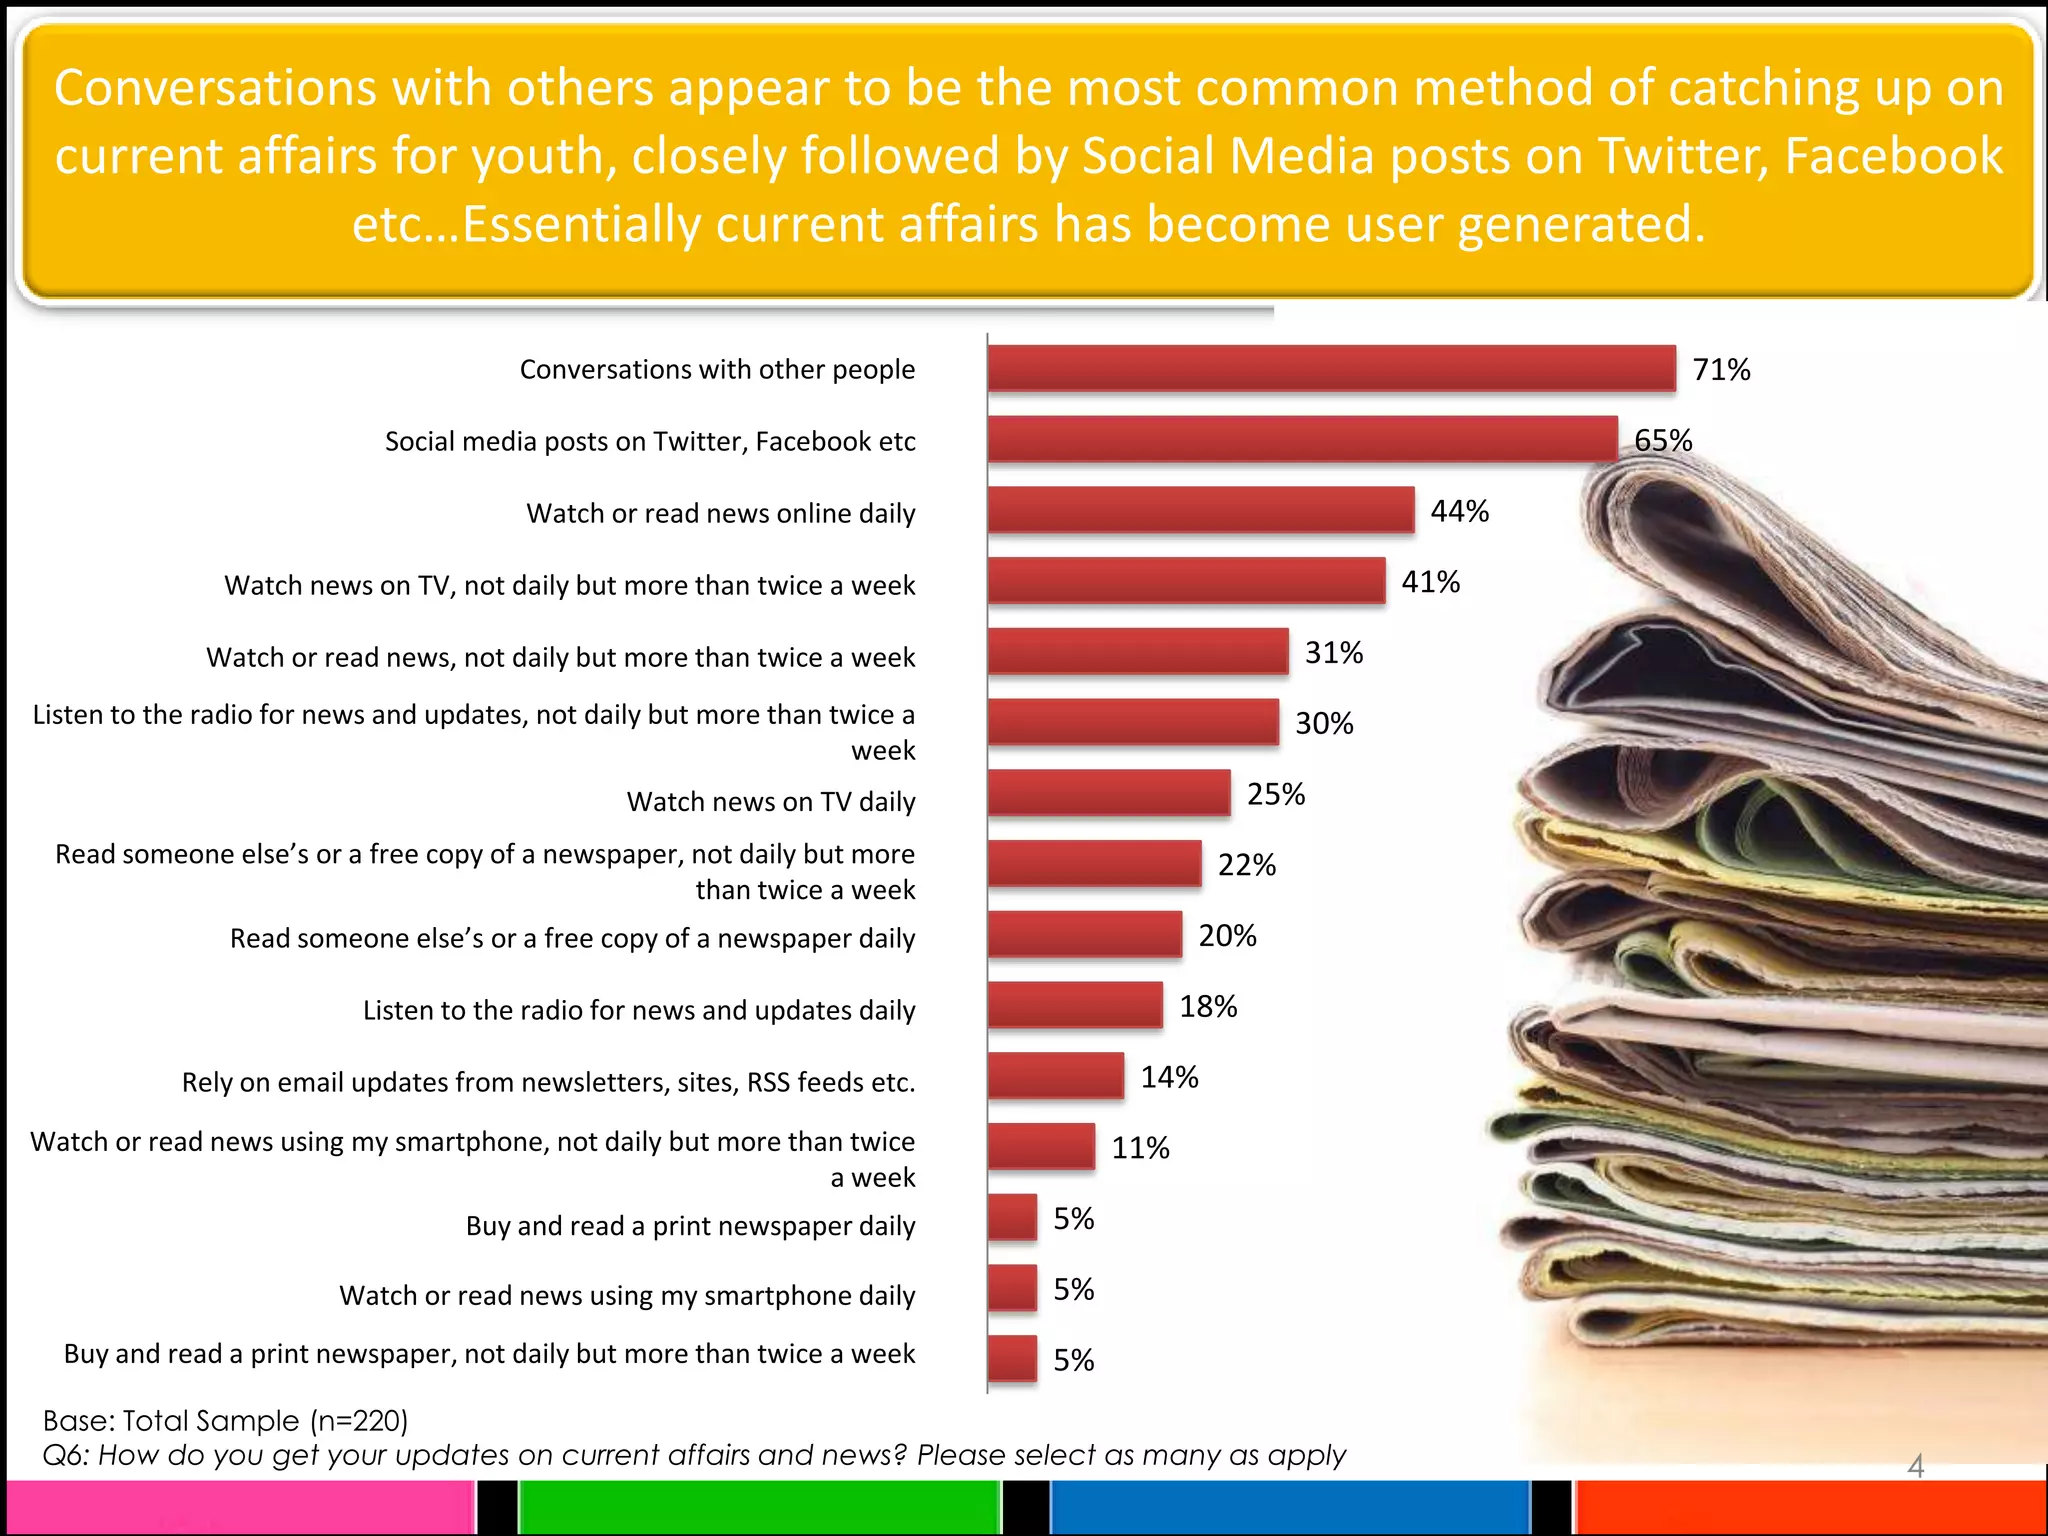
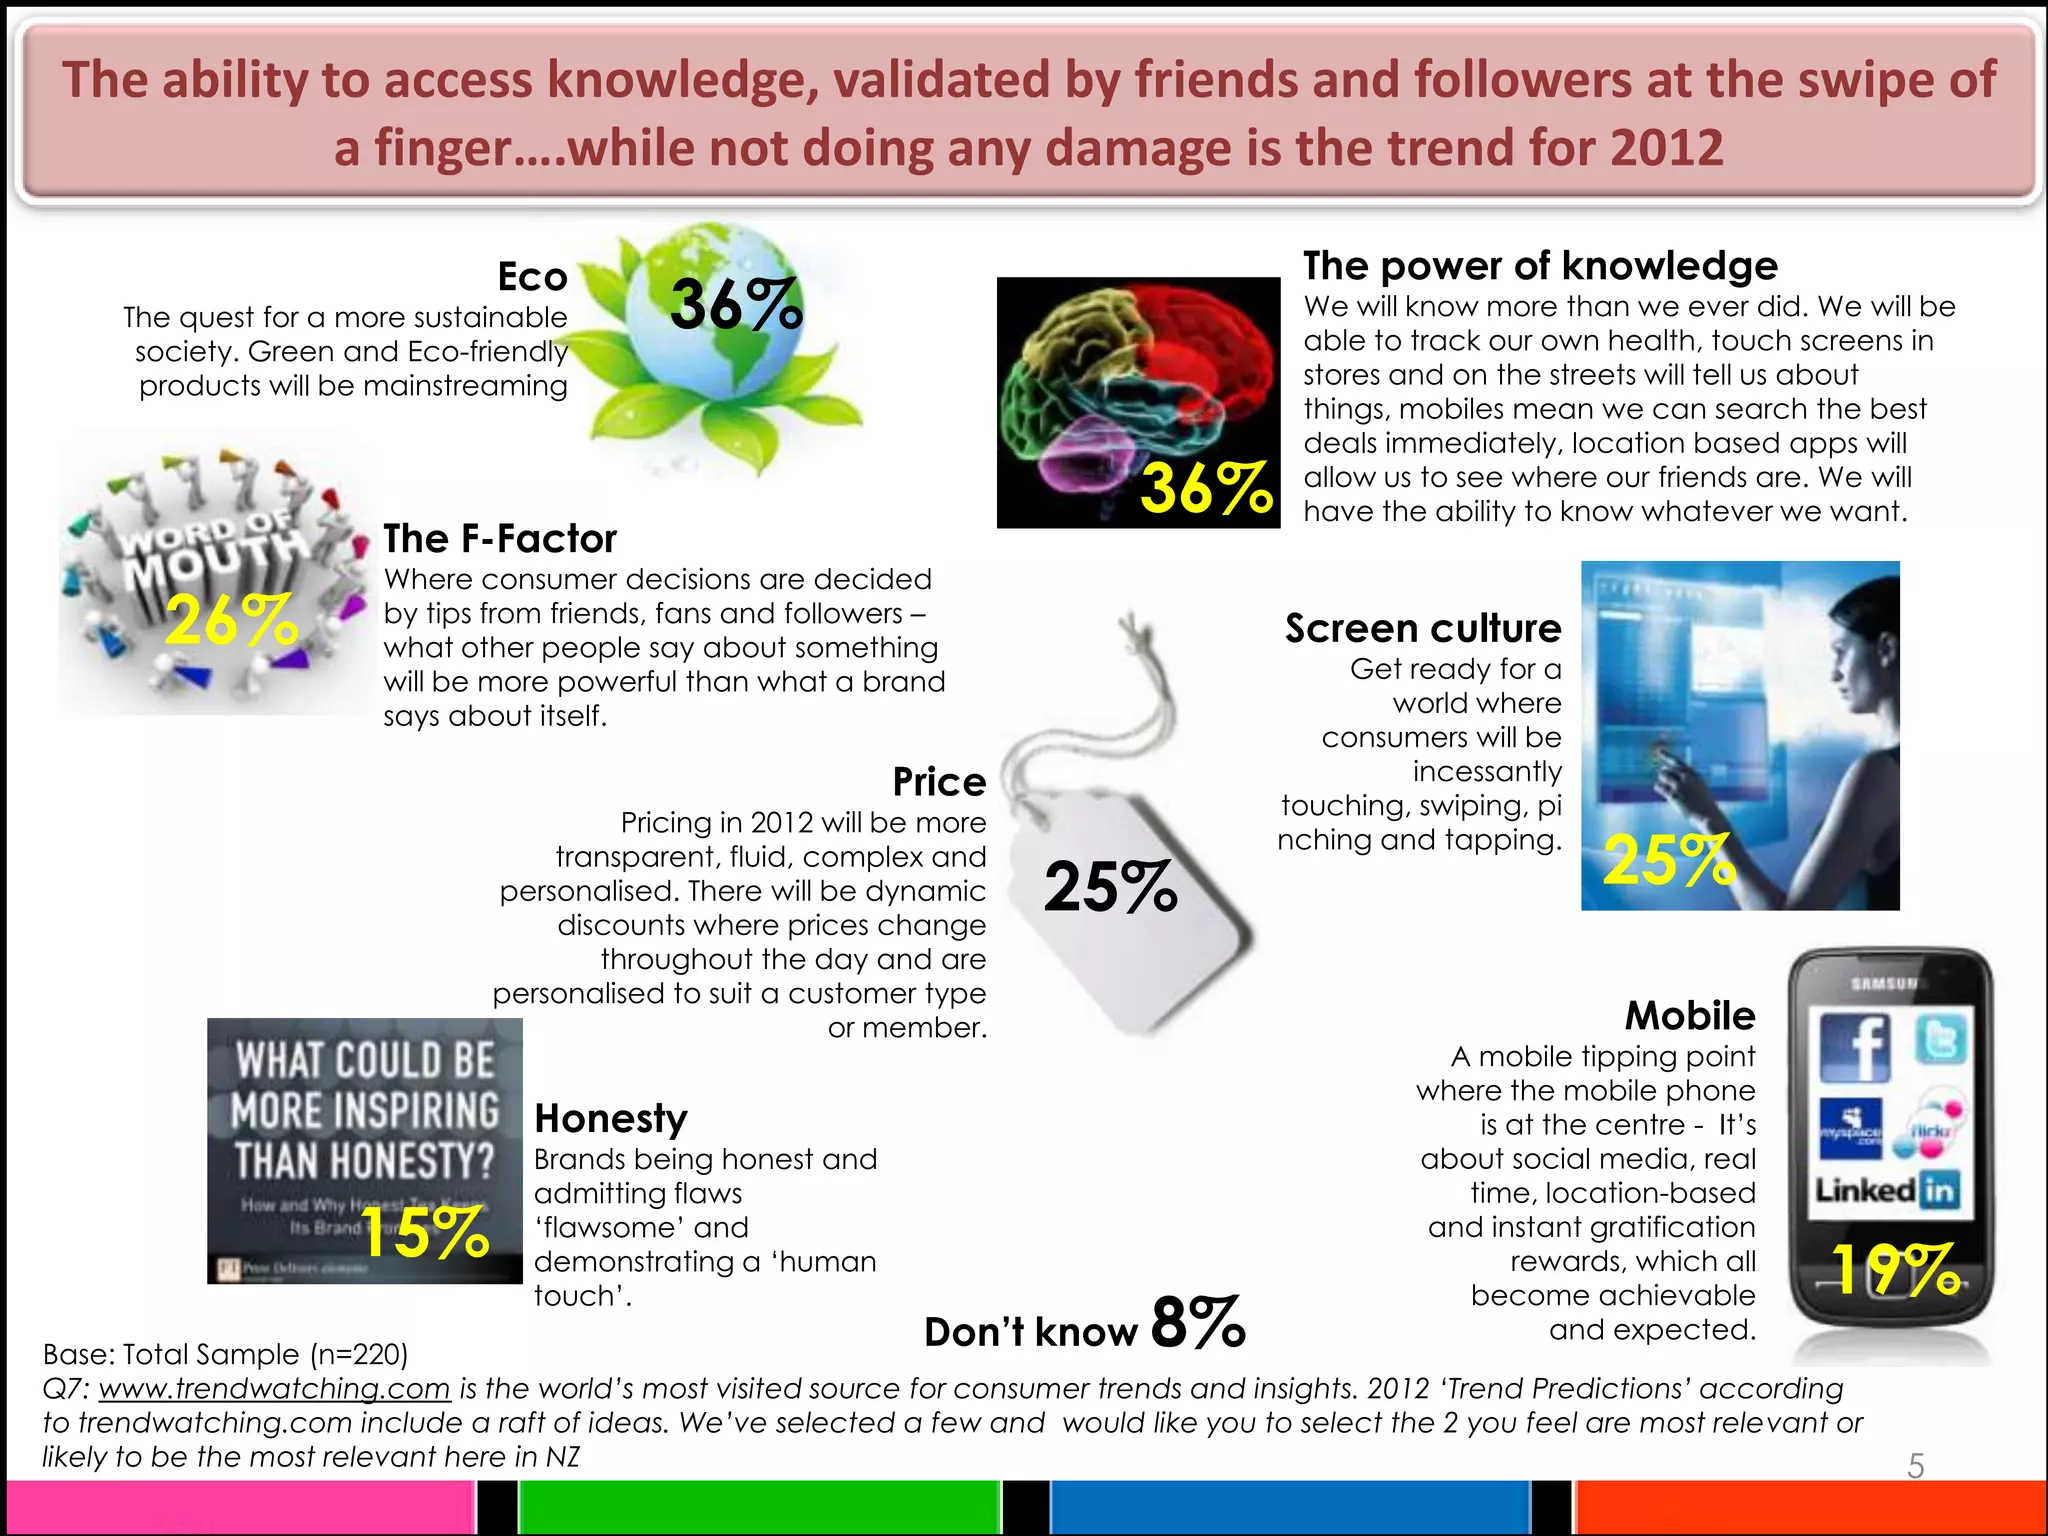
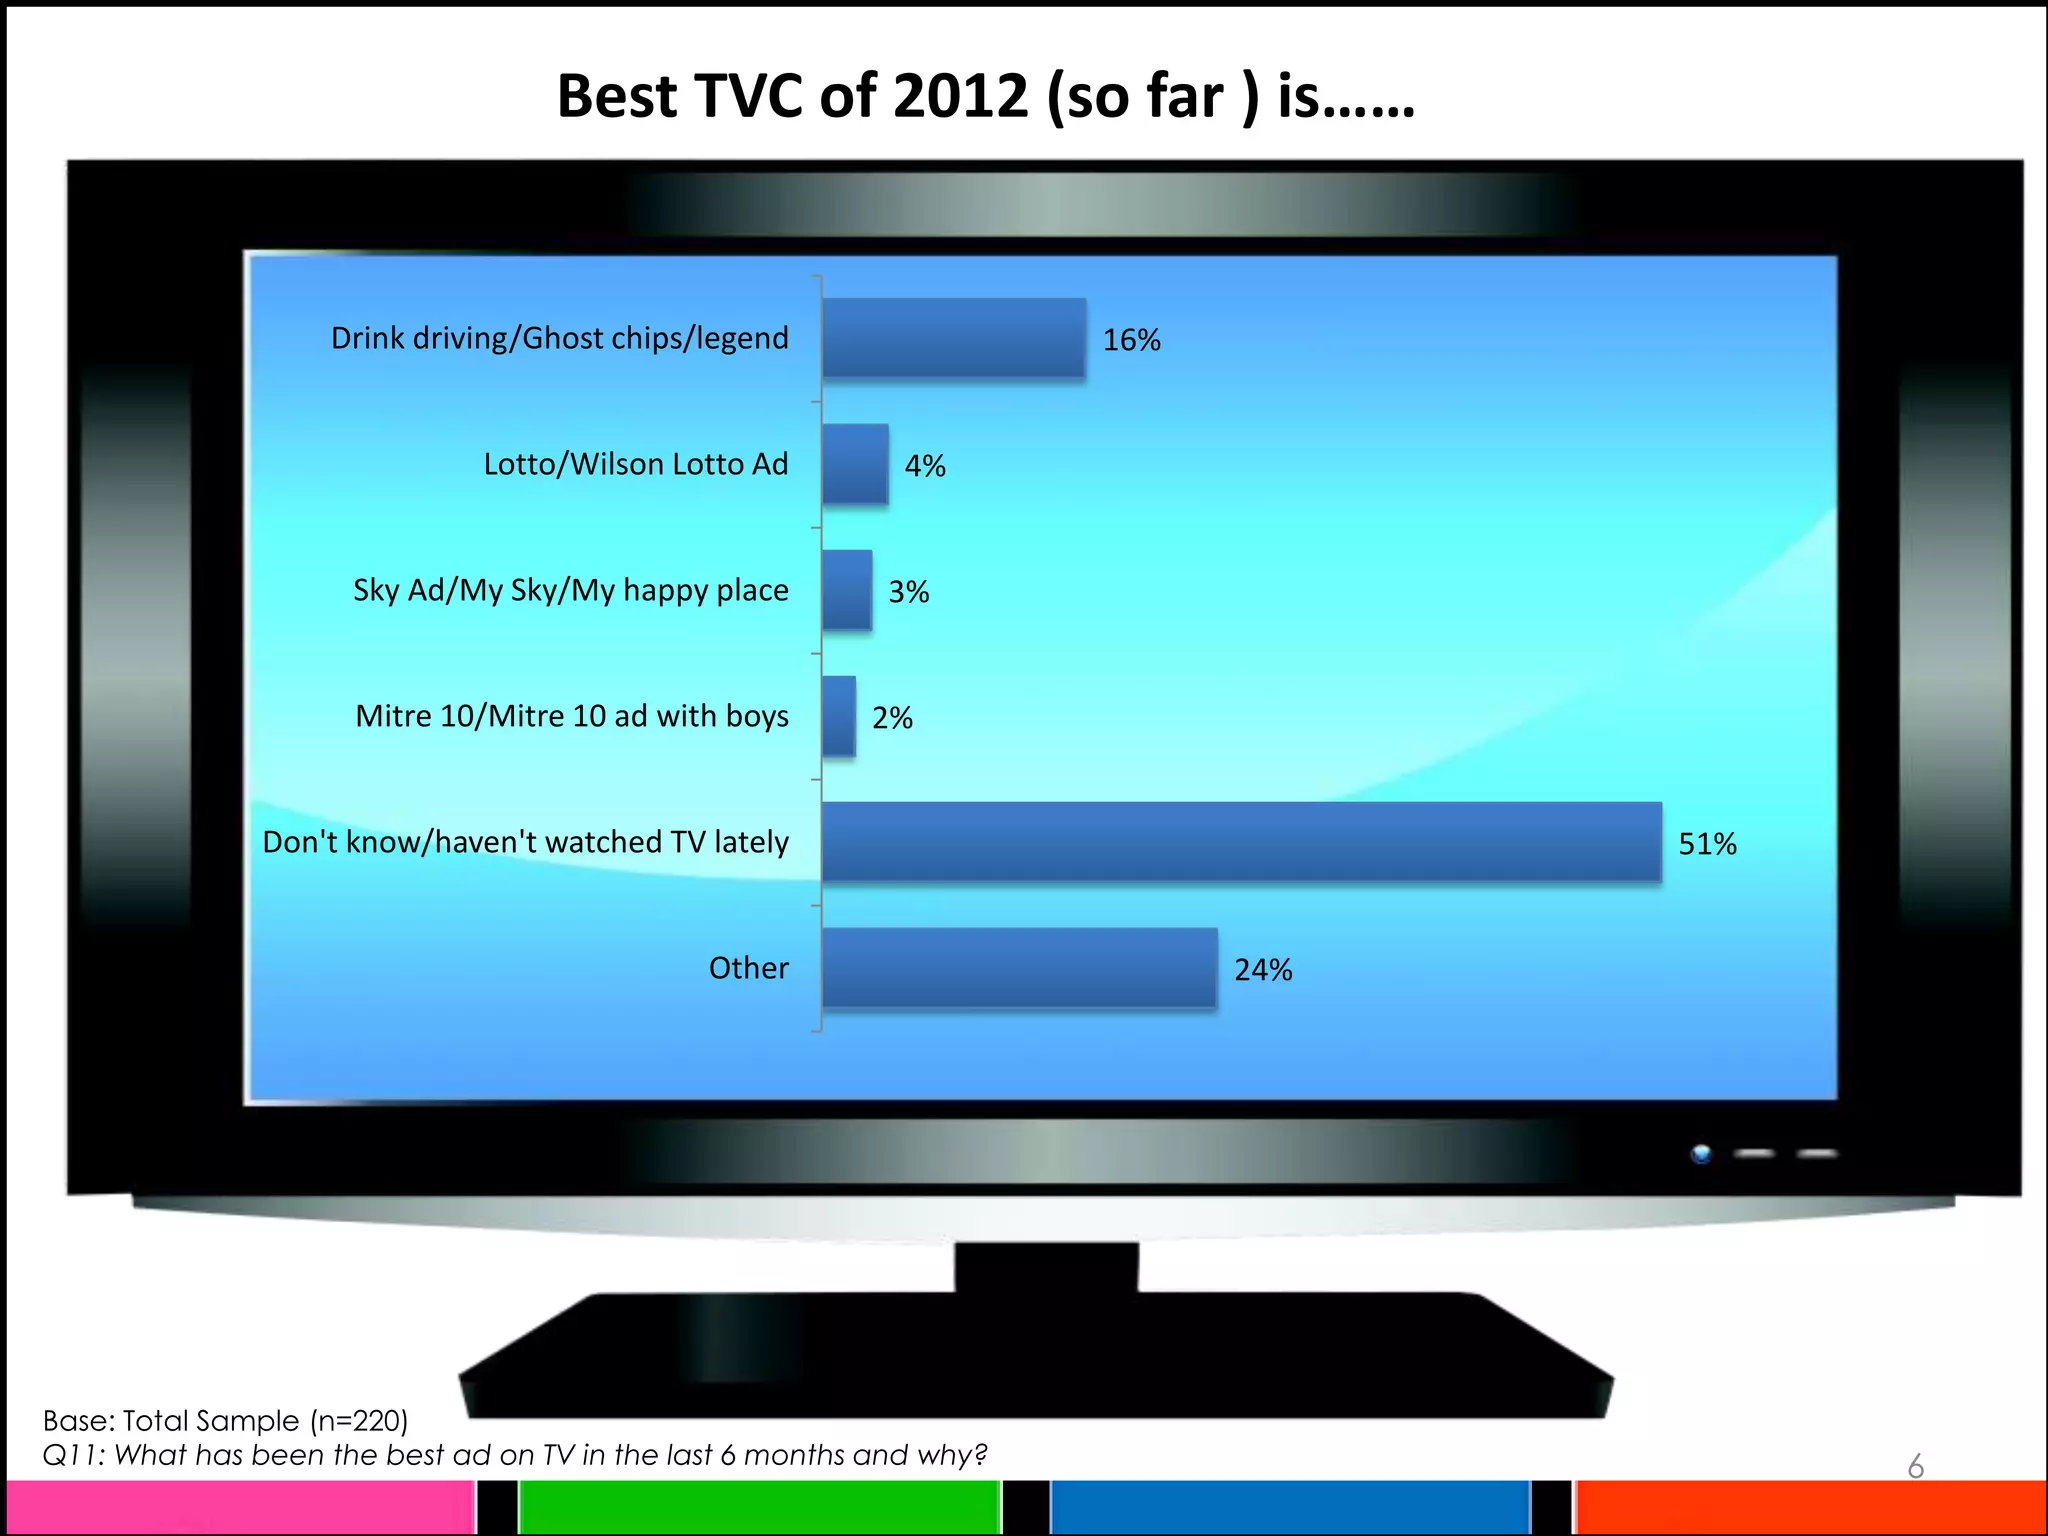
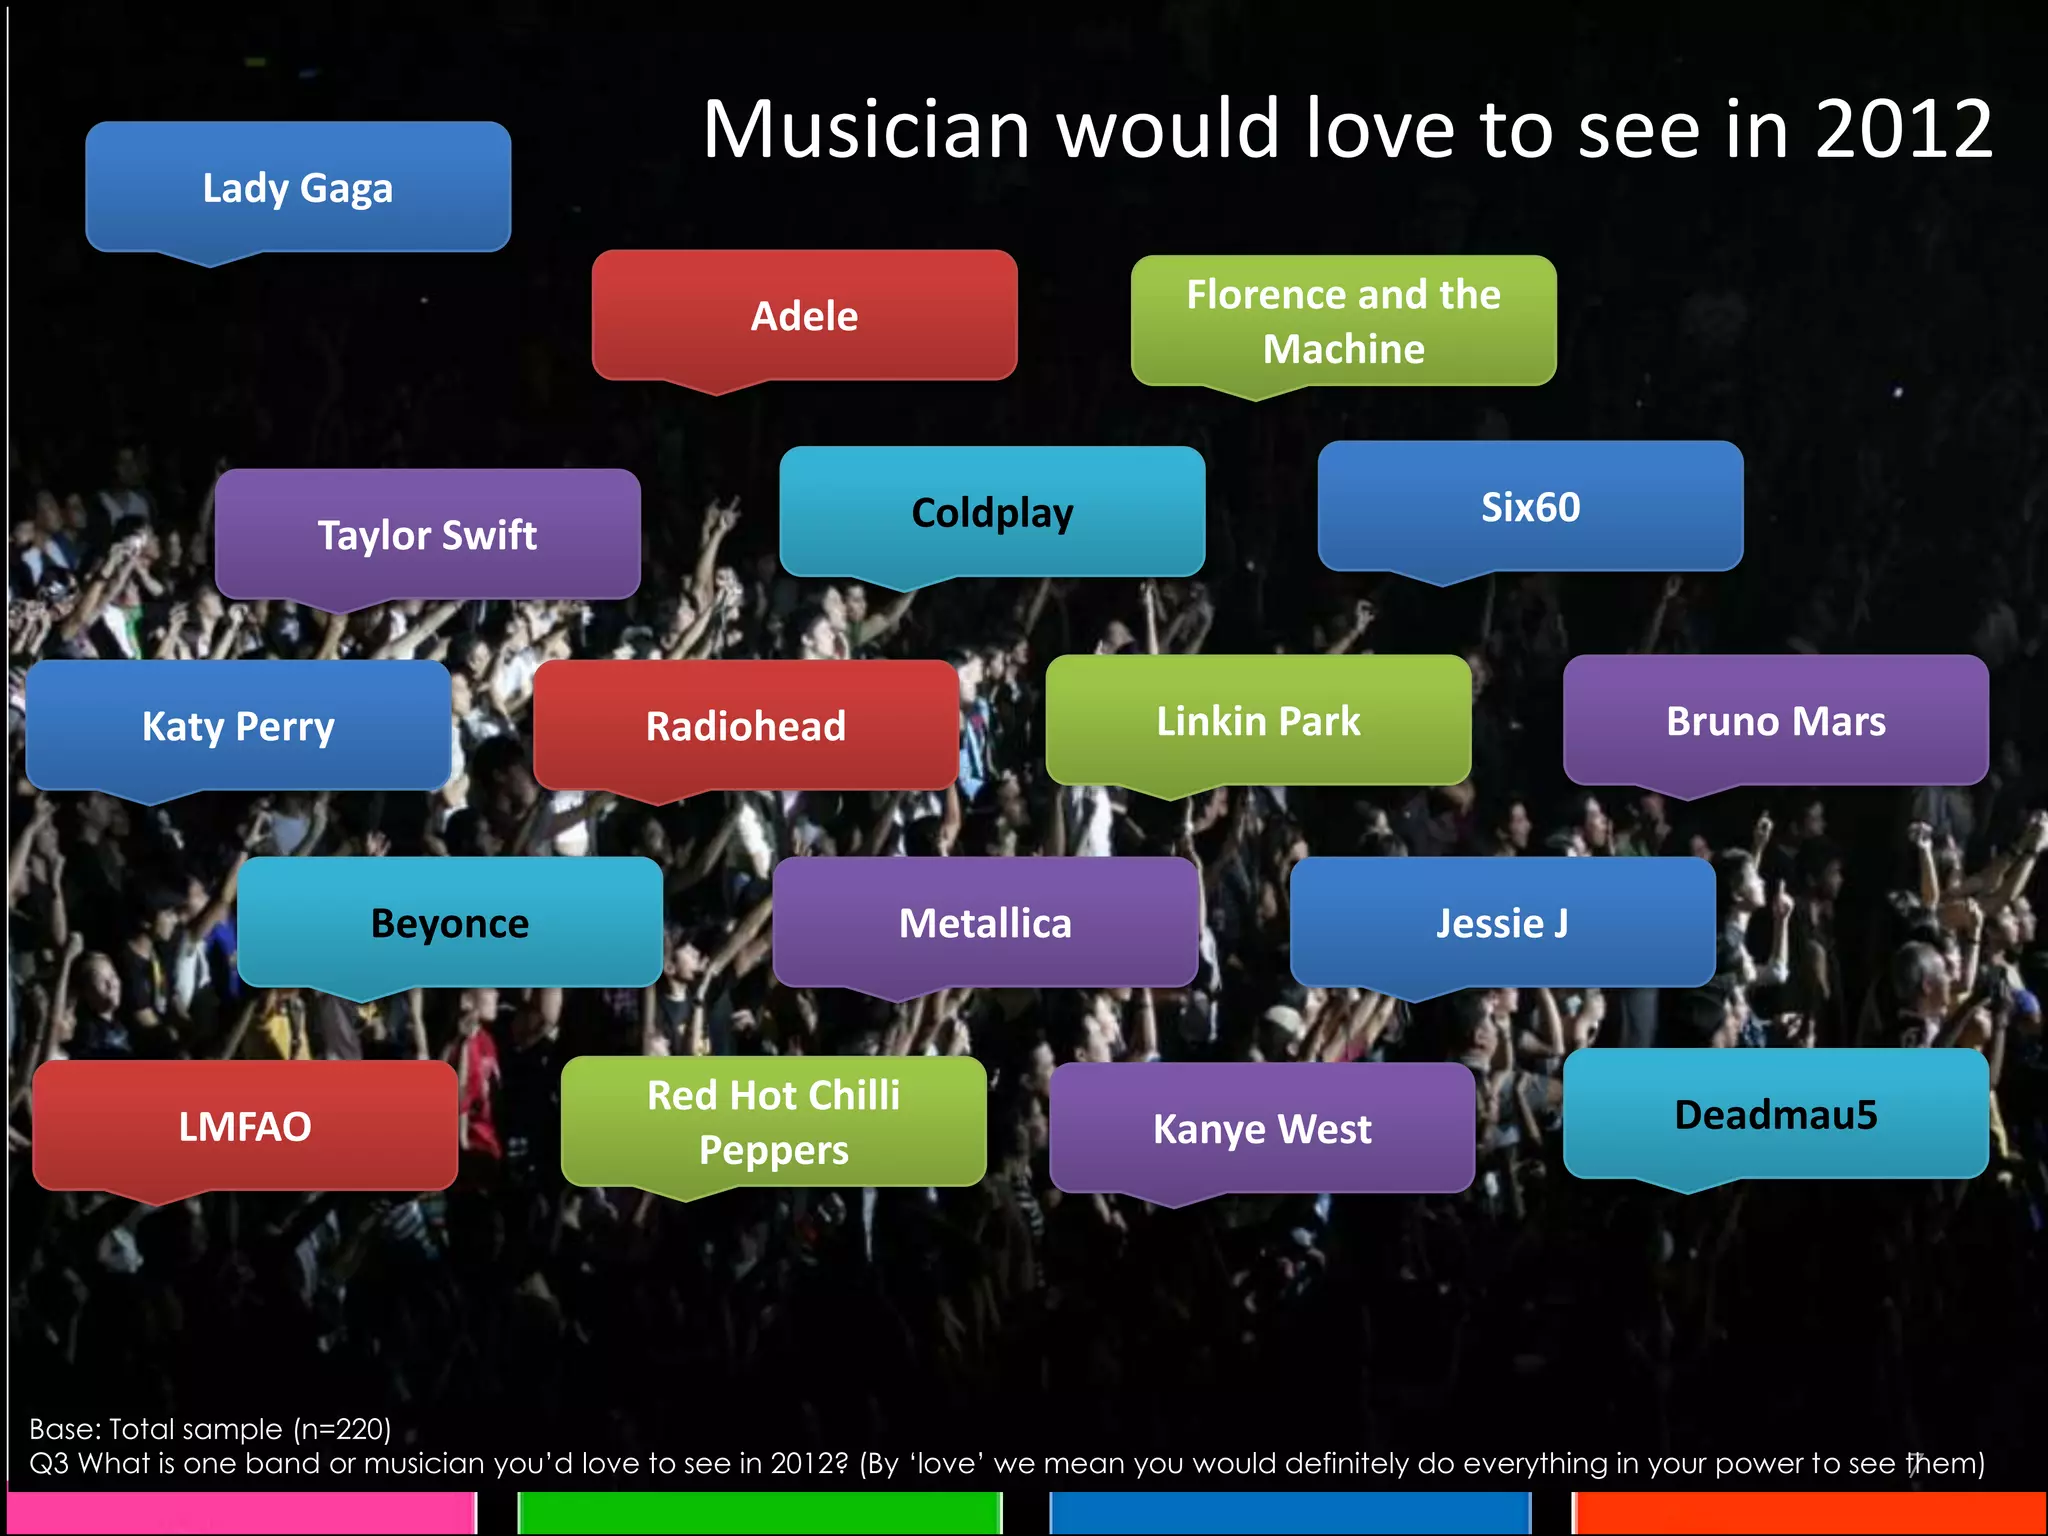
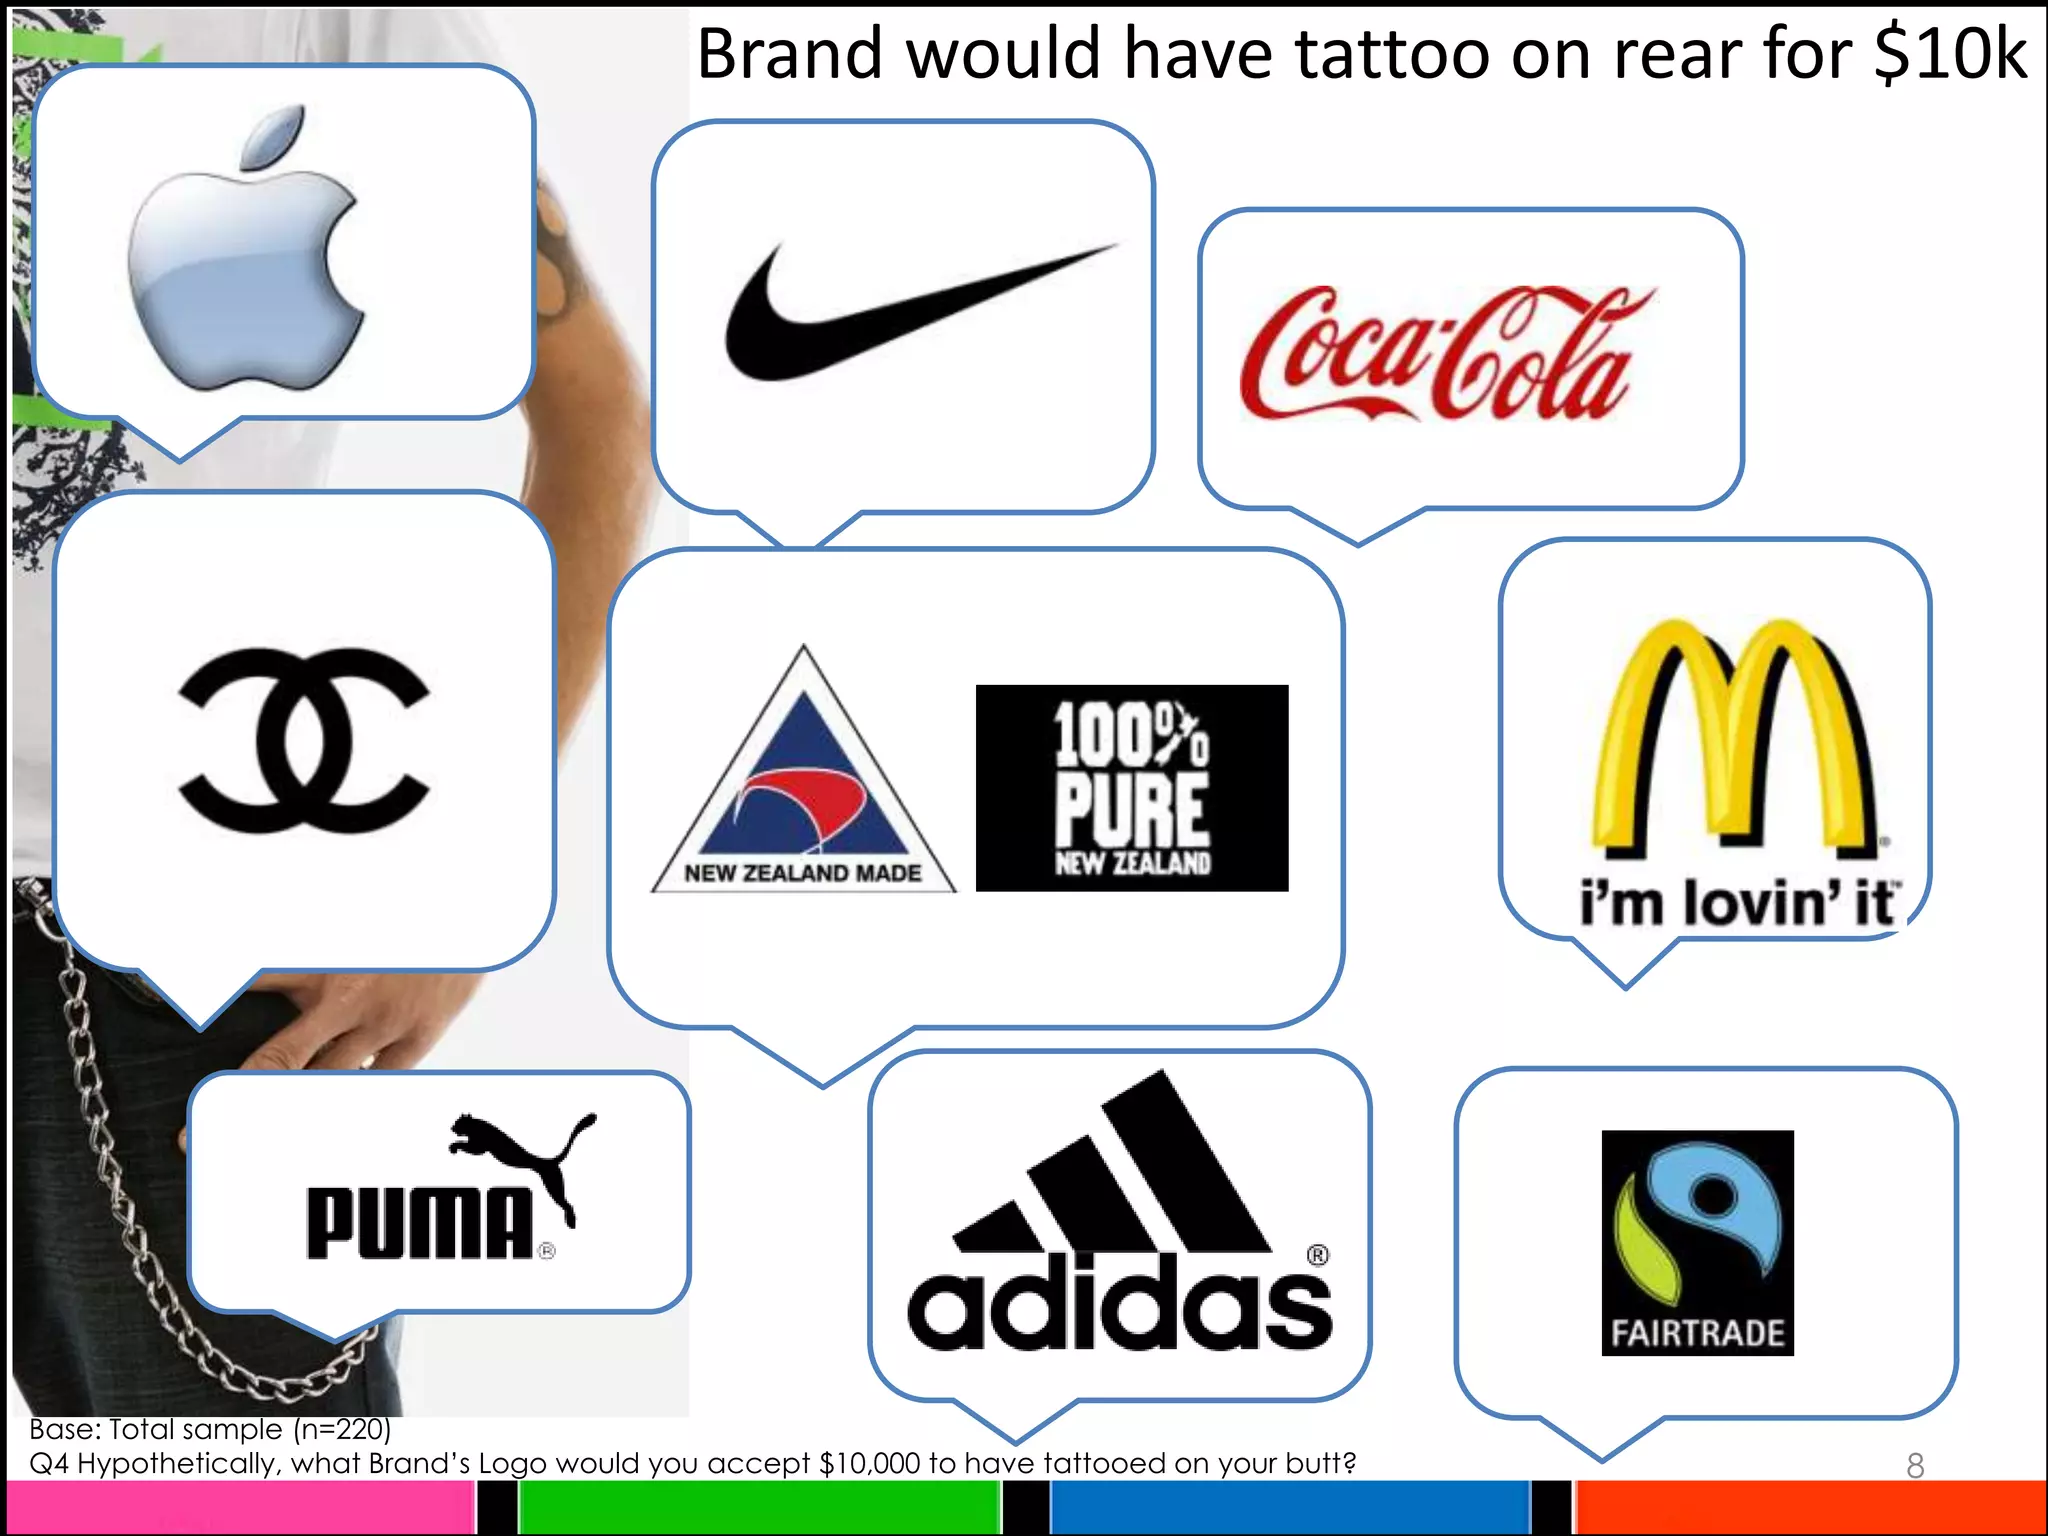
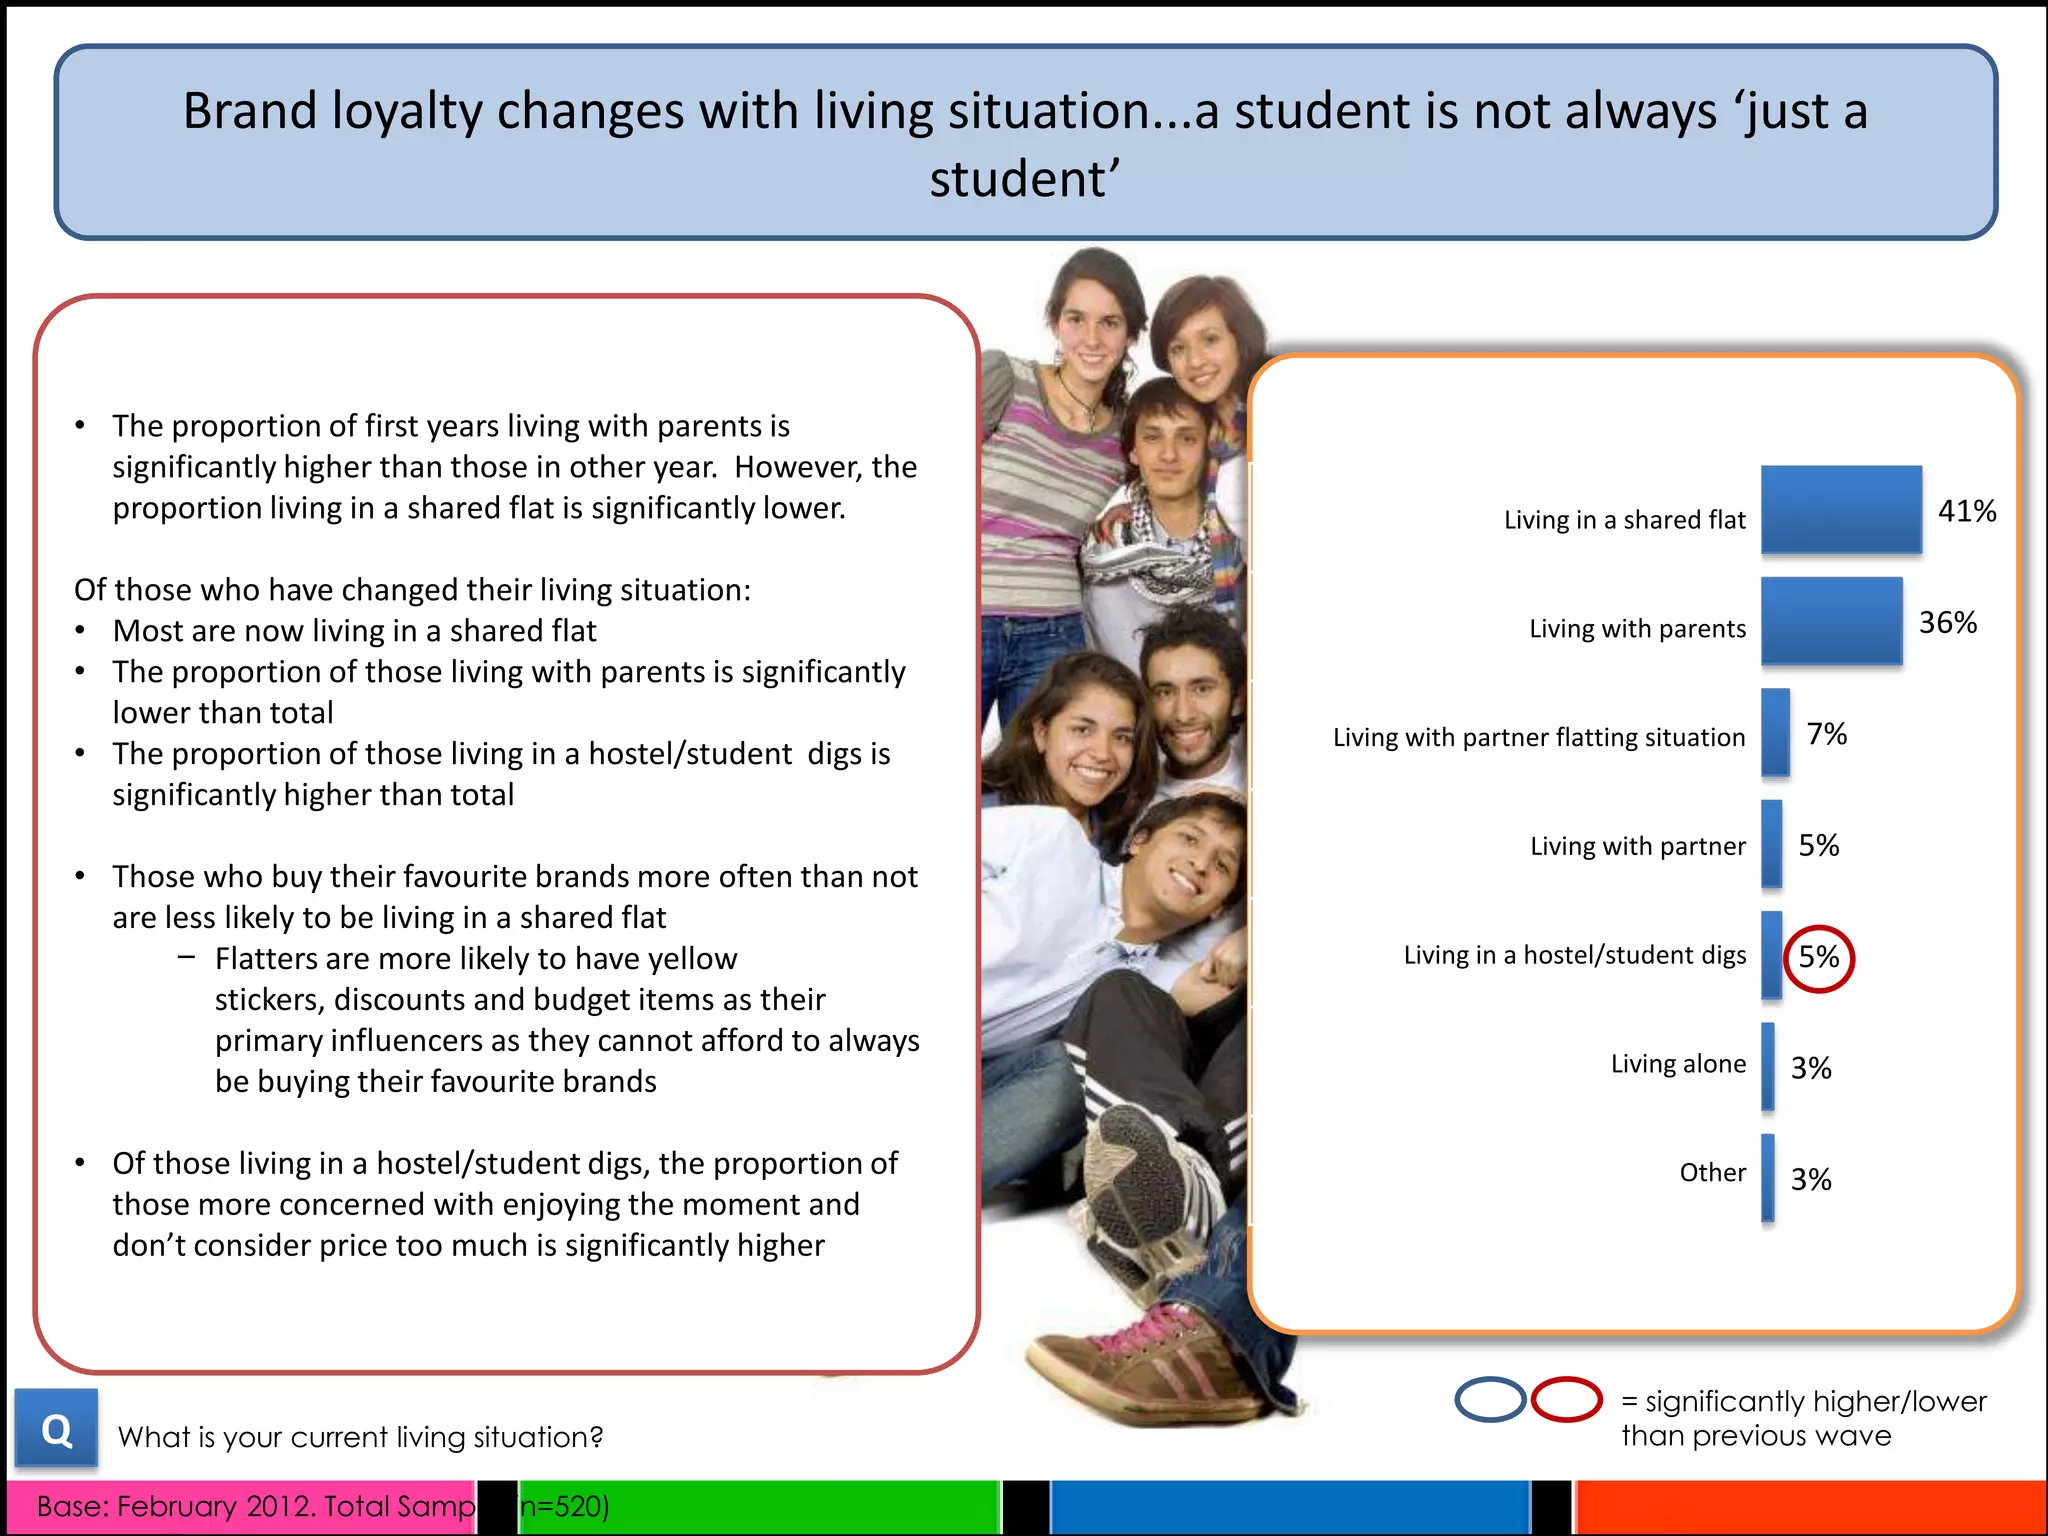
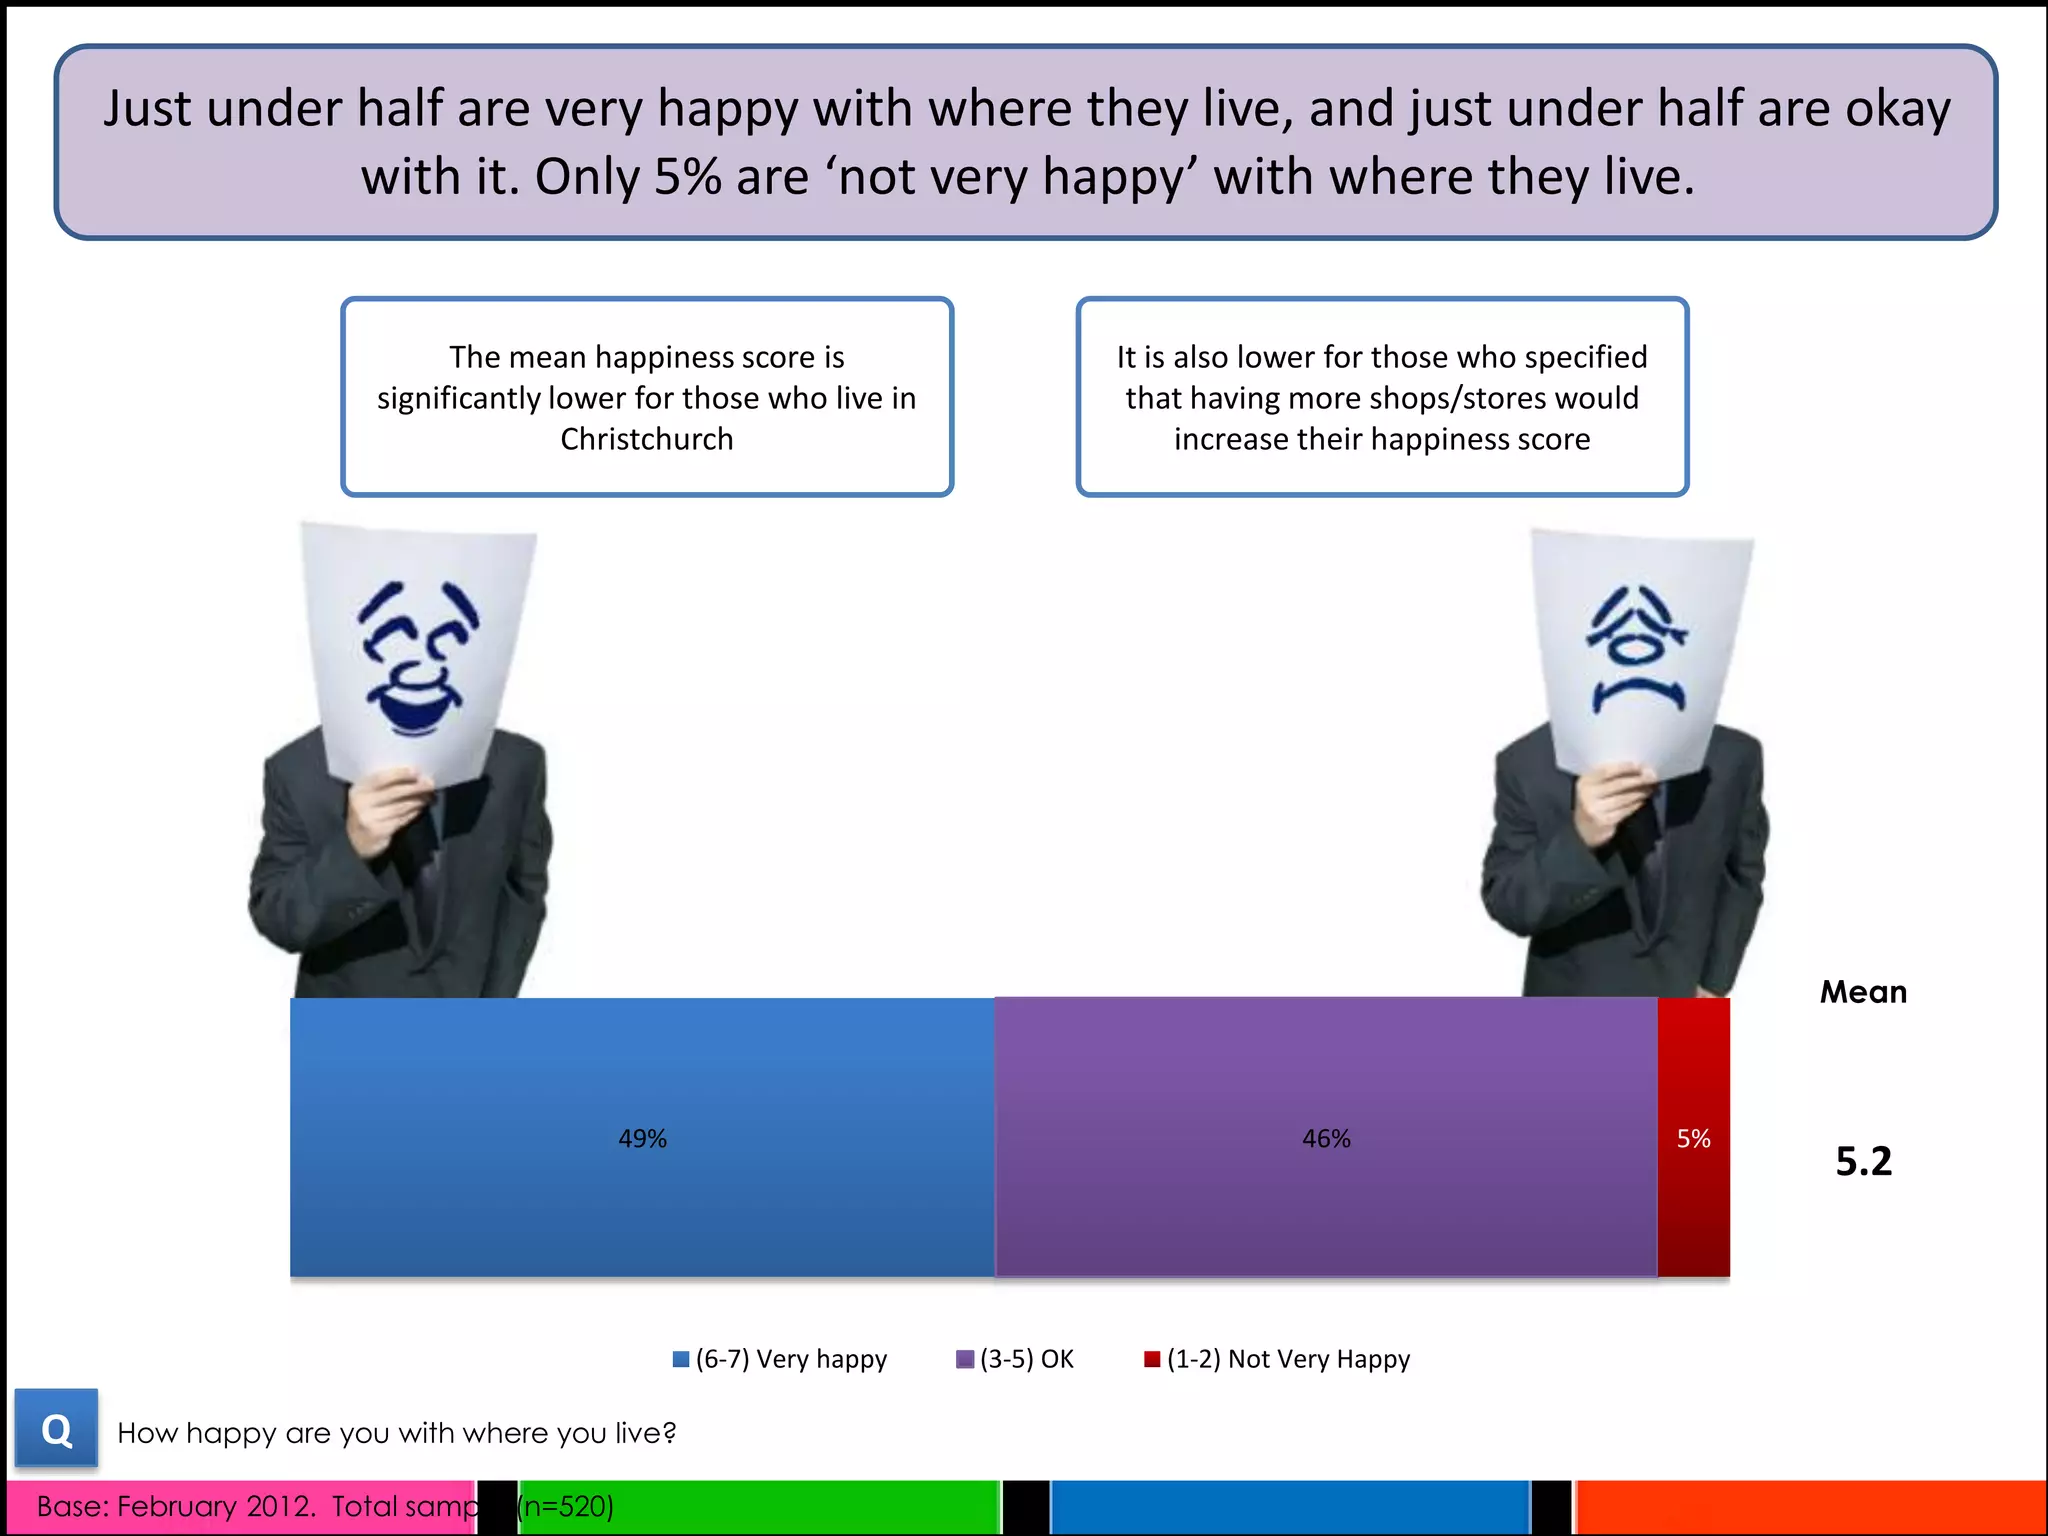
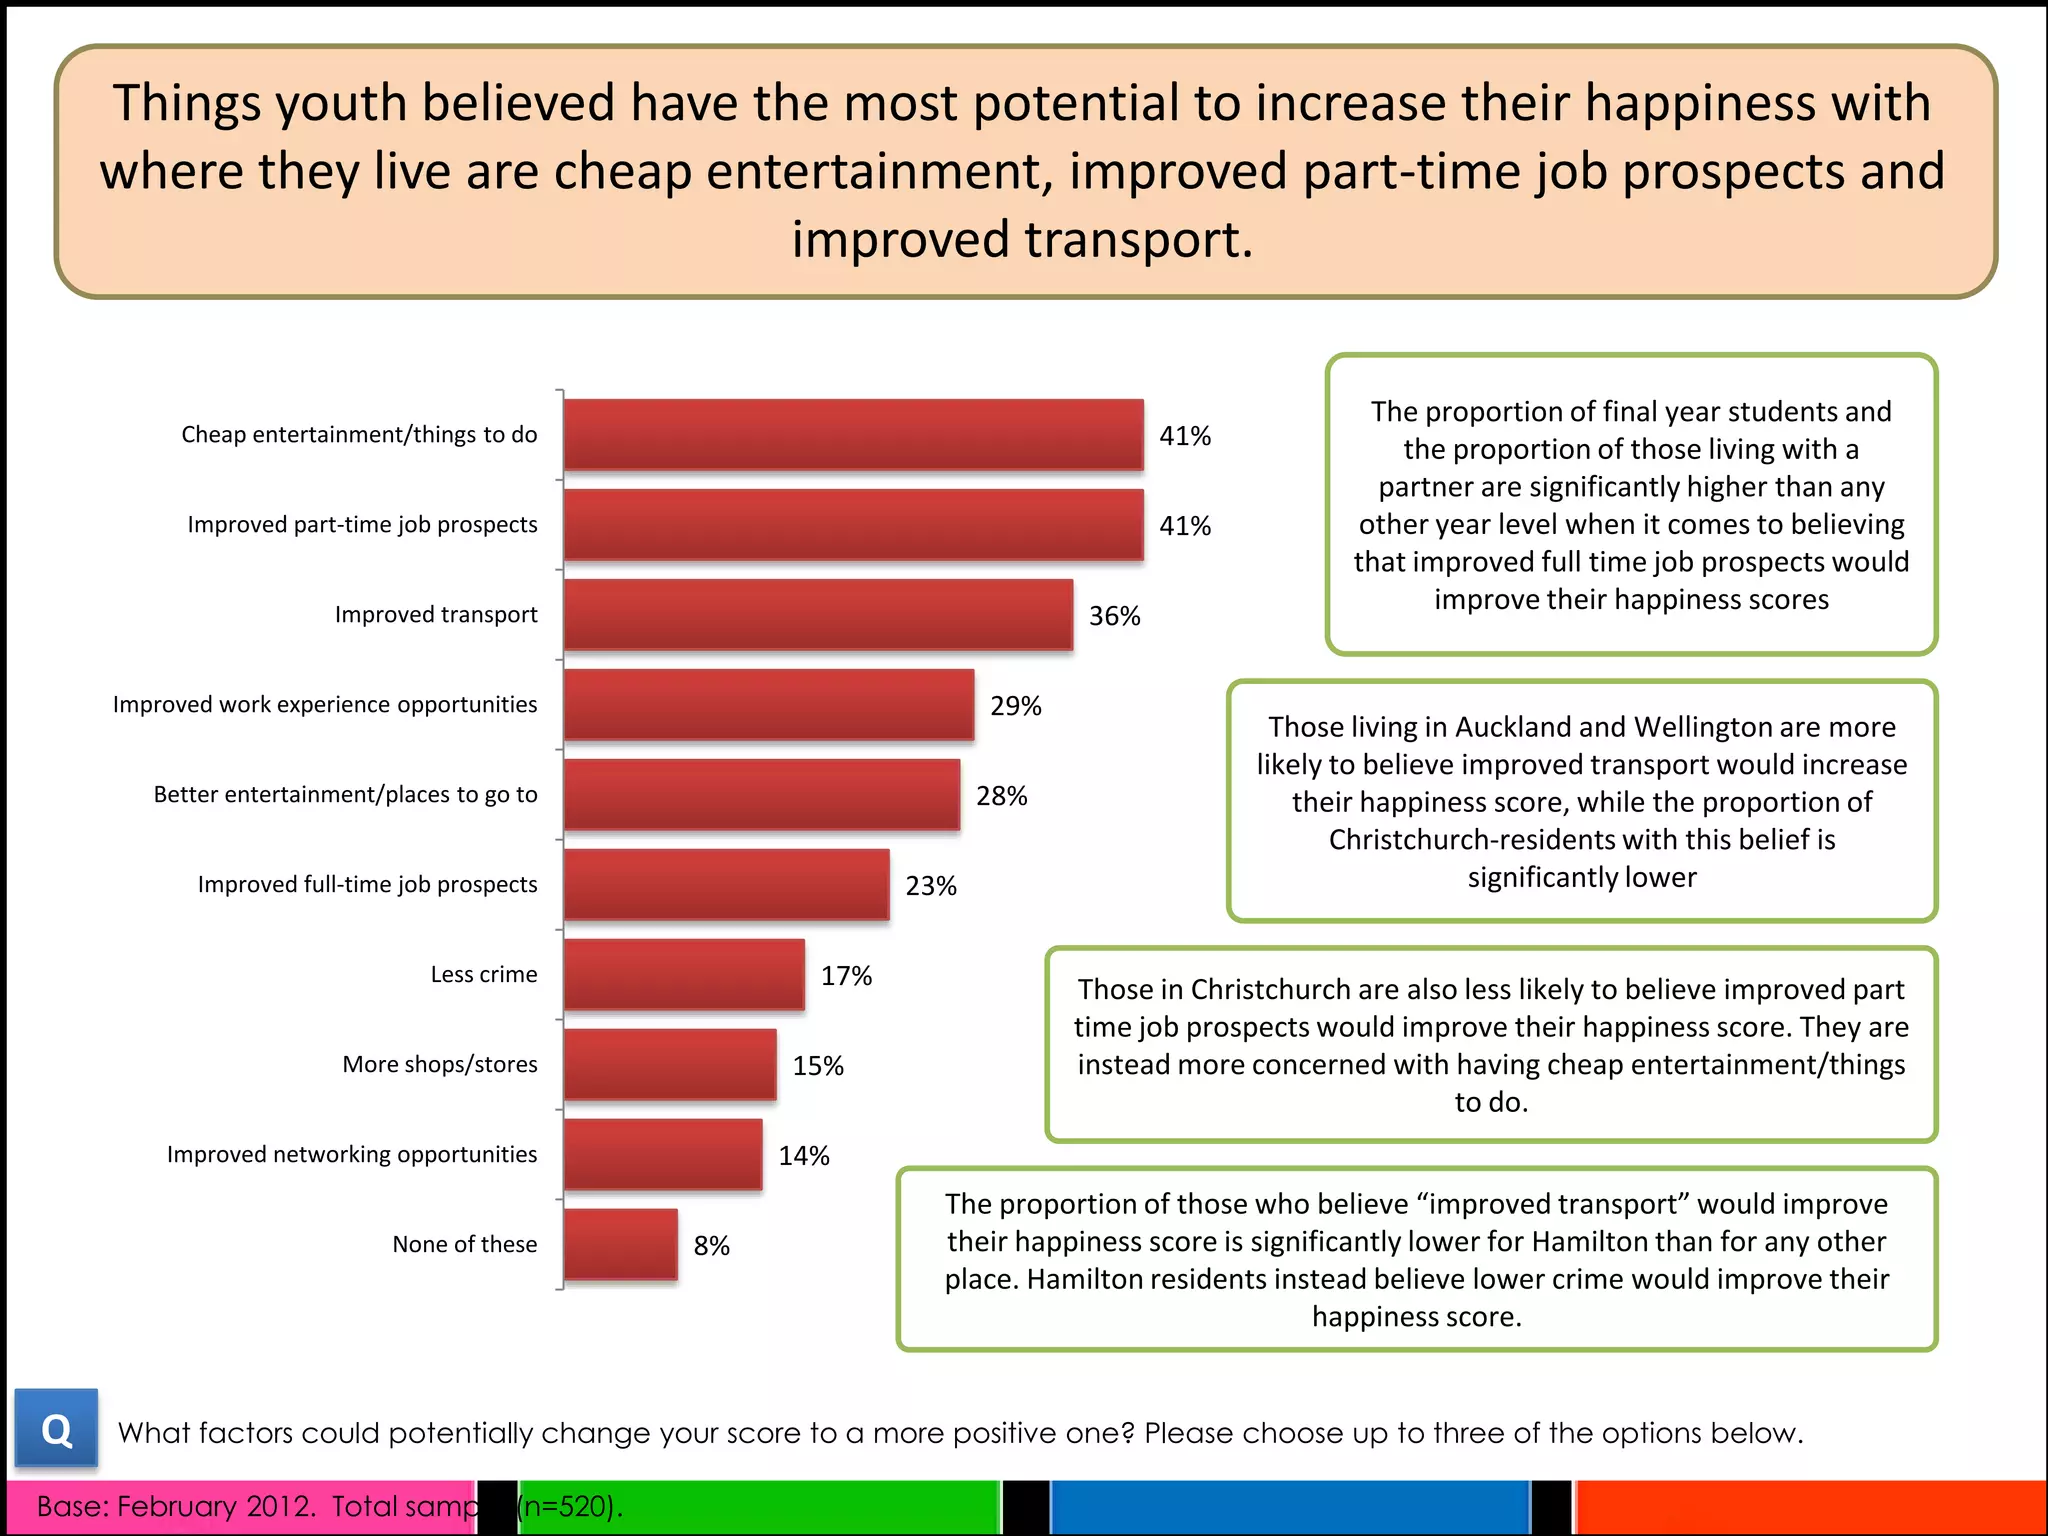
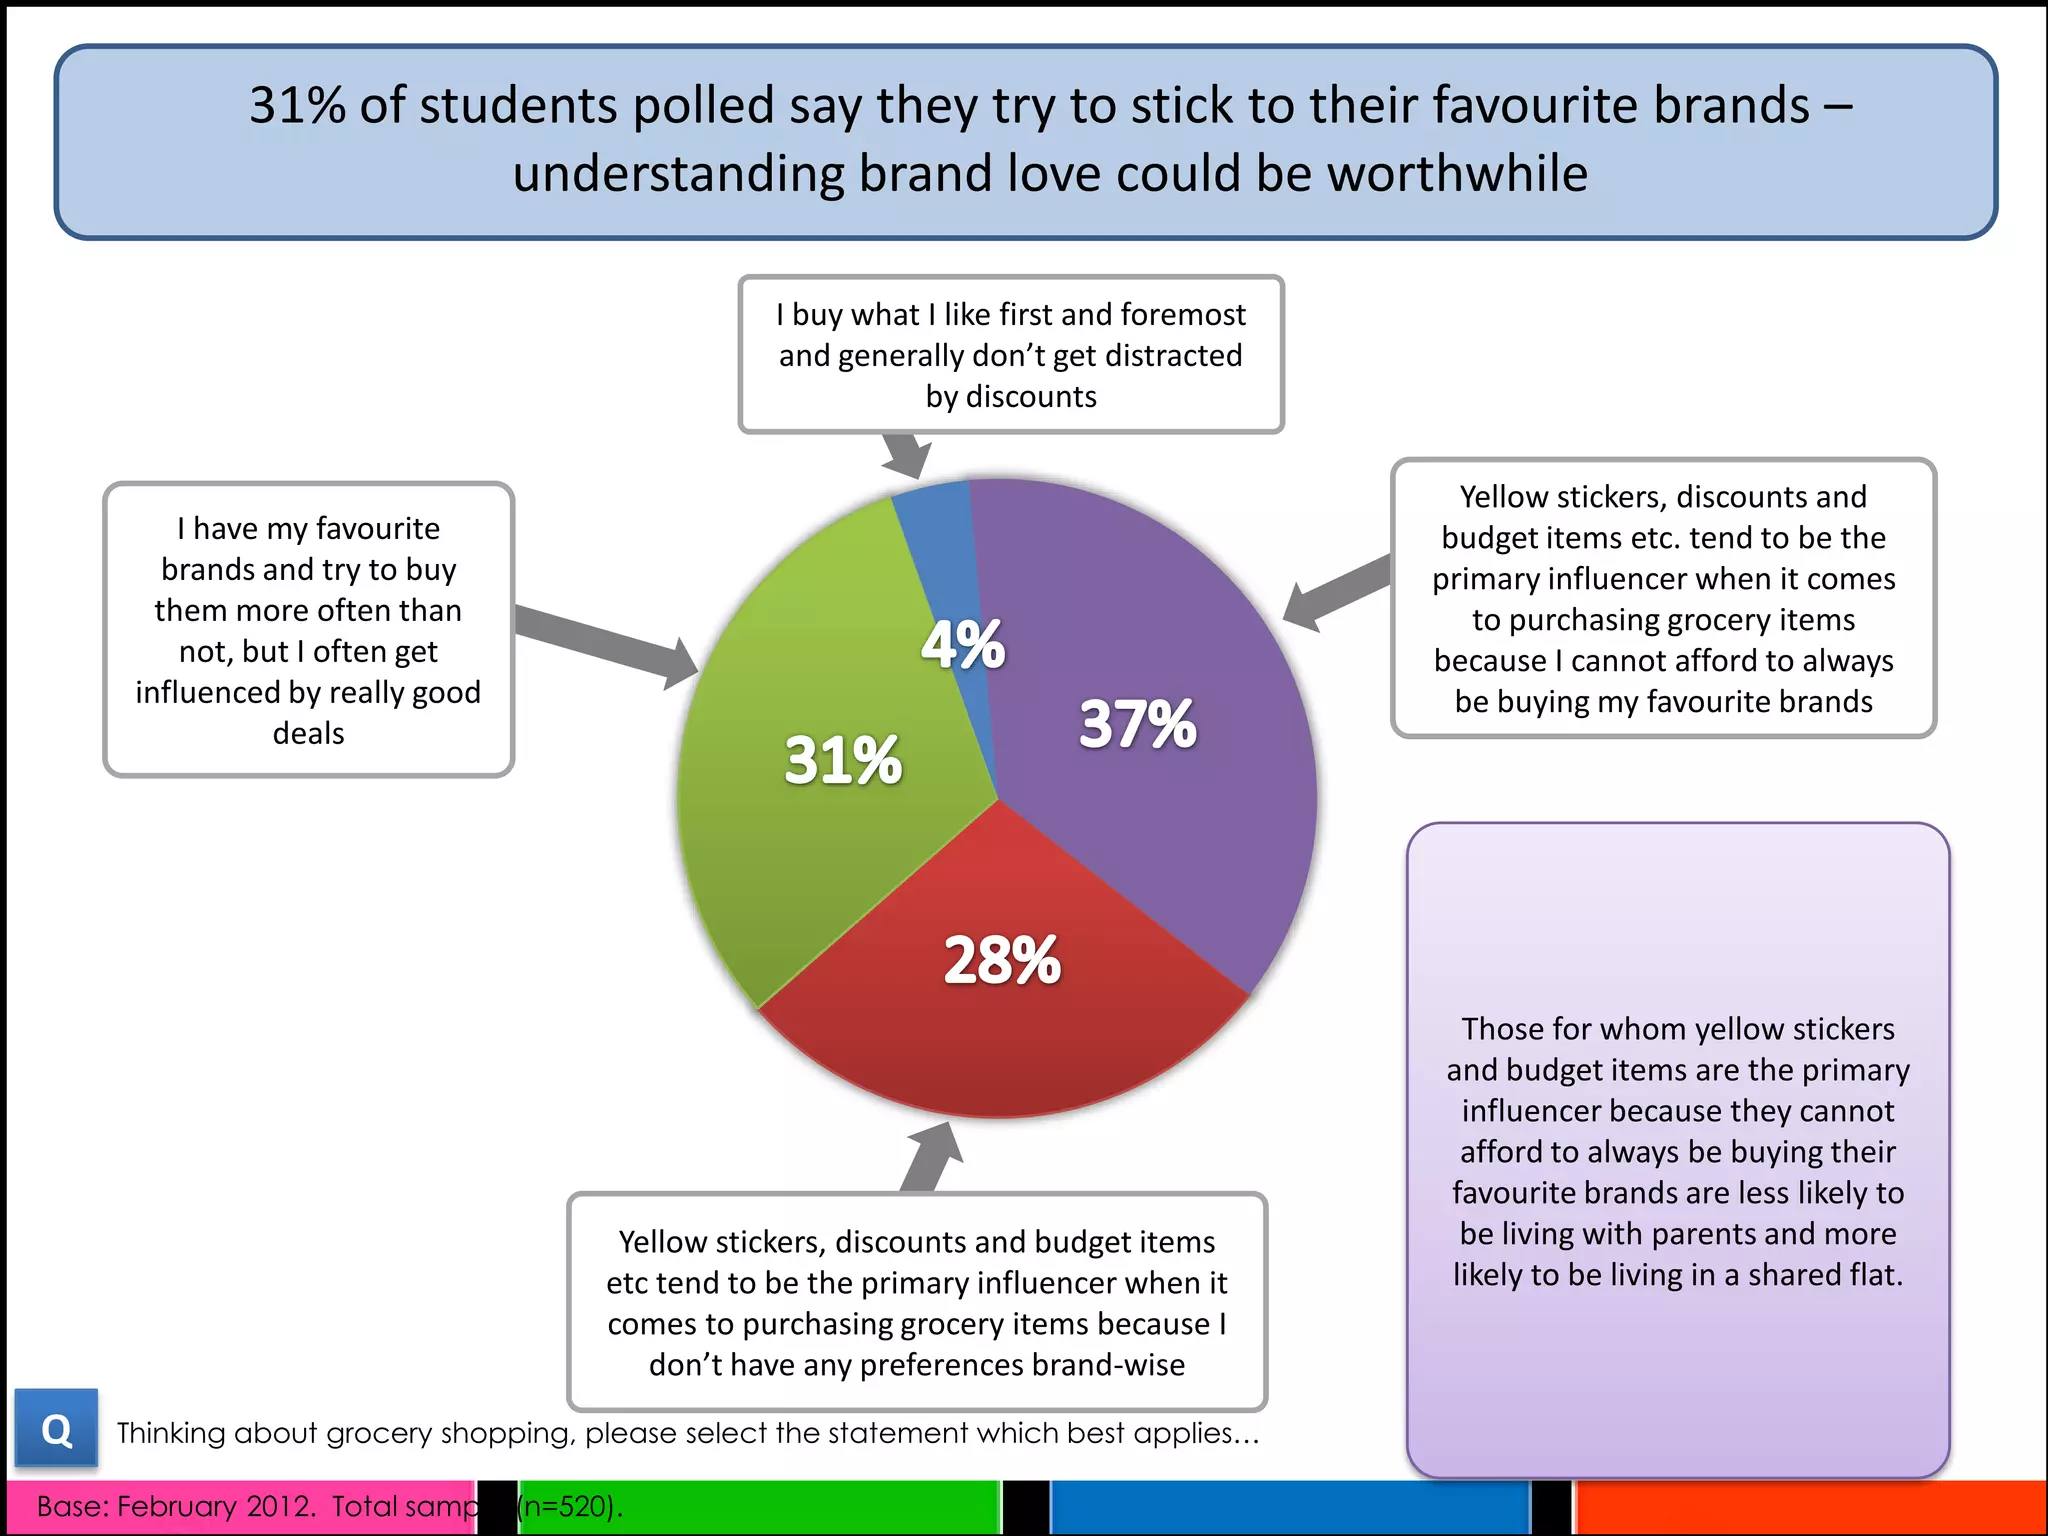
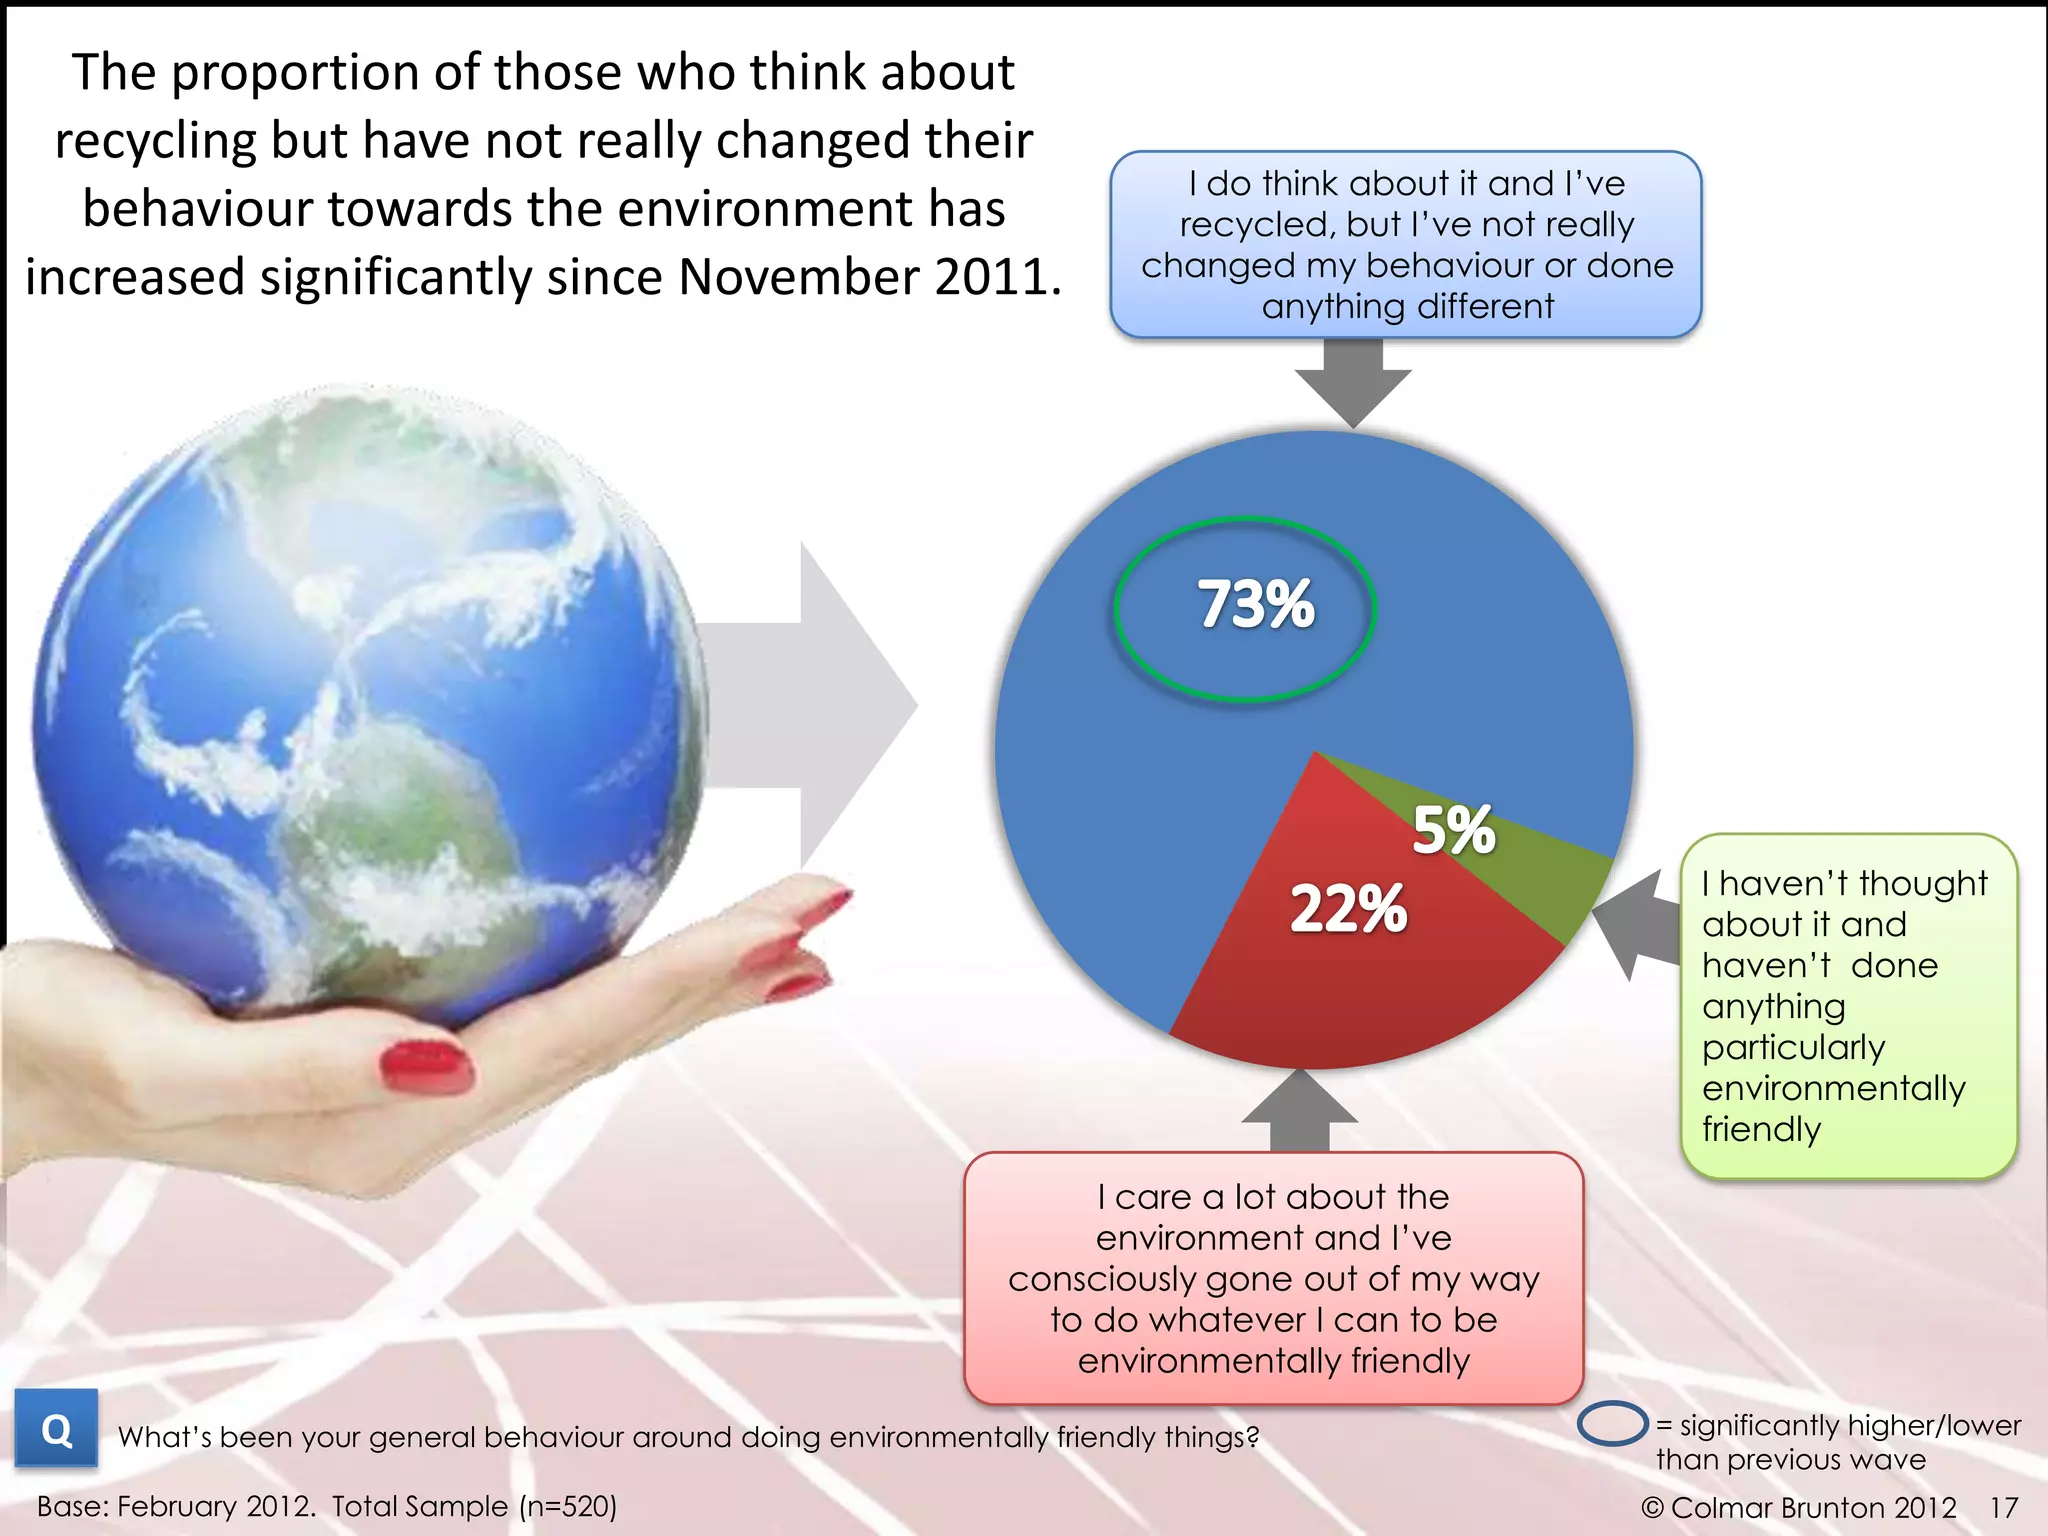
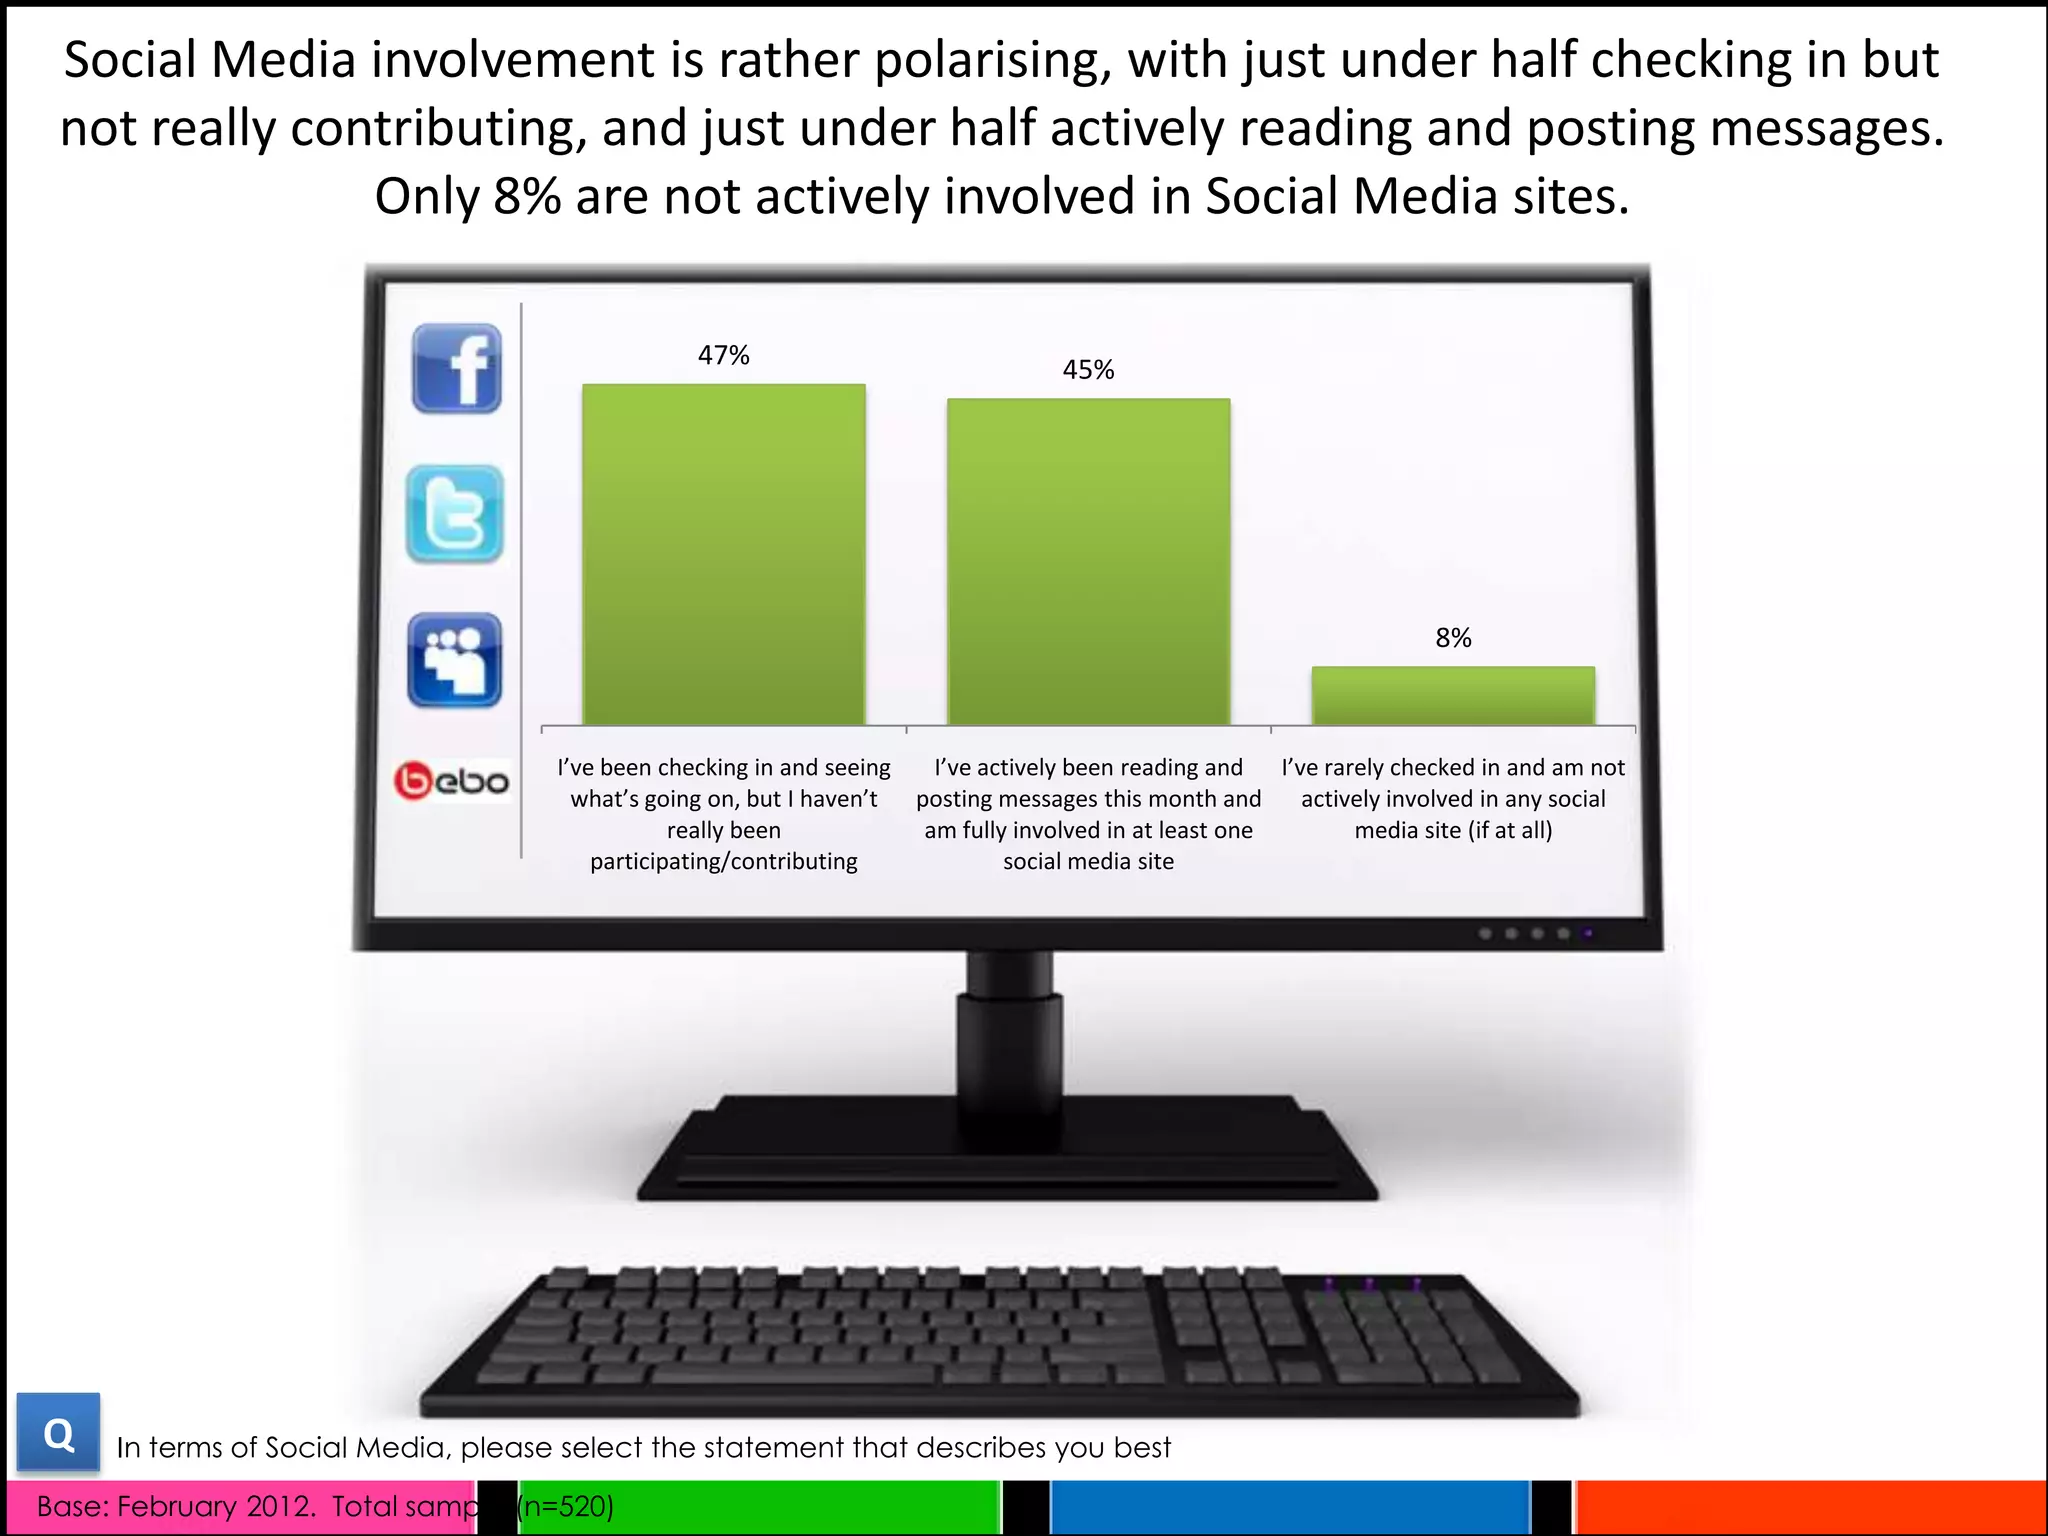
The FIRST WAVE of Buzz Marketing Group's year-long profile of today's mom. Our annual report reveals the truth about Moms - that they are connected, organized, innovative, and philanthropic.
In April 2006, FairSay conducted a survey of UK MPs to clarify if and how eCampaigning influences them. These results demonstrate the diversity among MPs and the recommendations based on the findings.
Amanda Lenhart spoke to the “Media and the Well-Being of Children and Adolescents” conference at the Annenberg Public Policy Center at the University of Pennsylvania. The conference brought together academics, researchers, non-profits and industry to discuss the effects of media on child mental and physical health and well-being. In her talk, Amanda focused on bringing together data that highlights the demographic differences among groups of youth in their adoption, use and experiences with technology and social media. While such data may have illustrated what was called a “digital divide” in the past, it now highlights a variety of digital differences among groups of youth. This talk brings together data previously shared in a variety of reports on youth as well as some new analysis.
Bobby Duffy (Twitter: @BobbyIpsosMORI) is Director of the global Ipsos Social Research Institute and is also a Visiting Senior Fellow, King’s College London
Can you put together a workshop on time management. This one's aimed at changing behaviour - and any professional advisor or coach will tell you it starts there. Closes with the pledge and signing a written commitment to change.
Nuts and Bolts of Forming For-Profit and Nonprofit Entities in VirginiaPerkins Law, PLLC
This is a presentation given in February 2010 to a group of tennis league coordinators on the basics of forming for-profit business entities and nonprofit entities in Virginia.
LivePerson Developers is proud to host a meetup about A/B testing by Shlomo Lahav, Chief Scientist at LivePerson.
The lecture will focus on testing and the ability to deduct conclusions, especially in the web.
- What is an A/B test?
- How to construct an A/B test properly?
- What are the metrics that can be used?
- Can the results be miss leading?
- Errors: bias and statistical errors
- First and second type errors
- Measuring lift, why lift is a biased measure.
- Is it possible to change the test settings during the test?
- How to run a multivariate testing effectively?
Modern Governor in the London Borough of BrentElaine Walton
Derek Balaam spoke recently at our Modern Governor event - see his slides here about how Modern Governor e-learning for School Governors works in Brent.
Galerie des Beaux Arts. Een unieke galerie waar u in een stijlvolle omgeving geniet van een bijzondere collectie oude en hedendaagse kunstobjecten. Moderne schilderijen en beeldhouwwerken, antieke meubelen en klokken, kostelijke sieraden en juwelen, verfijnde kleinoden in zilver en goud …
Get Your Business Found on Google! (Bahasa Indonesia)jkairupan
This is a deck I presented to Indonesian SMB owners in various local conferences in 2014.
The product has since been upgraded and optimized, now called "Google My Business"
CHSC 431: Community Assessment
This Spring the students of CHSC 431: Community Assessment, a graduate-level core UIC School of Public Health class engaged in a collaborative learning experience with students and faculty at Pedro Albizu Campos Puerto Rican High School to conduct a community health assessment of Humboldt Park. The UIC SPH class of nearly 40 students broke into six groups of students to assess separate health areas identified by PACHS as important - gentrification/sense of belonging; issues of LGBTQ youth, physical activity, nutrition, young women's sexual/reproductive health, and health literacy/diabetes. Each group engaged in a mixed method
assessment modeling the assessment component of the Mobilizing Action through Planning and Partnerships (MAPP) process typically carried out by local health departments. Each group had at least two members engaged in an ongoing community learning experience so as to better discern community perspectives with respect to their health topic. The learning experience ranged from to engaging/facilitating small group learning to facilitating a schoolwide survey to volunteer coaching of a youth sports club. Existing quantitative data on population demographics, health status and health behavior were analyzed in light of qualitative data from key informant interviews, participant observation or focus groups (debriefing groups) gathered from community engaged learning experience characterizing/contextualizing the health topic. Preliminary findings were discussed at Humboldt Park Library 4/21 and 4/28.
McCrindle Research exists to conduct world class research and communicate the insights in innovative ways.
The McCrindle Baynes Villages Census Report 2011 is Australia's benchmark industry report for the retirement villages sector.
Aaron Smith will share the Pew Internet Project’s most recent data on the constantly shifting digital ecosystem in the U.S. and highlight some major trends that have emerged since the project’s inception in 1999.
It’s a very important time to be paying attention to children’s books. Today’s children’s book market is a bright spot in a quickly evolving market—offering comparative stability in format and sales
even as the industry grapples with the future. Even in a down economy, adults still invest in quality children’s books.
But will this be true in five years from now? Ten? What place will books and reading have in an increasingly technological future? By looking at the children’s market now, perhaps we can understand what the future holds for the rest of the industry. After all, the attitudes of future book consumers are being formed right now—in the children’s market.
The Children’s Book Consumer in the Digital Age is the first ever deep-dive study of children’s book consumers. It asked
more than 75 questions to 1,500 consumers in three groups: adults who bought a book for 0-6, adults who bought a book for 7-12, and teens living in a household where books have been
bought.
This presentation shares the results form the survey which covered a wide range of questions about attitudes, behavior, and awareness. The results were startling, and have a lot to say about the future of books and reading.
As the publishing industry has been looking for a crystal ball to help see the future—we’re happy to report that we just found one.
A quick presentation loaded with recent stats that looks at who Mom is today. Given at the Luckie & Company sponsored Marketing To The Modern Mom conference in Birmingham on October 8
Why They Run presented by the National Runaway Switchboardguest54554c
Why They Run: An in-depth look at America’s runaway youth, presented by the National Runaway Switchboard, sheds new light on the runaway problem in America and begins to fill in the gaps of what is already known and what can be done based on new research.
Why They Run is comprised of research from three main sources: 1) existing research and reports, 2) NRS Crisis Caller Trends report (April 2010), and 3) new research conducted with youth between ages 14-17 on the street and in shelters (in Chicago and Los Angeles), which was implemented by the National Opinion Research Center (NORC), a social science research organization affiliated with the University of Chicago. Below are key findings from the new research from the NORC study.
37% would not give up their mobile phone for a year, whereas only 16% wouldn’t give up sex
For a spot of summertime fun we carried out a cheeky little survey asking people if they would give up their phone for a year.
Over a third of the respondents we asked wouldn’t, instead opting to give up sex, TV, eating out and drinking! Females appear to be even more hooked on their devices, with nearly half saying they would rather forgo other pleasures than give up their mobile for a year.
It just goes to show how important the role devices play in our daily lives has become. So much so in fact, that a staggering 93% of respondents feel their life is better because they own a mobile phone.
So why have we become so dependent? Devices have always been a great way for people to organise their social life and connect with friends, but it’s the growing need to be continuously connected to the Internet wherever we go that has seen the mobile device move from being a luxury to a necessity.
Ipsos MediaCT and YouTube: A Connected Generation - The Rise and Rise of Soci...Ipsos UK
Authors Sarah Everitt and Louise Brice look at the rise of social networking, the opportunities for businesses who engage with social media and how being social on the web has changed the dynamic of how people interact with media and brands.
2. Mum is the coolest person, while Dad is the sixth coolest.
Musicians/artists/actors celebrities, brothers and females family
friends also make the top 5.
Mum 15%
A musician/artist I’m into right now 12%
An actor/celebrity I’m into right now 10%
Brother 7%
Female family friend 7%
Dad 6%
Sister 5%
Male family friend 4%
A teacher, priest or other community figure 3%
Grandparent 2% Husband/Partner
Myself
Other male family member 1% My baby/child
Best friend
Pet
Other female family member 1%
Jesus
Flatmate
Other (please specify) 26% 26%
Base: Total Sample (n=220)
Q8: Who is the coolest person in your life right now? 2
3. Most expect to be earning between $60,000 to $100,000 by the
time they are 30…22% are dreaming!
22%
20%
20%
18%
15%
13%
10%
5% 5%
1% 1%
0%
I'm already $30,000 $40,000 $50,000 $60,000 $70,000 $80,000 $90,000 $100,000+
over 30
Base: Total Sample (n=220)
Q5: What salary do you expect to be earning when you are 30? 3
4. Conversations with others appear to be the most common method of catching up on
current affairs for youth, closely followed by Social Media posts on Twitter, Facebook
etc…Essentially current affairs has become user generated.
Conversations with other people 71%
Social media posts on Twitter, Facebook etc 65%
Watch or read news online daily 44%
Watch news on TV, not daily but more than twice a week 41%
Watch or read news, not daily but more than twice a week 31%
Listen to the radio for news and updates, not daily but more than twice a 30%
week
Watch news on TV daily 25%
Read someone else’s or a free copy of a newspaper, not daily but more 22%
than twice a week
Read someone else’s or a free copy of a newspaper daily 20%
Listen to the radio for news and updates daily 18%
Rely on email updates from newsletters, sites, RSS feeds etc. 14%
Watch or read news using my smartphone, not daily but more than twice 11%
a week
Buy and read a print newspaper daily 5%
Watch or read news using my smartphone daily 5%
Buy and read a print newspaper, not daily but more than twice a week 5%
Base: Total Sample (n=220)
Q6: How do you get your updates on current affairs and news? Please select as many as apply 4
5. The ability to access knowledge, validated by friends and followers at the swipe of
a finger….while not doing any damage is the trend for 2012
Eco The power of knowledge
The quest for a more sustainable
society. Green and Eco-friendly
36% We will know more than we ever did. We will be
able to track our own health, touch screens in
products will be mainstreaming stores and on the streets will tell us about
things, mobiles mean we can search the best
deals immediately, location based apps will
36% allow us to see where our friends are. We will
have the ability to know whatever we want.
The F-Factor
Where consumer decisions are decided
26% by tips from friends, fans and followers –
what other people say about something
Screen culture
will be more powerful than what a brand Get ready for a
says about itself. world where
consumers will be
incessantly
Price touching, swiping, pi
Pricing in 2012 will be more
25%
nching and tapping.
transparent, fluid, complex and
personalised. There will be dynamic
discounts where prices change
25%
throughout the day and are
personalised to suit a customer type
or member. Mobile
A mobile tipping point
where the mobile phone
Honesty is at the centre - It’s
Brands being honest and about social media, real
admitting flaws time, location-based
15% ‘flawsome’ and and instant gratification
demonstrating a ‘human
touch’.
rewards, which all
become achievable 19%
Base: Total Sample (n=220)
Don’t know 8% and expected.
Q7: www.trendwatching.com is the world’s most visited source for consumer trends and insights. 2012 ‘Trend Predictions’ according
to trendwatching.com include a raft of ideas. We’ve selected a few and would like you to select the 2 you feel are most relevant or
likely to be the most relevant here in NZ 5
6. Best TVC of 2012 (so far ) is……
Drink driving/Ghost chips/legend 16%
Lotto/Wilson Lotto Ad 4%
Sky Ad/My Sky/My happy place 3%
Mitre 10/Mitre 10 ad with boys 2%
Don't know/haven't watched TV lately 51%
Other 24%
Base: Total Sample (n=220)
Q11: What has been the best ad on TV in the last 6 months and why? 6
7. Lady Gaga
Musician would love to see in 2012
Adele Florence and the
Machine
Coldplay Six60
Taylor Swift
Katy Perry Radiohead Linkin Park Bruno Mars
Beyonce Metallica Jessie J
Red Hot Chilli Deadmau5
LMFAO Kanye West
Peppers
Base: Total sample (n=220)
7
Q3 What is one band or musician you’d love to see in 2012? (By ‘love’ we mean you would definitely do everything in your power to see them)
8. Brand would have tattoo on rear for $10k
Base: Total sample (n=220)
Q4 Hypothetically, what Brand’s Logo would you accept $10,000 to have tattooed on your butt? 8
9. Brand loyalty changes with living situation...a student is not always ‘just a
student’
• The proportion of first years living with parents is
significantly higher than those in other year. However, the
proportion living in a shared flat is significantly lower. Living in a shared flat 41%
Of those who have changed their living situation:
• Most are now living in a shared flat Living with parents 36%
• The proportion of those living with parents is significantly
lower than total
Living with partner flatting situation 7%
• The proportion of those living in a hostel/student digs is
significantly higher than total
Living with partner 5%
• Those who buy their favourite brands more often than not
are less likely to be living in a shared flat
− Flatters are more likely to have yellow Living in a hostel/student digs 5%
stickers, discounts and budget items as their
primary influencers as they cannot afford to always
Living alone 3%
be buying their favourite brands
• Of those living in a hostel/student digs, the proportion of Other 3%
those more concerned with enjoying the moment and
don’t consider price too much is significantly higher
= significantly higher/lower
Q What is your current living situation? than previous wave
Base: February 2012. Total Sample (n=520)
10. Just under half are very happy with where they live, and just under half are okay
with it. Only 5% are ‘not very happy’ with where they live.
The mean happiness score is It is also lower for those who specified
significantly lower for those who live in that having more shops/stores would
Christchurch increase their happiness score
Mean
49% 46% 5%
5.2
(6-7) Very happy (3-5) OK (1-2) Not Very Happy
Q How happy are you with where you live?
Base: February 2012. Total sample (n=520)
11. Things youth believed have the most potential to increase their happiness with
where they live are cheap entertainment, improved part-time job prospects and
improved transport.
The proportion of final year students and
Cheap entertainment/things to do 41% the proportion of those living with a
partner are significantly higher than any
Improved part-time job prospects 41% other year level when it comes to believing
that improved full time job prospects would
improve their happiness scores
Improved transport 36%
Improved work experience opportunities 29%
Those living in Auckland and Wellington are more
likely to believe improved transport would increase
Better entertainment/places to go to 28% their happiness score, while the proportion of
Christchurch-residents with this belief is
Improved full-time job prospects 23% significantly lower
Less crime 17% Those in Christchurch are also less likely to believe improved part
time job prospects would improve their happiness score. They are
More shops/stores 15% instead more concerned with having cheap entertainment/things
to do.
Improved networking opportunities 14%
The proportion of those who believe “improved transport” would improve
None of these 8% their happiness score is significantly lower for Hamilton than for any other
place. Hamilton residents instead believe lower crime would improve their
happiness score.
Q What factors could potentially change your score to a more positive one? Please choose up to three of the options below.
Base: February 2012. Total sample (n=520).
12. 31% of students polled say they try to stick to their favourite brands –
understanding brand love could be worthwhile
I buy what I like first and foremost
and generally don’t get distracted
by discounts
Yellow stickers, discounts and
I have my favourite budget items etc. tend to be the
brands and try to buy primary influencer when it comes
them more often than to purchasing grocery items
not, but I often get because I cannot afford to always
influenced by really good be buying my favourite brands
deals
Those for whom yellow stickers
and budget items are the primary
influencer because they cannot
afford to always be buying their
favourite brands are less likely to
Yellow stickers, discounts and budget items be living with parents and more
etc tend to be the primary influencer when it likely to be living in a shared flat.
comes to purchasing grocery items because I
don’t have any preferences brand-wise
Q Thinking about grocery shopping, please select the statement which best applies…
Base: February 2012. Total sample (n=520).
13. One half are extremely price conscious, whatever type of shopping they’re
doing, while one fifth are pretty relaxed in supermarkets and more price
conscious around other types of shopping. Only 7% are more concerned with
enjoying the moment and don’t consider price too much.
I’m extremely price conscious whatever type of Those in the final year of
shopping I’m doing, from grocery to clothes
50%
their degree are
significantly more
extremely price conscious,
whatever type of shopping
I’m pretty relaxed in supermarkets and more price
conscious around other types of shopping 20% they’re doing.
I’m extremely price conscious in the supermarket and
less so in the mall / high street stores 14%
I’m extremely price conscious in the supermarket and
less so in the mall / high street stores 9%
I’m more concerned with enjoying the moment and
don’t consider price too much 7%
Q Which of the following best describes your ‘shopping philosophy’?
Base: February 2012. Total sample (n=520).
14. The proportion of those who use a standard phone as their main phone
is significantly lower than in November 2011, while the proportion of
those who use a smart phone as their main phone is significantly higher
Other
Smart
Phone
Standard
Phone
= significantly higher/lower
Q What type of mobile phone do you currently use as your main phone? than previous wave
Base: February 2012. Total Sample (n=520)
15. …however, those who still use a standard phone as their main phone are
still not willing to forego smartphone-like capabilities, with over half
using a standard phone with internet capabilities
LOL
Q What type of mobile phone do you currently use as your main phone?
Base: February 2012. Respondents who use a standard phone as their main phone (n=279)
16. Just over half of smart phone users are using Androids, while a
third are using iPhones. Only 2% are using a Blackberry.
Nokia
5800, 560, N97,
E63
Windows
Samsung
• The proportion of those
LG G300 who use their mobile
phone for
Maemo 5 banking, social
media, Apps and
LG KM900 Internet browsing is
significantly higher for
those who use an
iPhone as their main
phone and significantly
lower for those who
use a standard phone
with Internet
• The proportion of those who use their capabilities.
mobile phone for Apps and Internet
browsing is significantly higher for
those who use an android smartphone
as their main phone.
• The proportion of those who have used a tablet
regularly in the last 3 months is significantly higher
for those who use an iPhone as their main phone and
significantly lower for those who use a standard
phone for text/call only.
Q What type of mobile phone do you currently use as your main phone?
Base: February 2012. Respondents who use a smart phone as their main phone (n=227)
18. Social Media involvement is rather polarising, with just under half checking in but
not really contributing, and just under half actively reading and posting messages.
Only 8% are not actively involved in Social Media sites.
47% 45%
8%
I’ve been checking in and seeing I’ve actively been reading and I’ve rarely checked in and am not
what’s going on, but I haven’t posting messages this month and actively involved in any social
really been am fully involved in at least one media site (if at all)
participating/contributing social media site
Q In terms of Social Media, please select the statement that describes you best
Base: February 2012. Total sample (n=520)