2011 summer program_adults_postcard
•
0 likes•255 views

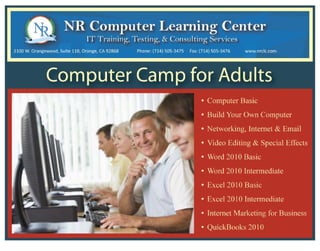
Computer Training in Microsoft Office, Internet Marketing, Quickbooks and Computer Basic
Report
Share
Report
Share
Download to read offline
Recommended
c++ lab manual
The Triangle class lab involves creating a Triangle class that defines properties and methods for triangles. The Triangle class contains private data members for the three sides of the triangle. It includes public methods to calculate the area and perimeter of a triangle using the side lengths, get the side lengths, set the side lengths, determine the triangle type, and print triangle information. The main() function constructs a Triangle object and calls its methods to demonstrate the class functionality in 3 sentences or less.
Introduction to problem solving in c++
This document discusses the process of problem solving through programming. It begins by defining an algorithm as a sequence of instructions to solve a problem and a program as an algorithm expressed in a language a computer can understand. It then outlines the programming process of analyzing a problem to determine the input and output, planning an algorithm using tools like IPO charts and pseudocode, and coding the algorithm. It provides examples of analyzing problems, planning algorithms, and desk-checking algorithms on sample data.
Intro. to prog. c++
This document provides an introduction and overview for a course on programming in C++. It discusses the goals of the course, which are to teach programming principles and the C++ language. Students will learn essential concepts like variables, data types, functions, and arrays. They will write increasingly complex programs and develop good programming style. The course will be assessed through quizzes, exams, and class projects. Topics to be covered include variables, input/output, control flow, arrays, pointers, strings, and file I/O. Good programming practices like readability, simplicity, and avoiding reinventing solutions are emphasized.
Power BI Desktop Overview
Power BI is a suite of business analytics tools businesses use for analyzing data and sharing insights. Power BI dashboards provide a 360-degree view for business users with their most important metrics in one place, updated in real-time, and available on all devices.
In this session, you will learn to use Microsoft Power BI (Business Intelligence) to develop reports. This is an introductory overview of Power BI to get you started.
Sign up for a free webinar at nrclc.eventbrite.com
Building Dashboard with Excel
Use Excel's PowerPivot, Pivot Table, PivotChart, and Slicer to build a dynamic dashboard in an hour to gain insight into an organization's operation and performance.
Introduction to Data Analytics
The growth in the use of technology has led organizations to generate data for which they need Data Analytics to analyze the data to make business decisions.
The presentation includes the following topics:
- Introduction to Data Analytics
- Data Analytics Process
- Data Analytics Skills
- Certifications Information for Data Analytics
Python - Data Structures
The introduction to Python session is for students wanting to learn the basics of the Python programming language. Python is an easy-to-learn programming language. Python is used to develop websites and software, manipulate and analyze data, create data visualization and dashboard, build machine learning algorithms, and much more. Since 2018, the demand for Python programmers has been growing (https://www.tiobe.com/tiobe-index/).
In this session, you will learn about four Python data structures: list, dictionary, tuple, and sets.
Prerequisite: Knowledge of Python Basics.
Audience: Suitable for beginners interested in developing a program in Python using various data structures available in Python.
Introduction to SQL
This document provides an introduction to SQL and its various components. It discusses the five main categories of SQL statements: Data Definition Language (DDL) for defining database schema, Data Manipulation Language (DML) for manipulating data, Data Query Language (DQL) for querying data, Data Control Language (DCL) for managing privileges, and Transaction Control Language (TCL) for managing transactions. Examples are provided for key statements like CREATE, INSERT, SELECT, GRANT and COMMIT. The document also lists some online SQL IDEs that can be used to execute SQL statements.
Office 2019 tips & tricks
The document provides tips and tricks for using various Microsoft Office applications including Word, Excel, PowerPoint, Outlook, and OneNote. It discusses how to use mail merge in Word to send personalized letters, utilize the backstage view and ribbon in Excel, create presentations with impact using PowerPoint themes and graphics, organize email messages with Outlook's search and flagging tools, and create new notebooks and sections in OneNote.
App Development with Apple Swift Certification at Certiport Centers
Individuals who earn the App Development with Swift Level 1 Certification will validate foundational knowledge of Swift™, Xcode®, and app development tools covered by the App Development with Swift course from Apple®. NR Computer Learning Center is an Authorized Certiport Testing Center located in Southern California.
Project management fundamentals
This 2-day course provides an overview of fundamental project management principles and skills. Participants will learn techniques for planning, executing, and closing out projects successfully. Through real-world scenarios and hands-on exercises, they will practice skills like creating work breakdown structures, managing stakeholders, and resolving conflicts. The trainer has over 20 years of experience in project management and IT and is certified in multiple areas including the Project Management Professional (PMP) designation.
Building a Dashboard in an hour with Power Pivot and Power BI
This document provides an overview of how to build dashboards in PowerPivot and Power BI. It discusses importing data, preparing the data, and building dashboards with visualizations like pivot tables, pivot charts, and slicers. The presenter has over 25 years of experience in software development and IT training. They will demonstrate importing sample order data, then creating dashboards to show top customers, products, and sales by state and month. The document also introduces Power BI, how to publish reports to the Power BI service, and create dashboards accessible on mobile devices.
Introduction to the basic mathematical concept with Python Turtle.
This document introduces Python turtle graphics and related math concepts. It discusses functions like forward(), left(), right(), and circle() to move and draw with the turtle. It covers angles, variables, shapes, and conditional statements. Examples show how to use these functions and concepts to draw squares, circles of different radiuses, and respond to user input with the turtle. The goal is to learn Python turtle graphics through interactive examples and exercises.
Stem presentation - Pathways to Technology Oriented Careers
NR Computer Learning Center (NRCLC) is a technology training center established in 2002 that offers hands-on computer classes, online training, and testing certifications. NRCLC teaches a variety of subjects like programming, networking, databases, and software applications to help students build careers in growing fields such as IT, engineering, and healthcare. Students can earn industry-recognized certifications from Microsoft, Oracle, CompTIA, and more to validate their skills and make their resumes stand out to employers and colleges.
MTA 98 364 - database fundamentals
The 5 days hands-on training provides the required knowledge and skills to manage and administer Microsoft SQL Server database. Students will learn to create a database, create an account, assign permission, create tables, relationships, views, triggers, stored procedures, functions, managing data using SQL and understand backup & recovery.
MTA 361 software development fundamentals
The 5 days hands-on training provides the required knowledge and skills to design and develop software using Microsoft product. The students will learn functional programming, Object-Oriented Programming, Software Development Life Cycle (SDLC), Desktop Applications development, Web-based applications development, Event-Based Application development with forms for data entry, report to display data and database connecting to manage data.
Introduction to java
The hands-on introductory-level course enables students to learn the basics of Java programming to build desktop applications. The students will learn to use variables, expressions, flow control, loops, array, error handling, writing to a file, reading from a file and more to develop an application!
Introduction to c++
An introductory-level course where students will learn the basics of C++ programming language to develop an application. The students will learn to use variables, expressions, flow control, loops, array, error handling, writing to a file, reading from a file and more to develop an application!
Executive dashboard for small business
A dashboard is an invaluable tool to gain insight into an organization's operation and performance. Businesses use a dashboard to view and analyze data such as expense & profit, identify patterns, predict trends and more. We will take a look at using Microsoft Excel to convert the raw data and quickly turn it into easy-to-use yet powerful dashboard to get instant results, and be able to slice and dice data dynamically. You will be able to use these techniques cross-industry with any data.
Building a Dashboard in an Hour using Microsoft PowerPivot & Power BI
The document introduces how to build a dashboard in an hour using Microsoft PowerPivot and Power BI. It provides an agenda that covers an introduction to dashboards, building a dashboard with PowerPivot and PowerBI, and a demo and Q&A. It describes PowerPivot and Power BI as tools to import data, create relationships, measures and calculations, and visualize data through pivot tables, pivot charts, and slicers. It includes a sample dataset and example questions to demonstrate how to summarize and analyze the data to create a dashboard.
Arduino for teens
This document advertises a 5-day summer Arduino camp for teens ages 12 to 18 held at the NR Computer Learning Center, where students will learn Arduino fundamentals and complete hands-on projects like blinking LED lights, sending messages in binary code, controlling RGB LEDs and motors, and building a stopwatch. The camp costs $399 and students can get an additional 20% off by using the coupon code "STEM17".
Microsoft Office Specialist (MOS) Excel 2013 certification pathway
Pathways to get Microsoft Office Specialist (MOS) certificate in Excel core and Excel Expert
Computer Summer Camp for Kids and Teens
Computer Summer Camp for Kids and Teens in Orange county California
MTA Database Certification Prep Training
Preperation hands-on training for MTA Database Certification program: introduction to SQL, Database design and Database Administration
AP Computer Science Test Prep - Part 2 - Object Oriented Programming
AP Computer Science Test Prep - Part 2 - Object Oriented Programming with Java. www.nrclc.com or learn.nrclc.com, Oracle Certied Associate
AP Computer Science Test Prep - Part 3 - Data Structure & Algorithm
AP Computer Science Test Prep - Part 3 - Data Structure & Algorithm, Java, algorithm, Data Structure, Technology, Computer Science
Educational Technology in the Health Sciences
Plenary presentation at the NTTC Inter-university Workshop, 18 June 2024, Manila Prince Hotel.
More Related Content
More from NR Computer Learning Center
Office 2019 tips & tricks
The document provides tips and tricks for using various Microsoft Office applications including Word, Excel, PowerPoint, Outlook, and OneNote. It discusses how to use mail merge in Word to send personalized letters, utilize the backstage view and ribbon in Excel, create presentations with impact using PowerPoint themes and graphics, organize email messages with Outlook's search and flagging tools, and create new notebooks and sections in OneNote.
App Development with Apple Swift Certification at Certiport Centers
Individuals who earn the App Development with Swift Level 1 Certification will validate foundational knowledge of Swift™, Xcode®, and app development tools covered by the App Development with Swift course from Apple®. NR Computer Learning Center is an Authorized Certiport Testing Center located in Southern California.
Project management fundamentals
This 2-day course provides an overview of fundamental project management principles and skills. Participants will learn techniques for planning, executing, and closing out projects successfully. Through real-world scenarios and hands-on exercises, they will practice skills like creating work breakdown structures, managing stakeholders, and resolving conflicts. The trainer has over 20 years of experience in project management and IT and is certified in multiple areas including the Project Management Professional (PMP) designation.
Building a Dashboard in an hour with Power Pivot and Power BI
This document provides an overview of how to build dashboards in PowerPivot and Power BI. It discusses importing data, preparing the data, and building dashboards with visualizations like pivot tables, pivot charts, and slicers. The presenter has over 25 years of experience in software development and IT training. They will demonstrate importing sample order data, then creating dashboards to show top customers, products, and sales by state and month. The document also introduces Power BI, how to publish reports to the Power BI service, and create dashboards accessible on mobile devices.
Introduction to the basic mathematical concept with Python Turtle.
This document introduces Python turtle graphics and related math concepts. It discusses functions like forward(), left(), right(), and circle() to move and draw with the turtle. It covers angles, variables, shapes, and conditional statements. Examples show how to use these functions and concepts to draw squares, circles of different radiuses, and respond to user input with the turtle. The goal is to learn Python turtle graphics through interactive examples and exercises.
Stem presentation - Pathways to Technology Oriented Careers
NR Computer Learning Center (NRCLC) is a technology training center established in 2002 that offers hands-on computer classes, online training, and testing certifications. NRCLC teaches a variety of subjects like programming, networking, databases, and software applications to help students build careers in growing fields such as IT, engineering, and healthcare. Students can earn industry-recognized certifications from Microsoft, Oracle, CompTIA, and more to validate their skills and make their resumes stand out to employers and colleges.
MTA 98 364 - database fundamentals
The 5 days hands-on training provides the required knowledge and skills to manage and administer Microsoft SQL Server database. Students will learn to create a database, create an account, assign permission, create tables, relationships, views, triggers, stored procedures, functions, managing data using SQL and understand backup & recovery.
MTA 361 software development fundamentals
The 5 days hands-on training provides the required knowledge and skills to design and develop software using Microsoft product. The students will learn functional programming, Object-Oriented Programming, Software Development Life Cycle (SDLC), Desktop Applications development, Web-based applications development, Event-Based Application development with forms for data entry, report to display data and database connecting to manage data.
Introduction to java
The hands-on introductory-level course enables students to learn the basics of Java programming to build desktop applications. The students will learn to use variables, expressions, flow control, loops, array, error handling, writing to a file, reading from a file and more to develop an application!
Introduction to c++
An introductory-level course where students will learn the basics of C++ programming language to develop an application. The students will learn to use variables, expressions, flow control, loops, array, error handling, writing to a file, reading from a file and more to develop an application!
Executive dashboard for small business
A dashboard is an invaluable tool to gain insight into an organization's operation and performance. Businesses use a dashboard to view and analyze data such as expense & profit, identify patterns, predict trends and more. We will take a look at using Microsoft Excel to convert the raw data and quickly turn it into easy-to-use yet powerful dashboard to get instant results, and be able to slice and dice data dynamically. You will be able to use these techniques cross-industry with any data.
Building a Dashboard in an Hour using Microsoft PowerPivot & Power BI
The document introduces how to build a dashboard in an hour using Microsoft PowerPivot and Power BI. It provides an agenda that covers an introduction to dashboards, building a dashboard with PowerPivot and PowerBI, and a demo and Q&A. It describes PowerPivot and Power BI as tools to import data, create relationships, measures and calculations, and visualize data through pivot tables, pivot charts, and slicers. It includes a sample dataset and example questions to demonstrate how to summarize and analyze the data to create a dashboard.
Arduino for teens
This document advertises a 5-day summer Arduino camp for teens ages 12 to 18 held at the NR Computer Learning Center, where students will learn Arduino fundamentals and complete hands-on projects like blinking LED lights, sending messages in binary code, controlling RGB LEDs and motors, and building a stopwatch. The camp costs $399 and students can get an additional 20% off by using the coupon code "STEM17".
Microsoft Office Specialist (MOS) Excel 2013 certification pathway
Pathways to get Microsoft Office Specialist (MOS) certificate in Excel core and Excel Expert
Computer Summer Camp for Kids and Teens
Computer Summer Camp for Kids and Teens in Orange county California
MTA Database Certification Prep Training
Preperation hands-on training for MTA Database Certification program: introduction to SQL, Database design and Database Administration
AP Computer Science Test Prep - Part 2 - Object Oriented Programming
AP Computer Science Test Prep - Part 2 - Object Oriented Programming with Java. www.nrclc.com or learn.nrclc.com, Oracle Certied Associate
AP Computer Science Test Prep - Part 3 - Data Structure & Algorithm
AP Computer Science Test Prep - Part 3 - Data Structure & Algorithm, Java, algorithm, Data Structure, Technology, Computer Science
More from NR Computer Learning Center (20)
App Development with Apple Swift Certification at Certiport Centers
App Development with Apple Swift Certification at Certiport Centers
Building a Dashboard in an hour with Power Pivot and Power BI
Building a Dashboard in an hour with Power Pivot and Power BI
Introduction to the basic mathematical concept with Python Turtle.
Introduction to the basic mathematical concept with Python Turtle.
Stem presentation - Pathways to Technology Oriented Careers
Stem presentation - Pathways to Technology Oriented Careers
Building a Dashboard in an Hour using Microsoft PowerPivot & Power BI
Building a Dashboard in an Hour using Microsoft PowerPivot & Power BI
Microsoft Office Specialist (MOS) Excel 2013 certification pathway
Microsoft Office Specialist (MOS) Excel 2013 certification pathway
AP Computer Science Test Prep - Part 2 - Object Oriented Programming
AP Computer Science Test Prep - Part 2 - Object Oriented Programming
AP Computer Science Test Prep - Part 3 - Data Structure & Algorithm
AP Computer Science Test Prep - Part 3 - Data Structure & Algorithm
Recently uploaded
Educational Technology in the Health Sciences
Plenary presentation at the NTTC Inter-university Workshop, 18 June 2024, Manila Prince Hotel.
BIOLOGY NATIONAL EXAMINATION COUNCIL (NECO) 2024 PRACTICAL MANUAL.pptx
Practical manual for National Examination Council, Nigeria.
Contains guides on answering questions on the specimens provided
How to Predict Vendor Bill Product in Odoo 17
This slide will guide us through the process of predicting vendor bill products based on previous purchases from the vendor in Odoo 17.
What is Digital Literacy? A guest blog from Andy McLaughlin, University of Ab...
What is Digital Literacy? A guest blog from Andy McLaughlin, University of Aberdeen
HYPERTENSION - SLIDE SHARE PRESENTATION.
IT WILL BE HELPFULL FOR THE NUSING STUDENTS
IT FOCUSED ON MEDICAL MANAGEMENT AND NURSING MANAGEMENT.
HIGHLIGHTS ON HEALTH EDUCATION.
A Visual Guide to 1 Samuel | A Tale of Two Hearts
These slides walk through the story of 1 Samuel. Samuel is the last judge of Israel. The people reject God and want a king. Saul is anointed as the first king, but he is not a good king. David, the shepherd boy is anointed and Saul is envious of him. David shows honor while Saul continues to self destruct.
Jemison, MacLaughlin, and Majumder "Broadening Pathways for Editors and Authors"
Jemison, MacLaughlin, and Majumder "Broadening Pathways for Editors and Authors"National Information Standards Organization (NISO)
This presentation was provided by Racquel Jemison, Ph.D., Christina MacLaughlin, Ph.D., and Paulomi Majumder. Ph.D., all of the American Chemical Society, for the second session of NISO's 2024 Training Series "DEIA in the Scholarly Landscape." Session Two: 'Expanding Pathways to Publishing Careers,' was held June 13, 2024.How to deliver Powerpoint Presentations.pptx
"How to make and deliver dynamic presentations by making it more interactive to captivate your audience attention"
Chapter wise All Notes of First year Basic Civil Engineering.pptx
Chapter wise All Notes of First year Basic Civil Engineering
Syllabus
Chapter-1
Introduction to objective, scope and outcome the subject
Chapter 2
Introduction: Scope and Specialization of Civil Engineering, Role of civil Engineer in Society, Impact of infrastructural development on economy of country.
Chapter 3
Surveying: Object Principles & Types of Surveying; Site Plans, Plans & Maps; Scales & Unit of different Measurements.
Linear Measurements: Instruments used. Linear Measurement by Tape, Ranging out Survey Lines and overcoming Obstructions; Measurements on sloping ground; Tape corrections, conventional symbols. Angular Measurements: Instruments used; Introduction to Compass Surveying, Bearings and Longitude & Latitude of a Line, Introduction to total station.
Levelling: Instrument used Object of levelling, Methods of levelling in brief, and Contour maps.
Chapter 4
Buildings: Selection of site for Buildings, Layout of Building Plan, Types of buildings, Plinth area, carpet area, floor space index, Introduction to building byelaws, concept of sun light & ventilation. Components of Buildings & their functions, Basic concept of R.C.C., Introduction to types of foundation
Chapter 5
Transportation: Introduction to Transportation Engineering; Traffic and Road Safety: Types and Characteristics of Various Modes of Transportation; Various Road Traffic Signs, Causes of Accidents and Road Safety Measures.
Chapter 6
Environmental Engineering: Environmental Pollution, Environmental Acts and Regulations, Functional Concepts of Ecology, Basics of Species, Biodiversity, Ecosystem, Hydrological Cycle; Chemical Cycles: Carbon, Nitrogen & Phosphorus; Energy Flow in Ecosystems.
Water Pollution: Water Quality standards, Introduction to Treatment & Disposal of Waste Water. Reuse and Saving of Water, Rain Water Harvesting. Solid Waste Management: Classification of Solid Waste, Collection, Transportation and Disposal of Solid. Recycling of Solid Waste: Energy Recovery, Sanitary Landfill, On-Site Sanitation. Air & Noise Pollution: Primary and Secondary air pollutants, Harmful effects of Air Pollution, Control of Air Pollution. . Noise Pollution Harmful Effects of noise pollution, control of noise pollution, Global warming & Climate Change, Ozone depletion, Greenhouse effect
Text Books:
1. Palancharmy, Basic Civil Engineering, McGraw Hill publishers.
2. Satheesh Gopi, Basic Civil Engineering, Pearson Publishers.
3. Ketki Rangwala Dalal, Essentials of Civil Engineering, Charotar Publishing House.
4. BCP, Surveying volume 1
Bossa N’ Roll Records by Ismael Vazquez.
Bossa N Roll Records presentation by Izzy Vazquez for Music Retail and Distribution class at Full Sail University
THE SACRIFICE HOW PRO-PALESTINE PROTESTS STUDENTS ARE SACRIFICING TO CHANGE T...
The recent surge in pro-Palestine student activism has prompted significant responses from universities, ranging from negotiations and divestment commitments to increased transparency about investments in companies supporting the war on Gaza. This activism has led to the cessation of student encampments but also highlighted the substantial sacrifices made by students, including academic disruptions and personal risks. The primary drivers of these protests are poor university administration, lack of transparency, and inadequate communication between officials and students. This study examines the profound emotional, psychological, and professional impacts on students engaged in pro-Palestine protests, focusing on Generation Z's (Gen-Z) activism dynamics. This paper explores the significant sacrifices made by these students and even the professors supporting the pro-Palestine movement, with a focus on recent global movements. Through an in-depth analysis of printed and electronic media, the study examines the impacts of these sacrifices on the academic and personal lives of those involved. The paper highlights examples from various universities, demonstrating student activism's long-term and short-term effects, including disciplinary actions, social backlash, and career implications. The researchers also explore the broader implications of student sacrifices. The findings reveal that these sacrifices are driven by a profound commitment to justice and human rights, and are influenced by the increasing availability of information, peer interactions, and personal convictions. The study also discusses the broader implications of this activism, comparing it to historical precedents and assessing its potential to influence policy and public opinion. The emotional and psychological toll on student activists is significant, but their sense of purpose and community support mitigates some of these challenges. However, the researchers call for acknowledging the broader Impact of these sacrifices on the future global movement of FreePalestine.
Wound healing PPT
This document provides an overview of wound healing, its functions, stages, mechanisms, factors affecting it, and complications.
A wound is a break in the integrity of the skin or tissues, which may be associated with disruption of the structure and function.
Healing is the body’s response to injury in an attempt to restore normal structure and functions.
Healing can occur in two ways: Regeneration and Repair
There are 4 phases of wound healing: hemostasis, inflammation, proliferation, and remodeling. This document also describes the mechanism of wound healing. Factors that affect healing include infection, uncontrolled diabetes, poor nutrition, age, anemia, the presence of foreign bodies, etc.
Complications of wound healing like infection, hyperpigmentation of scar, contractures, and keloid formation.
Andreas Schleicher presents PISA 2022 Volume III - Creative Thinking - 18 Jun...
Andreas Schleicher, Director of Education and Skills at the OECD presents at the launch of PISA 2022 Volume III - Creative Minds, Creative Schools on 18 June 2024.
RHEOLOGY Physical pharmaceutics-II notes for B.pharm 4th sem students
Physical pharmaceutics notes for B.pharm students
Mule event processing models | MuleSoft Mysore Meetup #47
Mule event processing models | MuleSoft Mysore Meetup #47
Event Link:- https://meetups.mulesoft.com/events/details/mulesoft-mysore-presents-mule-event-processing-models/
Agenda
● What is event processing in MuleSoft?
● Types of event processing models in Mule 4
● Distinction between the reactive, parallel, blocking & non-blocking processing
For Upcoming Meetups Join Mysore Meetup Group - https://meetups.mulesoft.com/mysore/YouTube:- youtube.com/@mulesoftmysore
Mysore WhatsApp group:- https://chat.whatsapp.com/EhqtHtCC75vCAX7gaO842N
Speaker:-
Shivani Yasaswi - https://www.linkedin.com/in/shivaniyasaswi/
Organizers:-
Shubham Chaurasia - https://www.linkedin.com/in/shubhamchaurasia1/
Giridhar Meka - https://www.linkedin.com/in/giridharmeka
Priya Shaw - https://www.linkedin.com/in/priya-shaw
Recently uploaded (20)
BIOLOGY NATIONAL EXAMINATION COUNCIL (NECO) 2024 PRACTICAL MANUAL.pptx
BIOLOGY NATIONAL EXAMINATION COUNCIL (NECO) 2024 PRACTICAL MANUAL.pptx
What is Digital Literacy? A guest blog from Andy McLaughlin, University of Ab...
What is Digital Literacy? A guest blog from Andy McLaughlin, University of Ab...
Jemison, MacLaughlin, and Majumder "Broadening Pathways for Editors and Authors"
Jemison, MacLaughlin, and Majumder "Broadening Pathways for Editors and Authors"
Chapter wise All Notes of First year Basic Civil Engineering.pptx
Chapter wise All Notes of First year Basic Civil Engineering.pptx
NEWSPAPERS - QUESTION 1 - REVISION POWERPOINT.pptx
NEWSPAPERS - QUESTION 1 - REVISION POWERPOINT.pptx
THE SACRIFICE HOW PRO-PALESTINE PROTESTS STUDENTS ARE SACRIFICING TO CHANGE T...
THE SACRIFICE HOW PRO-PALESTINE PROTESTS STUDENTS ARE SACRIFICING TO CHANGE T...
Andreas Schleicher presents PISA 2022 Volume III - Creative Thinking - 18 Jun...
Andreas Schleicher presents PISA 2022 Volume III - Creative Thinking - 18 Jun...
RHEOLOGY Physical pharmaceutics-II notes for B.pharm 4th sem students
RHEOLOGY Physical pharmaceutics-II notes for B.pharm 4th sem students
Mule event processing models | MuleSoft Mysore Meetup #47
Mule event processing models | MuleSoft Mysore Meetup #47
Juneteenth Freedom Day 2024 David Douglas School District
Juneteenth Freedom Day 2024 David Douglas School District