Download to read offline

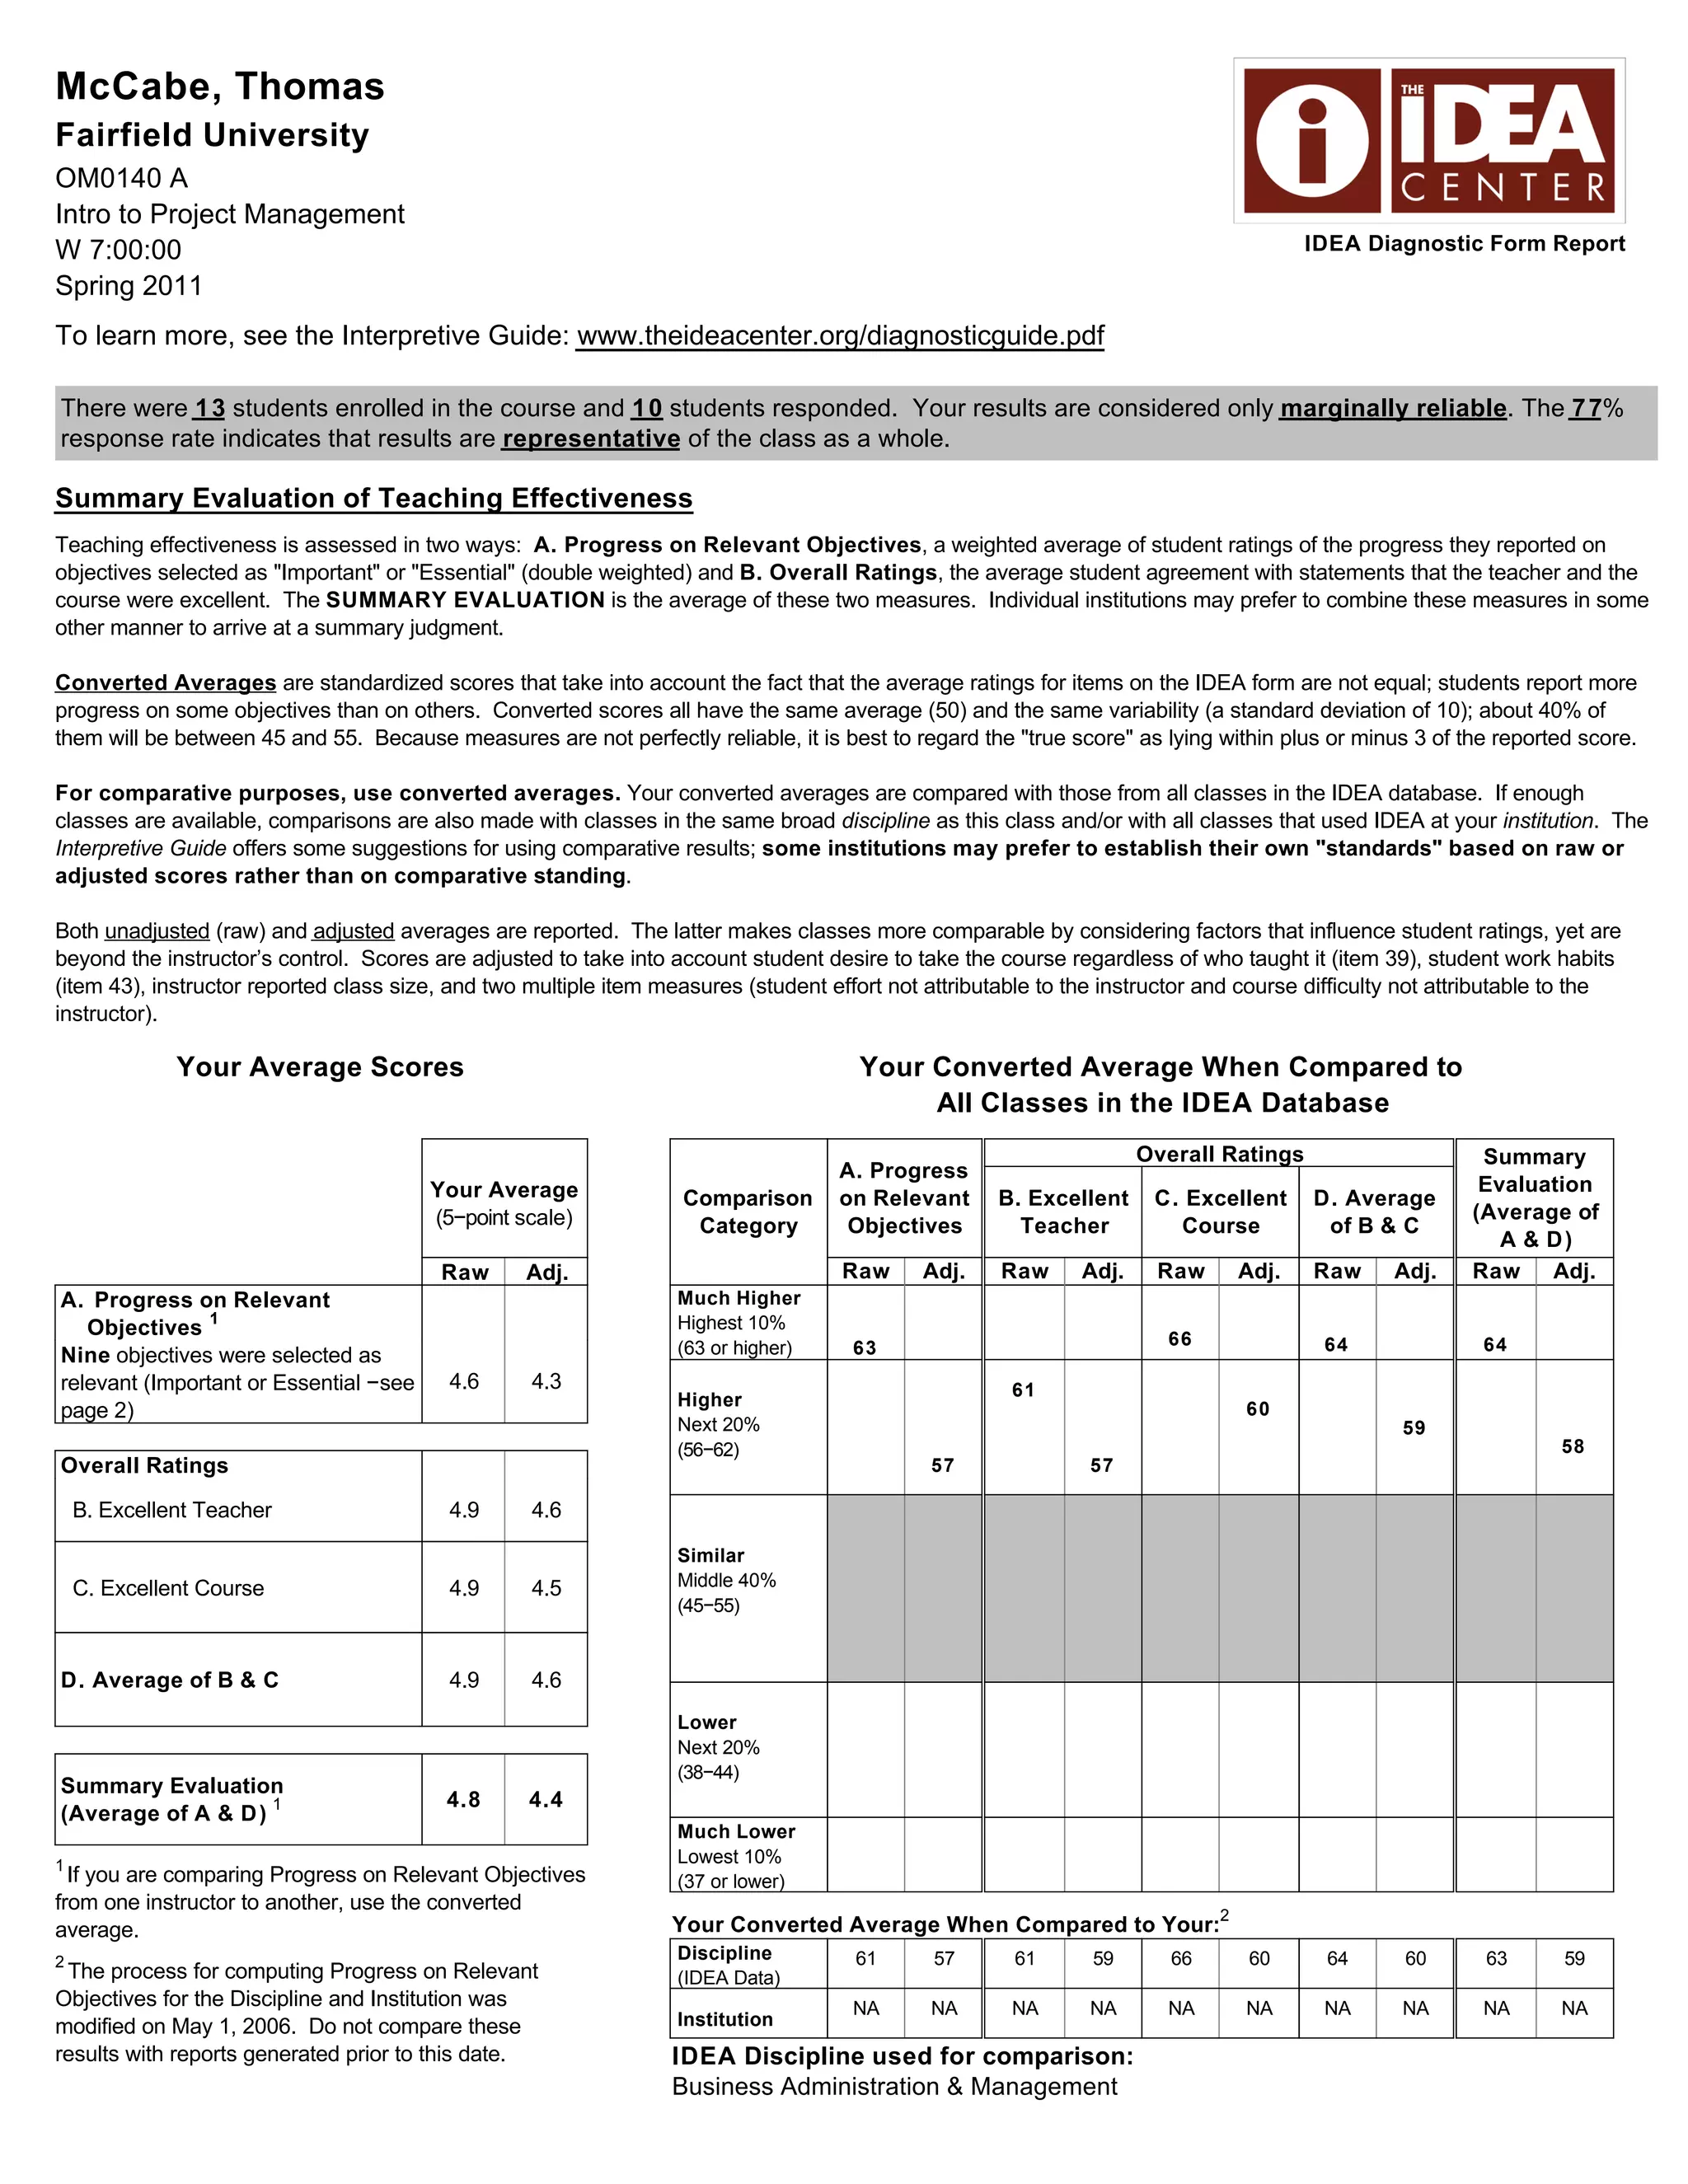
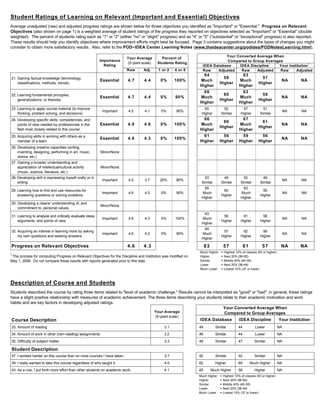
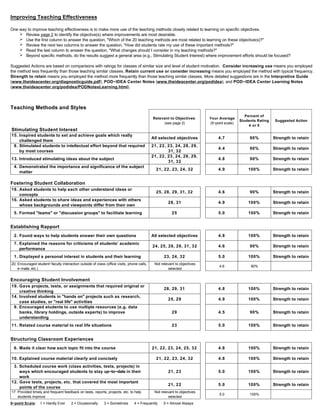
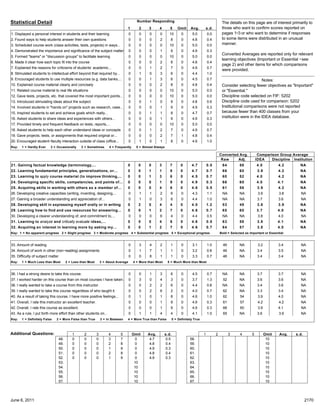

This document is an IDEA Diagnostic Form Report for a course on Intro to Project Management taught in the spring of 2011. It summarizes student ratings of the course and instructor across various metrics. Overall, student ratings placed the instructor in the top 10% compared to other classes for most metrics, including progress made on learning objectives, excellence of teaching, and excellence of the course. The report provides detailed ratings for specific learning objectives and suggestions to help the instructor further improve teaching effectiveness.


