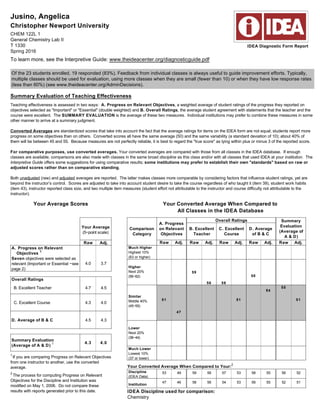
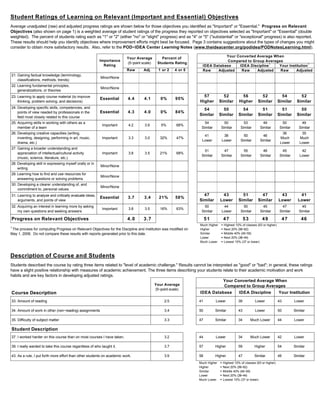
SlideShare a Scribd company logo
1 of 5
Download to read offline
IDEA Student Ratings of Instruction
Jusino, Angelica
CHEM 122L 1
General Chemistry Lab II
T
Christopher Newport University
03−28−2016 −04−08−2016
Comments: Use the space provided in the text area below for your comments.
Professor Jusino is always willing to help students outside of class.
Made me have to decide pulling an all nighter every week, thus destroying my health, and planning ahead. I chose
the prior but man, did it make me think.
Very nice teacher and good at explaining things
Prof. Jusino is a wonderful professor. She is very good at connecting with the students she teaches, which although
may be an attribute to her being young for a professor. She explains everything well and lets everyone know what
she expects along with what is to be expected once higher level classes are reached.
I really enjoyed this class although the lab reports were challenging?
Jusino, Angelica
Christopher Newport University
CHEM 122L 1
General Chemistry Lab II
T 1330
Spring 2016
IDEA Diagnostic Form Report
To learn more, see the Interpretive Guide: www.theideacenter.org/diagnosticguide.pdf
Of the 23 students enrolled, 19 responded (83%). Feedback from individual classes is always useful to guide improvement efforts. Typically,
multiple classes should be used for evaluation, using more classes when they are small (fewer than 10) or when they have low response rates
(less than 60%) (see www.theideacenter.org/AdminDecisions).
Summary Evaluation of Teaching Effectiveness
Teaching effectiveness is assessed in two ways: A. Progress on Relevant Objectives, a weighted average of student ratings of the progress they reported on
objectives selected as "Important" or "Essential" (double weighted) and B. Overall Ratings, the average student agreement with statements that the teacher and the
course were excellent. The SUMMARY EVALUATION is the average of these two measures. Individual institutions may prefer to combine these measures in some
other manner to arrive at a summary judgment.
Converted Averages are standardized scores that take into account the fact that the average ratings for items on the IDEA form are not equal; students report more
progress on some objectives than on others. Converted scores all have the same average (50) and the same variability (a standard deviation of 10); about 40% of
them will be between 45 and 55. Because measures are not perfectly reliable, it is best to regard the "true score" as lying within plus or minus 3 of the reported score.
For comparative purposes, use converted averages. Your converted averages are compared with those from all classes in the IDEA database. If enough
classes are available, comparisons are also made with classes in the same broad discipline as this class and/or with all classes that used IDEA at your institution. The
Interpretive Guide offers some suggestions for using comparative results; some institutions may prefer to establish their own "standards" based on raw or
adjusted scores rather than on comparative standing.
Both unadjusted (raw) and adjusted averages are reported. The latter makes classes more comparable by considering factors that influence student ratings, yet are
beyond the instructor’s control. Scores are adjusted to take into account student desire to take the course regardless of who taught it (item 39), student work habits
(item 43), instructor reported class size, and two multiple item measures (student effort not attributable to the instructor and course difficulty not attributable to the
instructor).
Your Average Scores
Your Average
(5−point scale)
Raw Adj.
A. Progress on Relevant
Objectives
1
Seven objectives were selected as
relevant (Important or Essential −see
page 2)
4.0 3.7
Overall Ratings
B. Excellent Teacher 4.7 4.5
C. Excellent Course 4.3 4.0
D. Average of B & C 4.5 4.3
Summary Evaluation
(Average of A & D)
1 4.3 4.0
1
If you are comparing Progress on Relevant Objectives
from one instructor to another, use the converted
average.
2
The process for computing Progress on Relevant
Objectives for the Discipline and Institution was
modified on May 1, 2006. Do not compare these
results with reports generated prior to this date.
Your Converted Average When Compared to
All Classes in the IDEA Database
Comparison
Category
Much Higher
Highest 10%
(63 or higher)
Higher
Next 20%
(56−62)
Similar
Middle 40%
(45−55)
Lower
Next 20%
(38−44)
Much Lower
Lowest 10%
(37 or lower)
Your Converted Average When Compared to Your:
2
Discipline
(IDEA Data)
Institution
IDEA Discipline used for comparison:
Chemistry
A. Progress
on Relevant
Objectives
Raw Adj.
51
53
47
47
49
46
B. Excellent
Teacher
Raw Adj.
59
59
58
56
56
56
C. Excellent
Course
Raw Adj.
56
57
54
51
53
53
D. Average
of B & C
Raw Adj.
58
58
56
54
55
55
Overall Ratings Summary
Evaluation
(Average of
A & D)
Raw Adj.
55
56
52
51
52
51
Student Ratings of Learning on Relevant (Important and Essential) Objectives
Average unadjusted (raw) and adjusted progress ratings are shown below for those objectives you identified as "Important" or "Essential." Progress on Relevant
Objectives (also shown on page 1) is a weighted average of student ratings of the progress they reported on objectives selected as "Important" or "Essential" (double
weighted). The percent of students rating each as "1" or "2" (either "no" or "slight" progress) and as "4" or "5" ("substantial" or "exceptional" progress) is also reported.
These results should help you identify objectives where improvement efforts might best be focused. Page 3 contains suggestions about the types of changes you might
consider to obtain more satisfactory results. Also, refer to the POD−IDEA Center Learning Notes (www.theideacenter.org/podidea/PODNotesLearning.html).
Importance
Rating
Your Average
(5−point scale)
Percent of
Students Rating
Raw Adj. 1 or 2 4 or 5
Your Converted Average When
Compared to Group Averages
IDEA Database IDEA Discipline
1
Your Institution
1
Raw Adjusted Raw Adjusted Raw Adjusted
21. Gaining factual knowledge (terminology,
classifications, methods, trends)
Minor/None
22. Learning fundamental principles,
generalizations, or theories
Minor/None
23. Learning to apply course material (to improve
thinking, problem solving, and decisions)
Essential 4.4 4.1 0% 95%
57
Higher
52
Similar
56
Higher
52
Similar
54
Similar
52
Similar
24. Developing specific skills, competencies, and
points of view needed by professionals in the
field most closely related to this course
Essential 4.3 4.0 0% 84%
54
Similar
50
Similar
54
Similar
51
Similar
51
Similar
50
Similar
25. Acquiring skills in working with others as a
member of a team
Important 4.2 3.9 5% 68%
54
Similar
50
Similar
53
Similar
49
Similar
50
Similar
49
Similar
26. Developing creative capacities (writing,
inventing, designing, performing in art, music,
drama, etc.)
Important 3.3 3.0 32% 47%
41
Lower
38
Lower
50
Similar
46
Similar
36
Much
Lower
35
Much
Lower
27. Gaining a broader understanding and
appreciation of intellectual/cultural activity
(music, science, literature, etc.)
Important 3.8 3.5 21% 68%
51
Similar
47
Similar
55
Similar
48
Similar
45
Similar
42
Lower
28. Developing skill in expressing myself orally or in
writing
Minor/None
29. Learning how to find and use resources for
answering questions or solving problems
Minor/None
30. Developing a clearer understanding of, and
commitment to, personal values
Minor/None
31. Learning to analyze and critically evaluate ideas,
arguments, and points of view
Essential 3.7 3.4 21% 58%
47
Similar
43
Lower
51
Similar
47
Similar
43
Lower
41
Lower
32. Acquiring an interest in learning more by asking
my own questions and seeking answers
Important 3.8 3.5 16% 63%
50
Similar
44
Lower
50
Similar
45
Similar
47
Similar
45
Similar
Progress on Relevant Objectives 4.0 3.7 51 47 53 49 47 46
1
The process for computing Progress on Relevant Objectives for the Discipline and Institution was modified on
May 1, 2006. Do not compare these results with reports generated prior to this date.
Much Higher = Highest 10% of classes (63 or higher)
Higher = Next 20% (56−62)
Similar = Middle 40% (45−55)
Lower = Next 20% (38−44)
Much Lower = Lowest 10% (37 or lower)
Description of Course and Students
Students described the course by rating three items related to "level of academic challenge." Results cannot be interpreted as "good" or "bad"; in general, these ratings
have a slight positive relationship with measures of academic achievement. The three items describing your students relate to their academic motivation and work
habits and are key factors in developing adjusted ratings.
Your Average
(5−point scale)
Course Description
Your Converted Average When
Compared to Group Averages
IDEA Database IDEA Discipline Your Institution
33. Amount of reading 2.5 41 Lower 39 Lower 43 Lower
34. Amount of work in other (non−reading) assignments 3.4 50 Similar 43 Lower 50 Similar
35. Difficulty of subject matter 3.3 47 Similar 34 Much Lower 44 Lower
Student Description
37. I worked harder on this course than on most courses I have taken. 3.2 44 Lower 34 Much Lower 42 Lower
39. I really wanted to take this course regardless of who taught it. 3.7 57 Higher 59 Higher 54 Similar
43. As a rule, I put forth more effort than other students on academic work. 3.9 58 Higher 47 Similar 49 Similar
Much Higher = Highest 10% of classes (63 or higher)
Higher = Next 20% (56−62)
Similar = Middle 40% (45−55)
Lower = Next 20% (38−44)
Much Lower = Lowest 10% (37 or lower)
Improving Teaching Effectiveness
One way to improve teaching effectiveness is to make more use of the teaching methods closely related to learning on specific objectives.
Review page 2 to identify the objective(s) where improvements are most desirable.
Use the first column to answer the question, "Which of the 20 teaching methods are most related to learning on these objective(s)?"
Review the next two columns to answer the question, "How did students rate my use of these important methods?"
Read the last column to answer the question, "What changes should I consider in my teaching methods?"
Beyond specific methods, do the results suggest a general area (e.g., Stimulating Student Interest) where improvement efforts should be focused?
Suggested Actions are based on comparisons with ratings for classes of similar size and level of student motivation. Consider increasing use means you employed
the method less frequently than those teaching similar classes. Retain current use or consider increasing means you employed the method with typical frequency.
Strength to retain means you employed the method more frequently than those teaching similar classes. More detailed suggestions are in the Interpretive Guide
(www.theideacenter.org/diagnosticguide.pdf), POD−IDEA Center Notes (www.theideacenter.org/podidea), and POD−IDEA Center Learning Notes
(www.theideacenter.org/podidea/PODNotesLearning.html).
Teaching Methods and Styles
Relevant to Objectives:
(see page 2)
Stimulating Student Interest
Your Average
(5−point scale)
Percent of
Students Rating
4 or 5
Suggested Action
13. Introduced stimulating ideas about the subject 23, 24, 26, 27, 31, 32 3.7 53%
Consider
increasing use
8. Stimulated students to intellectual effort beyond that required by most courses All selected objectives 4.0 68%
Retain current use or
consider increasing
15. Inspired students to set and achieve goals which really challenged them All selected objectives 3.7 58%
Retain current use or
consider increasing
4. Demonstrated the importance and significance of the subject matter 23, 24, 32 4.3 84%
Retain current use or
consider increasing
Fostering Student Collaboration
16. Asked students to share ideas and experiences with others
whose backgrounds and viewpoints differ from their own
25, 26, 27, 31 3.0 37%
Consider
increasing use
18. Asked students to help each other understand ideas or concepts 25, 26, 31, 32 4.1 74%
Retain current use or
consider increasing
5. Formed "teams" or "discussion groups" to facilitate learning 25 3.8 68%
Retain current use or
consider increasing
Establishing Rapport
7. Explained the reasons for criticisms of students’ academic performance 23, 24, 26, 27, 31, 32 4.2 79%
Retain current use or
consider increasing
2. Found ways to help students answer their own questions All selected objectives 4.3 89% Strength to retain
1. Displayed a personal interest in students and their learning 23, 24, 32 4.6 95% Strength to retain
20. Encouraged student−faculty interaction outside of class (office visits, phone calls,
e−mails, etc.)
Not relevant to objectives
selected
4.4 95%
Encouraging Student Involvement
19. Gave projects, tests, or assignments that required original or
creative thinking
25, 26, 27, 31 3.6 63%
Consider
increasing use
11. Related course material to real life situations 23, 24 4.1 79%
Retain current use or
consider increasing
14. Involved students in "hands on" projects such as research, case studies, or "real
life" activities
25 4.3 79%
Retain current use or
consider increasing
9. Encouraged students to use multiple resources (e.g. data banks, library holdings,
outside experts) to improve understanding
Not relevant to objectives
selected
4.0 74%
Structuring Classroom Experiences
6. Made it clear how each topic fit into the course 23, 24, 27, 32 4.2 79%
Retain current use or
consider increasing
10. Explained course material clearly and concisely 23, 24, 27 4.5 84% Strength to retain
3. Scheduled course work (class activities, tests, projects) in ways which
encouraged students to stay up−to−date in their work
Not relevant to objectives
selected
4.3 89%
12. Gave tests, projects, etc. that covered the most important points of the course
Not relevant to objectives
selected
4.3 74%
17. Provided timely and frequent feedback on tests, reports, projects, etc. to help
students improve
Not relevant to objectives
selected
4.1 74%
5−point Scale: 1 = Hardly Ever 2 = Occasionally 3 = Sometimes 4 = Frequently 5 = Almost Always
Statistical Detail Number Responding
1 2 3 4 5 Omit Avg. s.d.
The details on this page are of interest primarily to
those who want to confirm scores reported on
pages 1−3 or who want to determine if responses
to some items were distributed in an unusual
manner.
Converted Averages are reported only for relevant
learning objectives (Important or Essential −see
page 2) and other items for which comparisons
were provided.
Notes:
Discipline code selected on FIF: 4005
Discipline code used for comparison: 4005
1. Displayed a personal interest in students and their learning 0 0 1 5 13 0 4.6 0.6
2. Found ways to help students answer their own questions 0 1 1 9 8 0 4.3 0.8
3. Scheduled course work (class activities, tests, projects) in ways... 1 0 1 7 10 0 4.3 1.0
4. Demonstrated the importance and significance of the subject matter 0 1 2 7 9 0 4.3 0.9
5. Formed "teams" or "discussion groups" to facilitate learning 2 2 2 5 8 0 3.8 1.4
6. Made it clear how each topic fit into the course 0 1 3 6 9 0 4.2 0.9
7. Explained the reasons for criticisms of students’ academic... 0 1 3 6 9 0 4.2 0.9
8. Stimulated students to intellectual effort beyond that required by... 0 2 4 5 8 0 4.0 1.1
9. Encouraged students to use multiple resources (e.g. data banks,... 1 2 2 5 9 0 4.0 1.2
10. Explained course material clearly and concisely 0 0 3 3 13 0 4.5 0.8
11. Related course material to real life situations 0 3 1 6 9 0 4.1 1.1
12. Gave tests, projects, etc. that covered the most important points... 0 0 5 3 11 0 4.3 0.9
13. Introduced stimulating ideas about the subject 1 1 7 3 7 0 3.7 1.2
14. Involved students in "hands on" projects such as research, case... 1 0 3 4 11 0 4.3 1.1
15. Inspired students to set and achieve goals which really... 1 2 5 5 6 0 3.7 1.2
16. Asked students to share ideas and experiences with others... 5 3 4 2 5 0 2.9 1.6
17. Provided timely and frequent feedback on tests, reports,... 0 2 3 6 8 0 4.1 1.0
18. Asked students to help each other understand ideas or concepts 2 0 3 4 10 0 4.1 1.3
19. Gave projects, tests, or assignments that required original or... 4 0 3 4 8 0 3.6 1.6
20. Encouraged student−faculty interaction outside of class (office... 1 0 0 8 10 0 4.4 1.0
Key: 1 = Hardly Ever 2 = Occasionally 3 = Sometimes 4 = Frequently 5 = Almost Always
Converted Avg. Comparison Group Average
Raw Adj. IDEA Discipline Institution
21. Gaining factual knowledge (terminology, classifications,... 0 0 3 6 10 0 4.4 0.8 NA NA 4.0 4.2 4.3
22. Learning fundamental principles, generalizations, or theories 0 0 5 6 8 0 4.2 0.8 NA NA 3.9 4.2 4.2
23. Learning to apply course material (to improve thinking,... 0 0 1 10 8 0 4.4 0.6 57 52 4.0 4.1 4.2
24. Developing specific skills, competencies, and points of... 0 0 3 8 8 0 4.3 0.7 54 50 4.0 4.1 4.2
25. Acquiring skills in working with others as a member of... 0 1 5 3 10 0 4.2 1.0 54 50 3.9 4.0 4.2
26. Developing creative capacities (writing, inventing,... 3 3 4 4 5 0 3.3 1.4 41 38 3.9 3.3 4.2
27. Gaining a broader understanding and appreciation of... 4 0 2 3 10 0 3.8 1.6 51 47 3.7 3.5 4.1
28. Developing skill in expressing myself orally or in writing 5 0 4 3 7 0 3.4 1.6 NA NA 3.8 3.4 4.1
29. Learning how to find and use resources for answering questions... 0 0 6 5 8 0 4.1 0.9 NA NA 3.7 3.8 4.0
30. Developing a clearer understanding of, and commitment to,... 5 1 3 4 6 0 3.3 1.6 NA NA 3.8 3.4 3.9
31. Learning to analyze and critically evaluate ideas,... 2 2 4 3 8 0 3.7 1.4 47 43 3.8 3.6 4.1
32. Acquiring an interest in learning more by asking my... 0 3 4 6 6 0 3.8 1.1 50 44 3.8 3.8 3.9
Key: 1 = No apparent progress 2 = Slight progress 3 = Moderate progress 4 = Substantial progress 5 = Exceptional progress Bold = Selected as Important or Essential
33. Amount of reading 4 3 10 2 0 0 2.5 1.0 41 NA 3.2 3.2 3.1
34. Amount of work in other (non−reading) assignments 0 2 8 8 1 0 3.4 0.8 50 NA 3.4 3.8 3.4
35. Difficulty of subject matter 0 3 8 8 0 0 3.3 0.7 47 NA 3.4 4.1 3.6
Key: 1 = Much Less than Most 2 = Less than Most 3 = About Average 4 = More than Most 5 = Much More than Most
36. I had a strong desire to take this course. 1 1 2 8 7 0 4.0 1.1 NA NA 3.7 3.5 3.7
37. I worked harder on this course than on most courses I have taken. 2 3 6 5 3 0 3.2 1.2 44 NA 3.6 4.0 3.7
38. I really wanted to take a course from this instructor. 6 0 7 3 3 0 2.8 1.5 NA NA 3.4 3.5 3.5
39. I really wanted to take this course regardless of who taught it. 1 2 4 6 6 0 3.7 1.2 57 NA 3.3 3.3 3.5
40. As a result of taking this course, I have more positive feelings... 0 0 6 5 8 0 4.1 0.9 54 49 3.9 3.7 3.9
41. Overall, I rate this instructor an excellent teacher. 0 0 0 5 14 0 4.7 0.5 59 56 4.2 4.2 4.3
42. Overall, I rate this course as excellent. 0 0 3 8 8 0 4.3 0.7 56 51 3.9 3.8 4.0
43. As a rule, I put forth more effort than other students on... 0 1 5 8 5 0 3.9 0.9 58 NA 3.6 4.0 3.9
Key: 1 = Definitely False 2 = More False than True 3 = In Between 4 = More True than False 5 = Definitely True
No Additional Questions.
April 13, 2016 18463

More Related Content

What's hot

Designing and conducting formative evaluations
Designing and conducting formative evaluationsDesigning and conducting formative evaluations
Designing and conducting formative evaluationscw8842
 
Journal of College Admissions
Journal of College AdmissionsJournal of College Admissions
Journal of College AdmissionsTrisha Carney
 
Writing short and long answer exam questions, Liz Norman 2017
Writing short and long answer exam questions, Liz Norman 2017Writing short and long answer exam questions, Liz Norman 2017
Writing short and long answer exam questions, Liz Norman 2017Liz Norman
 
Designing and conducting formative evaluations chapter 10
Designing and conducting formative evaluations chapter 10Designing and conducting formative evaluations chapter 10
Designing and conducting formative evaluations chapter 10TiekaWilkins
 
E:\T&La Special Projects\Computer Engineering & Applied Science\Grade...
E:\T&La Special Projects\Computer Engineering & Applied Science\Grade...E:\T&La Special Projects\Computer Engineering & Applied Science\Grade...
E:\T&La Special Projects\Computer Engineering & Applied Science\Grade...guest3f9d24
 
Graded Assessment – Myth Or Fact Ppt Jan 2k10
Graded Assessment – Myth Or Fact Ppt Jan 2k10Graded Assessment – Myth Or Fact Ppt Jan 2k10
Graded Assessment – Myth Or Fact Ppt Jan 2k10KeithH66
 
EDU 675 Entire Course NEW
EDU 675 Entire Course NEWEDU 675 Entire Course NEW
EDU 675 Entire Course NEWshyamuopnine
 
Week 1 lecture data in our classrooms
Week 1 lecture data in our classroomsWeek 1 lecture data in our classrooms
Week 1 lecture data in our classroomsncibarra
 
11.descriptive evaluation of the primary schools an overview
11.descriptive evaluation of the primary schools an overview11.descriptive evaluation of the primary schools an overview
11.descriptive evaluation of the primary schools an overviewAlexander Decker
 
Descriptive evaluation of the primary schools an overview
Descriptive evaluation of the primary schools an overviewDescriptive evaluation of the primary schools an overview
Descriptive evaluation of the primary schools an overviewAlexander Decker
 
teaching material
teaching material teaching material
teaching material Kadek Astiti
 
Effective feedback practices in formative assessment recognizing the relevance
Effective feedback practices in formative assessment   recognizing the relevanceEffective feedback practices in formative assessment   recognizing the relevance
Effective feedback practices in formative assessment recognizing the relevanceAlexander Decker
 
Guidelines in Assessing Knowledge, Process, Understanding, and Performance/Pr...
Guidelines in Assessing Knowledge, Process, Understanding, and Performance/Pr...Guidelines in Assessing Knowledge, Process, Understanding, and Performance/Pr...
Guidelines in Assessing Knowledge, Process, Understanding, and Performance/Pr...Carlo Magno
 
Standardized Testing
Standardized TestingStandardized Testing
Standardized TestingMiss EAP
 
EMOTION DETECTION AND OPINION MINING FROM STUDENT COMMENTS FOR TEACHING INNOV...
EMOTION DETECTION AND OPINION MINING FROM STUDENT COMMENTS FOR TEACHING INNOV...EMOTION DETECTION AND OPINION MINING FROM STUDENT COMMENTS FOR TEACHING INNOV...
EMOTION DETECTION AND OPINION MINING FROM STUDENT COMMENTS FOR TEACHING INNOV...ijejournal
 
Standards based unit assessment design for k to 12
Standards based unit assessment design for k to 12 Standards based unit assessment design for k to 12
Standards based unit assessment design for k to 12 Ian Martije
 
Assessment tools
Assessment toolsAssessment tools
Assessment toolsJhullieKim
 
Developing assessment instruments
Developing assessment instrumentsDeveloping assessment instruments
Developing assessment instrumentsRaheen26
 

What's hot (20)

Designing and conducting formative evaluations
Designing and conducting formative evaluationsDesigning and conducting formative evaluations
Designing and conducting formative evaluations
 
Journal of College Admissions
Journal of College AdmissionsJournal of College Admissions
Journal of College Admissions
 
Writing short and long answer exam questions, Liz Norman 2017
Writing short and long answer exam questions, Liz Norman 2017Writing short and long answer exam questions, Liz Norman 2017
Writing short and long answer exam questions, Liz Norman 2017
 
Designing and conducting formative evaluations chapter 10
Designing and conducting formative evaluations chapter 10Designing and conducting formative evaluations chapter 10
Designing and conducting formative evaluations chapter 10
 
E:\T&La Special Projects\Computer Engineering & Applied Science\Grade...
E:\T&La Special Projects\Computer Engineering & Applied Science\Grade...E:\T&La Special Projects\Computer Engineering & Applied Science\Grade...
E:\T&La Special Projects\Computer Engineering & Applied Science\Grade...
 
Graded Assessment – Myth Or Fact Ppt Jan 2k10
Graded Assessment – Myth Or Fact Ppt Jan 2k10Graded Assessment – Myth Or Fact Ppt Jan 2k10
Graded Assessment – Myth Or Fact Ppt Jan 2k10
 
EDU 675 Entire Course NEW
EDU 675 Entire Course NEWEDU 675 Entire Course NEW
EDU 675 Entire Course NEW
 
Week 1 lecture data in our classrooms
Week 1 lecture data in our classroomsWeek 1 lecture data in our classrooms
Week 1 lecture data in our classrooms
 
11.descriptive evaluation of the primary schools an overview
11.descriptive evaluation of the primary schools an overview11.descriptive evaluation of the primary schools an overview
11.descriptive evaluation of the primary schools an overview
 
Descriptive evaluation of the primary schools an overview
Descriptive evaluation of the primary schools an overviewDescriptive evaluation of the primary schools an overview
Descriptive evaluation of the primary schools an overview
 
teaching material
teaching material teaching material
teaching material
 
Effective feedback practices in formative assessment recognizing the relevance
Effective feedback practices in formative assessment   recognizing the relevanceEffective feedback practices in formative assessment   recognizing the relevance
Effective feedback practices in formative assessment recognizing the relevance
 
Common Core State Standards
Common Core State StandardsCommon Core State Standards
Common Core State Standards
 
Guidelines in Assessing Knowledge, Process, Understanding, and Performance/Pr...
Guidelines in Assessing Knowledge, Process, Understanding, and Performance/Pr...Guidelines in Assessing Knowledge, Process, Understanding, and Performance/Pr...
Guidelines in Assessing Knowledge, Process, Understanding, and Performance/Pr...
 
Ch. 10 powerpoint apt 501
Ch. 10 powerpoint apt 501Ch. 10 powerpoint apt 501
Ch. 10 powerpoint apt 501
 
Standardized Testing
Standardized TestingStandardized Testing
Standardized Testing
 
EMOTION DETECTION AND OPINION MINING FROM STUDENT COMMENTS FOR TEACHING INNOV...
EMOTION DETECTION AND OPINION MINING FROM STUDENT COMMENTS FOR TEACHING INNOV...EMOTION DETECTION AND OPINION MINING FROM STUDENT COMMENTS FOR TEACHING INNOV...
EMOTION DETECTION AND OPINION MINING FROM STUDENT COMMENTS FOR TEACHING INNOV...
 
Standards based unit assessment design for k to 12
Standards based unit assessment design for k to 12 Standards based unit assessment design for k to 12
Standards based unit assessment design for k to 12
 
Assessment tools
Assessment toolsAssessment tools
Assessment tools
 
Developing assessment instruments
Developing assessment instrumentsDeveloping assessment instruments
Developing assessment instruments
 

Similar to merged_document_2

Assessment 15 Annotated
Assessment 15 AnnotatedAssessment 15 Annotated
Assessment 15 AnnotatedJames Atherton
 
Developing assessment instruments
Developing assessment instrumentsDeveloping assessment instruments
Developing assessment instrumentsJCrawford62
 
Assessing our students 2 ppt
Assessing our students 2 pptAssessing our students 2 ppt
Assessing our students 2 pptJim Marteney
 
PISD Assessment and PLC Presentation
PISD Assessment and PLC PresentationPISD Assessment and PLC Presentation
PISD Assessment and PLC PresentationMary Hooper
 
Role on standarized and non standarized test in guidance on counseling
Role on standarized and non standarized test in guidance on counselingRole on standarized and non standarized test in guidance on counseling
Role on standarized and non standarized test in guidance on counselingUmaRani841531
 
Intended Learning Outcome for improving the Quality of higher Education
Intended Learning Outcome for improving the Quality of higher EducationIntended Learning Outcome for improving the Quality of higher Education
Intended Learning Outcome for improving the Quality of higher EducationMd. Nazrul Islam
 
PERA & SB 7 Principal Work
PERA & SB 7 Principal WorkPERA & SB 7 Principal Work
PERA & SB 7 Principal WorkRichard Voltz
 
Developing Student Confidence
Developing Student ConfidenceDeveloping Student Confidence
Developing Student Confidencemmcdowell13
 
COMPARATIVE REVIEW OF CRITERION REFERENCED TESTS (CRTs) AND NORM REFERENCED T...
COMPARATIVE REVIEW OF CRITERION REFERENCED TESTS (CRTs) AND NORM REFERENCED T...COMPARATIVE REVIEW OF CRITERION REFERENCED TESTS (CRTs) AND NORM REFERENCED T...
COMPARATIVE REVIEW OF CRITERION REFERENCED TESTS (CRTs) AND NORM REFERENCED T...Tasneem Ahmad
 
Administering,scoring and reporting a test ppt
Administering,scoring and reporting a test pptAdministering,scoring and reporting a test ppt
Administering,scoring and reporting a test pptManali Solanki
 
Selectingn course evaluation
Selectingn course evaluationSelectingn course evaluation
Selectingn course evaluationAshley Kovacs
 

Similar to merged_document_2 (20)

merged_document
merged_documentmerged_document
merged_document
 
2016 McCabe Brown Student Feedback - Benchmark Results
2016 McCabe Brown Student Feedback - Benchmark Results2016 McCabe Brown Student Feedback - Benchmark Results
2016 McCabe Brown Student Feedback - Benchmark Results
 
2016 McCabe-Brown Student Feedback - Benchmark Results
2016 McCabe-Brown Student Feedback - Benchmark Results2016 McCabe-Brown Student Feedback - Benchmark Results
2016 McCabe-Brown Student Feedback - Benchmark Results
 
Intro to rubrics
Intro to rubricsIntro to rubrics
Intro to rubrics
 
Intro to rubrics
Intro to rubricsIntro to rubrics
Intro to rubrics
 
Standards In Practice
Standards In PracticeStandards In Practice
Standards In Practice
 
Standards In Practice
Standards In PracticeStandards In Practice
Standards In Practice
 
Assessment 15 Annotated
Assessment 15 AnnotatedAssessment 15 Annotated
Assessment 15 Annotated
 
Overview of Assessment Ch. 3
Overview of Assessment Ch. 3Overview of Assessment Ch. 3
Overview of Assessment Ch. 3
 
Developing assessment instruments
Developing assessment instrumentsDeveloping assessment instruments
Developing assessment instruments
 
Assessing our students 2 ppt
Assessing our students 2 pptAssessing our students 2 ppt
Assessing our students 2 ppt
 
PISD Assessment and PLC Presentation
PISD Assessment and PLC PresentationPISD Assessment and PLC Presentation
PISD Assessment and PLC Presentation
 
Role on standarized and non standarized test in guidance on counseling
Role on standarized and non standarized test in guidance on counselingRole on standarized and non standarized test in guidance on counseling
Role on standarized and non standarized test in guidance on counseling
 
Intended Learning Outcome for improving the Quality of higher Education
Intended Learning Outcome for improving the Quality of higher EducationIntended Learning Outcome for improving the Quality of higher Education
Intended Learning Outcome for improving the Quality of higher Education
 
PERA & SB 7 Principal Work
PERA & SB 7 Principal WorkPERA & SB 7 Principal Work
PERA & SB 7 Principal Work
 
scoring_moderation.pptx
scoring_moderation.pptxscoring_moderation.pptx
scoring_moderation.pptx
 
Developing Student Confidence
Developing Student ConfidenceDeveloping Student Confidence
Developing Student Confidence
 
COMPARATIVE REVIEW OF CRITERION REFERENCED TESTS (CRTs) AND NORM REFERENCED T...
COMPARATIVE REVIEW OF CRITERION REFERENCED TESTS (CRTs) AND NORM REFERENCED T...COMPARATIVE REVIEW OF CRITERION REFERENCED TESTS (CRTs) AND NORM REFERENCED T...
COMPARATIVE REVIEW OF CRITERION REFERENCED TESTS (CRTs) AND NORM REFERENCED T...
 
Administering,scoring and reporting a test ppt
Administering,scoring and reporting a test pptAdministering,scoring and reporting a test ppt
Administering,scoring and reporting a test ppt
 
Selectingn course evaluation
Selectingn course evaluationSelectingn course evaluation
Selectingn course evaluation
 

merged_document_2

  • 1. IDEA Student Ratings of Instruction Jusino, Angelica CHEM 122L 1 General Chemistry Lab II T Christopher Newport University 03−28−2016 −04−08−2016 Comments: Use the space provided in the text area below for your comments. Professor Jusino is always willing to help students outside of class. Made me have to decide pulling an all nighter every week, thus destroying my health, and planning ahead. I chose the prior but man, did it make me think. Very nice teacher and good at explaining things Prof. Jusino is a wonderful professor. She is very good at connecting with the students she teaches, which although may be an attribute to her being young for a professor. She explains everything well and lets everyone know what she expects along with what is to be expected once higher level classes are reached. I really enjoyed this class although the lab reports were challenging?
  • 2. Jusino, Angelica Christopher Newport University CHEM 122L 1 General Chemistry Lab II T 1330 Spring 2016 IDEA Diagnostic Form Report To learn more, see the Interpretive Guide: www.theideacenter.org/diagnosticguide.pdf Of the 23 students enrolled, 19 responded (83%). Feedback from individual classes is always useful to guide improvement efforts. Typically, multiple classes should be used for evaluation, using more classes when they are small (fewer than 10) or when they have low response rates (less than 60%) (see www.theideacenter.org/AdminDecisions). Of the 23 students enrolled, 19 responded (83%). Feedback from individual classes is always useful to guide improvement efforts. Typically, multiple classes should be used for evaluation, using more classes when they are small (fewer than 10) or when they have low response rates (less than 60%) (see www.theideacenter.org/AdminDecisions). Summary Evaluation of Teaching Effectiveness Teaching effectiveness is assessed in two ways: A. Progress on Relevant Objectives, a weighted average of student ratings of the progress they reported on objectives selected as "Important" or "Essential" (double weighted) and B. Overall Ratings, the average student agreement with statements that the teacher and the course were excellent. The SUMMARY EVALUATION is the average of these two measures. Individual institutions may prefer to combine these measures in some other manner to arrive at a summary judgment. Converted Averages are standardized scores that take into account the fact that the average ratings for items on the IDEA form are not equal; students report more progress on some objectives than on others. Converted scores all have the same average (50) and the same variability (a standard deviation of 10); about 40% of them will be between 45 and 55. Because measures are not perfectly reliable, it is best to regard the "true score" as lying within plus or minus 3 of the reported score. For comparative purposes, use converted averages. Your converted averages are compared with those from all classes in the IDEA database. If enough classes are available, comparisons are also made with classes in the same broad discipline as this class and/or with all classes that used IDEA at your institution. The Interpretive Guide offers some suggestions for using comparative results; some institutions may prefer to establish their own "standards" based on raw or adjusted scores rather than on comparative standing. Both unadjusted (raw) and adjusted averages are reported. The latter makes classes more comparable by considering factors that influence student ratings, yet are beyond the instructor’s control. Scores are adjusted to take into account student desire to take the course regardless of who taught it (item 39), student work habits (item 43), instructor reported class size, and two multiple item measures (student effort not attributable to the instructor and course difficulty not attributable to the instructor). Your Average Scores Your Average (5−point scale) Raw Adj. A. Progress on Relevant Objectives 1 Seven objectives were selected as relevant (Important or Essential −see page 2) 4.0 3.7 Overall Ratings B. Excellent Teacher 4.7 4.5 C. Excellent Course 4.3 4.0 D. Average of B & C 4.5 4.3 Summary Evaluation (Average of A & D) 1 4.3 4.0 1 If you are comparing Progress on Relevant Objectives from one instructor to another, use the converted average. 2 The process for computing Progress on Relevant Objectives for the Discipline and Institution was modified on May 1, 2006. Do not compare these results with reports generated prior to this date. Your Converted Average When Compared to All Classes in the IDEA Database Comparison Category Much Higher Highest 10% (63 or higher) Higher Next 20% (56−62) Similar Middle 40% (45−55) Lower Next 20% (38−44) Much Lower Lowest 10% (37 or lower) Your Converted Average When Compared to Your: 2 Discipline (IDEA Data) Institution IDEA Discipline used for comparison: Chemistry A. Progress on Relevant Objectives Raw Adj. 51 53 47 47 49 46 B. Excellent Teacher Raw Adj. 59 59 58 56 56 56 C. Excellent Course Raw Adj. 56 57 54 51 53 53 D. Average of B & C Raw Adj. 58 58 56 54 55 55 Overall Ratings Summary Evaluation (Average of A & D) Raw Adj. 55 56 52 51 52 51
  • 3. Student Ratings of Learning on Relevant (Important and Essential) Objectives Average unadjusted (raw) and adjusted progress ratings are shown below for those objectives you identified as "Important" or "Essential." Progress on Relevant Objectives (also shown on page 1) is a weighted average of student ratings of the progress they reported on objectives selected as "Important" or "Essential" (double weighted). The percent of students rating each as "1" or "2" (either "no" or "slight" progress) and as "4" or "5" ("substantial" or "exceptional" progress) is also reported. These results should help you identify objectives where improvement efforts might best be focused. Page 3 contains suggestions about the types of changes you might consider to obtain more satisfactory results. Also, refer to the POD−IDEA Center Learning Notes (www.theideacenter.org/podidea/PODNotesLearning.html). Importance Rating Your Average (5−point scale) Percent of Students Rating Raw Adj. 1 or 2 4 or 5 Your Converted Average When Compared to Group Averages IDEA Database IDEA Discipline 1 Your Institution 1 Raw Adjusted Raw Adjusted Raw Adjusted 21. Gaining factual knowledge (terminology, classifications, methods, trends) Minor/None 22. Learning fundamental principles, generalizations, or theories Minor/None 23. Learning to apply course material (to improve thinking, problem solving, and decisions) Essential 4.4 4.1 0% 95% 57 Higher 52 Similar 56 Higher 52 Similar 54 Similar 52 Similar 24. Developing specific skills, competencies, and points of view needed by professionals in the field most closely related to this course Essential 4.3 4.0 0% 84% 54 Similar 50 Similar 54 Similar 51 Similar 51 Similar 50 Similar 25. Acquiring skills in working with others as a member of a team Important 4.2 3.9 5% 68% 54 Similar 50 Similar 53 Similar 49 Similar 50 Similar 49 Similar 26. Developing creative capacities (writing, inventing, designing, performing in art, music, drama, etc.) Important 3.3 3.0 32% 47% 41 Lower 38 Lower 50 Similar 46 Similar 36 Much Lower 35 Much Lower 27. Gaining a broader understanding and appreciation of intellectual/cultural activity (music, science, literature, etc.) Important 3.8 3.5 21% 68% 51 Similar 47 Similar 55 Similar 48 Similar 45 Similar 42 Lower 28. Developing skill in expressing myself orally or in writing Minor/None 29. Learning how to find and use resources for answering questions or solving problems Minor/None 30. Developing a clearer understanding of, and commitment to, personal values Minor/None 31. Learning to analyze and critically evaluate ideas, arguments, and points of view Essential 3.7 3.4 21% 58% 47 Similar 43 Lower 51 Similar 47 Similar 43 Lower 41 Lower 32. Acquiring an interest in learning more by asking my own questions and seeking answers Important 3.8 3.5 16% 63% 50 Similar 44 Lower 50 Similar 45 Similar 47 Similar 45 Similar Progress on Relevant Objectives 4.0 3.7 51 47 53 49 47 46 1 The process for computing Progress on Relevant Objectives for the Discipline and Institution was modified on May 1, 2006. Do not compare these results with reports generated prior to this date. Much Higher = Highest 10% of classes (63 or higher) Higher = Next 20% (56−62) Similar = Middle 40% (45−55) Lower = Next 20% (38−44) Much Lower = Lowest 10% (37 or lower) Description of Course and Students Students described the course by rating three items related to "level of academic challenge." Results cannot be interpreted as "good" or "bad"; in general, these ratings have a slight positive relationship with measures of academic achievement. The three items describing your students relate to their academic motivation and work habits and are key factors in developing adjusted ratings. Your Average (5−point scale) Course Description Your Converted Average When Compared to Group Averages IDEA Database IDEA Discipline Your Institution 33. Amount of reading 2.5 41 Lower 39 Lower 43 Lower 34. Amount of work in other (non−reading) assignments 3.4 50 Similar 43 Lower 50 Similar 35. Difficulty of subject matter 3.3 47 Similar 34 Much Lower 44 Lower Student Description 37. I worked harder on this course than on most courses I have taken. 3.2 44 Lower 34 Much Lower 42 Lower 39. I really wanted to take this course regardless of who taught it. 3.7 57 Higher 59 Higher 54 Similar 43. As a rule, I put forth more effort than other students on academic work. 3.9 58 Higher 47 Similar 49 Similar Much Higher = Highest 10% of classes (63 or higher) Higher = Next 20% (56−62) Similar = Middle 40% (45−55) Lower = Next 20% (38−44) Much Lower = Lowest 10% (37 or lower)
  • 4. Improving Teaching Effectiveness One way to improve teaching effectiveness is to make more use of the teaching methods closely related to learning on specific objectives. Review page 2 to identify the objective(s) where improvements are most desirable. Use the first column to answer the question, "Which of the 20 teaching methods are most related to learning on these objective(s)?" Review the next two columns to answer the question, "How did students rate my use of these important methods?" Read the last column to answer the question, "What changes should I consider in my teaching methods?" Beyond specific methods, do the results suggest a general area (e.g., Stimulating Student Interest) where improvement efforts should be focused? Suggested Actions are based on comparisons with ratings for classes of similar size and level of student motivation. Consider increasing use means you employed the method less frequently than those teaching similar classes. Retain current use or consider increasing means you employed the method with typical frequency. Strength to retain means you employed the method more frequently than those teaching similar classes. More detailed suggestions are in the Interpretive Guide (www.theideacenter.org/diagnosticguide.pdf), POD−IDEA Center Notes (www.theideacenter.org/podidea), and POD−IDEA Center Learning Notes (www.theideacenter.org/podidea/PODNotesLearning.html). Teaching Methods and Styles Relevant to Objectives: (see page 2) Stimulating Student Interest Your Average (5−point scale) Percent of Students Rating 4 or 5 Suggested Action 13. Introduced stimulating ideas about the subject 23, 24, 26, 27, 31, 32 3.7 53% Consider increasing use 8. Stimulated students to intellectual effort beyond that required by most courses All selected objectives 4.0 68% Retain current use or consider increasing 15. Inspired students to set and achieve goals which really challenged them All selected objectives 3.7 58% Retain current use or consider increasing 4. Demonstrated the importance and significance of the subject matter 23, 24, 32 4.3 84% Retain current use or consider increasing Fostering Student Collaboration 16. Asked students to share ideas and experiences with others whose backgrounds and viewpoints differ from their own 25, 26, 27, 31 3.0 37% Consider increasing use 18. Asked students to help each other understand ideas or concepts 25, 26, 31, 32 4.1 74% Retain current use or consider increasing 5. Formed "teams" or "discussion groups" to facilitate learning 25 3.8 68% Retain current use or consider increasing Establishing Rapport 7. Explained the reasons for criticisms of students’ academic performance 23, 24, 26, 27, 31, 32 4.2 79% Retain current use or consider increasing 2. Found ways to help students answer their own questions All selected objectives 4.3 89% Strength to retain 1. Displayed a personal interest in students and their learning 23, 24, 32 4.6 95% Strength to retain 20. Encouraged student−faculty interaction outside of class (office visits, phone calls, e−mails, etc.) Not relevant to objectives selected 4.4 95% Encouraging Student Involvement 19. Gave projects, tests, or assignments that required original or creative thinking 25, 26, 27, 31 3.6 63% Consider increasing use 11. Related course material to real life situations 23, 24 4.1 79% Retain current use or consider increasing 14. Involved students in "hands on" projects such as research, case studies, or "real life" activities 25 4.3 79% Retain current use or consider increasing 9. Encouraged students to use multiple resources (e.g. data banks, library holdings, outside experts) to improve understanding Not relevant to objectives selected 4.0 74% Structuring Classroom Experiences 6. Made it clear how each topic fit into the course 23, 24, 27, 32 4.2 79% Retain current use or consider increasing 10. Explained course material clearly and concisely 23, 24, 27 4.5 84% Strength to retain 3. Scheduled course work (class activities, tests, projects) in ways which encouraged students to stay up−to−date in their work Not relevant to objectives selected 4.3 89% 12. Gave tests, projects, etc. that covered the most important points of the course Not relevant to objectives selected 4.3 74% 17. Provided timely and frequent feedback on tests, reports, projects, etc. to help students improve Not relevant to objectives selected 4.1 74% 5−point Scale: 1 = Hardly Ever 2 = Occasionally 3 = Sometimes 4 = Frequently 5 = Almost Always
  • 5. Statistical Detail Number Responding 1 2 3 4 5 Omit Avg. s.d. The details on this page are of interest primarily to those who want to confirm scores reported on pages 1−3 or who want to determine if responses to some items were distributed in an unusual manner. Converted Averages are reported only for relevant learning objectives (Important or Essential −see page 2) and other items for which comparisons were provided. Notes: Discipline code selected on FIF: 4005 Discipline code used for comparison: 4005 1. Displayed a personal interest in students and their learning 0 0 1 5 13 0 4.6 0.6 2. Found ways to help students answer their own questions 0 1 1 9 8 0 4.3 0.8 3. Scheduled course work (class activities, tests, projects) in ways... 1 0 1 7 10 0 4.3 1.0 4. Demonstrated the importance and significance of the subject matter 0 1 2 7 9 0 4.3 0.9 5. Formed "teams" or "discussion groups" to facilitate learning 2 2 2 5 8 0 3.8 1.4 6. Made it clear how each topic fit into the course 0 1 3 6 9 0 4.2 0.9 7. Explained the reasons for criticisms of students’ academic... 0 1 3 6 9 0 4.2 0.9 8. Stimulated students to intellectual effort beyond that required by... 0 2 4 5 8 0 4.0 1.1 9. Encouraged students to use multiple resources (e.g. data banks,... 1 2 2 5 9 0 4.0 1.2 10. Explained course material clearly and concisely 0 0 3 3 13 0 4.5 0.8 11. Related course material to real life situations 0 3 1 6 9 0 4.1 1.1 12. Gave tests, projects, etc. that covered the most important points... 0 0 5 3 11 0 4.3 0.9 13. Introduced stimulating ideas about the subject 1 1 7 3 7 0 3.7 1.2 14. Involved students in "hands on" projects such as research, case... 1 0 3 4 11 0 4.3 1.1 15. Inspired students to set and achieve goals which really... 1 2 5 5 6 0 3.7 1.2 16. Asked students to share ideas and experiences with others... 5 3 4 2 5 0 2.9 1.6 17. Provided timely and frequent feedback on tests, reports,... 0 2 3 6 8 0 4.1 1.0 18. Asked students to help each other understand ideas or concepts 2 0 3 4 10 0 4.1 1.3 19. Gave projects, tests, or assignments that required original or... 4 0 3 4 8 0 3.6 1.6 20. Encouraged student−faculty interaction outside of class (office... 1 0 0 8 10 0 4.4 1.0 Key: 1 = Hardly Ever 2 = Occasionally 3 = Sometimes 4 = Frequently 5 = Almost Always Converted Avg. Comparison Group Average Raw Adj. IDEA Discipline Institution 21. Gaining factual knowledge (terminology, classifications,... 0 0 3 6 10 0 4.4 0.8 NA NA 4.0 4.2 4.3 22. Learning fundamental principles, generalizations, or theories 0 0 5 6 8 0 4.2 0.8 NA NA 3.9 4.2 4.2 23. Learning to apply course material (to improve thinking,... 0 0 1 10 8 0 4.4 0.6 57 52 4.0 4.1 4.2 24. Developing specific skills, competencies, and points of... 0 0 3 8 8 0 4.3 0.7 54 50 4.0 4.1 4.2 25. Acquiring skills in working with others as a member of... 0 1 5 3 10 0 4.2 1.0 54 50 3.9 4.0 4.2 26. Developing creative capacities (writing, inventing,... 3 3 4 4 5 0 3.3 1.4 41 38 3.9 3.3 4.2 27. Gaining a broader understanding and appreciation of... 4 0 2 3 10 0 3.8 1.6 51 47 3.7 3.5 4.1 28. Developing skill in expressing myself orally or in writing 5 0 4 3 7 0 3.4 1.6 NA NA 3.8 3.4 4.1 29. Learning how to find and use resources for answering questions... 0 0 6 5 8 0 4.1 0.9 NA NA 3.7 3.8 4.0 30. Developing a clearer understanding of, and commitment to,... 5 1 3 4 6 0 3.3 1.6 NA NA 3.8 3.4 3.9 31. Learning to analyze and critically evaluate ideas,... 2 2 4 3 8 0 3.7 1.4 47 43 3.8 3.6 4.1 32. Acquiring an interest in learning more by asking my... 0 3 4 6 6 0 3.8 1.1 50 44 3.8 3.8 3.9 Key: 1 = No apparent progress 2 = Slight progress 3 = Moderate progress 4 = Substantial progress 5 = Exceptional progress Bold = Selected as Important or Essential 33. Amount of reading 4 3 10 2 0 0 2.5 1.0 41 NA 3.2 3.2 3.1 34. Amount of work in other (non−reading) assignments 0 2 8 8 1 0 3.4 0.8 50 NA 3.4 3.8 3.4 35. Difficulty of subject matter 0 3 8 8 0 0 3.3 0.7 47 NA 3.4 4.1 3.6 Key: 1 = Much Less than Most 2 = Less than Most 3 = About Average 4 = More than Most 5 = Much More than Most 36. I had a strong desire to take this course. 1 1 2 8 7 0 4.0 1.1 NA NA 3.7 3.5 3.7 37. I worked harder on this course than on most courses I have taken. 2 3 6 5 3 0 3.2 1.2 44 NA 3.6 4.0 3.7 38. I really wanted to take a course from this instructor. 6 0 7 3 3 0 2.8 1.5 NA NA 3.4 3.5 3.5 39. I really wanted to take this course regardless of who taught it. 1 2 4 6 6 0 3.7 1.2 57 NA 3.3 3.3 3.5 40. As a result of taking this course, I have more positive feelings... 0 0 6 5 8 0 4.1 0.9 54 49 3.9 3.7 3.9 41. Overall, I rate this instructor an excellent teacher. 0 0 0 5 14 0 4.7 0.5 59 56 4.2 4.2 4.3 42. Overall, I rate this course as excellent. 0 0 3 8 8 0 4.3 0.7 56 51 3.9 3.8 4.0 43. As a rule, I put forth more effort than other students on... 0 1 5 8 5 0 3.9 0.9 58 NA 3.6 4.0 3.9 Key: 1 = Definitely False 2 = More False than True 3 = In Between 4 = More True than False 5 = Definitely True No Additional Questions. April 13, 2016 18463