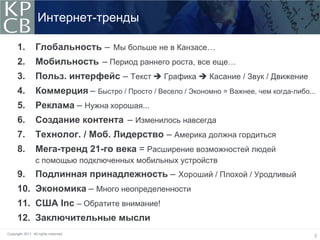
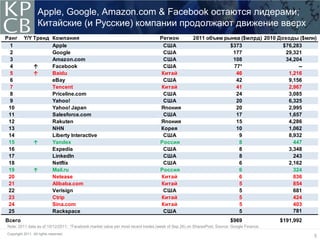
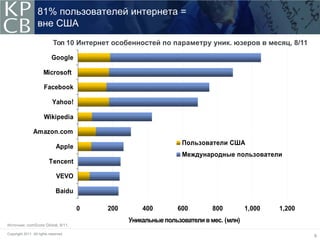
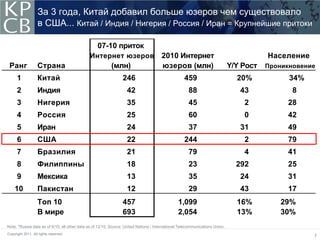
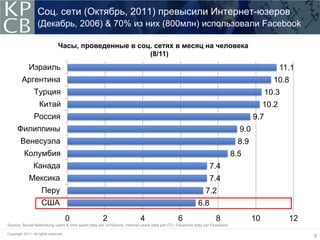
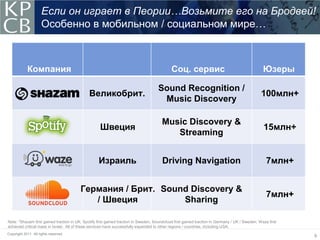
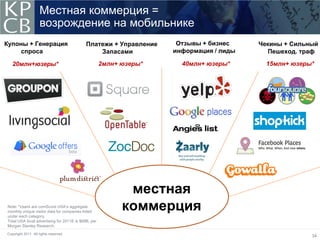
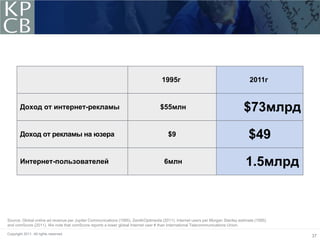
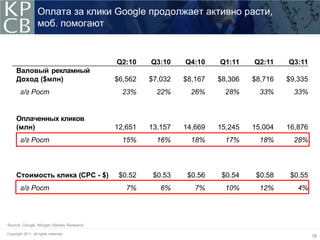
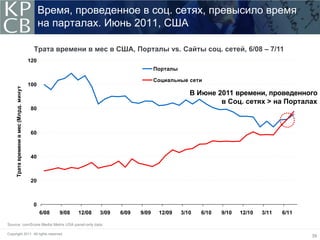
SlideShare a Scribd company logo
Интернет-тренды –
                                       Web 2.0 Summit
                                       Сан-Франциско, Калифорния
                                       Мэри Микер (marym@kpcb.com) – 18 Октября, 2011


Copyright 2011. All rights reserved.
Copyright 2011. All rights reserved.   www.kpcb.com/internettrends2011
                                                                                        1
KPCB (Digital Venture + Digital Growth) 2011 Investments


Copyright 2011. All rights reserved.
                                                                              2
Интернет-тренды

      1.          Глобальность – Мы больше не в Канзасе…
      2.          Мобильность – Период раннего роста, все еще…
      3.          Польз. интерфейс – Текст  Графика  Касание / Звук / Движение
      4.          Коммерция – Быстро / Просто / Весело / Экономно = Важнее, чем когда-либо...
      5.          Реклама – Нужна хорошая...
      6.          Создание контента – Изменилось навсегда
      7.          Технолог. / Моб. Лидерство – Америка должна гордиться
      8.          Мега-тренд 21-го века = Расширение возможностей людей
                  с помощью подключенных мобильных устройств
      9.          Подлинная принадлежность – Хороший / Плохой / Уродливый
      10. Экономика – Много неопределенности
      11. США Inc – Обратите внимание!
                .
      12. Заключительные мысли
Copyright 2011. All rights reserved.
                                                                                            3
Глобальность -
             МЫ БОЛЬШЕ НЕ
             В КАНЗАСЕ…
Copyright 2011. All rights reserved.
Apple, Google, Amazon.com & Facebook остаются лидерами;
                   Китайские (и Русские) компании продолжают движение вверх
Ранг      Y/Y Тренд Компания                                                     Регион            2011 объем рынка ($млрд) 2010 Доходы ($млн)
 1                  Apple                                                         США                           $373               $76,283
 2                  Google                                                        США                            177                29,321
 3                  Amazon.com                                                    США                            108                34,204
 4            ↑     Facebook                                                      США                            77*                     --
 5            ↑     Baidu                                                        Китай                            46                 1,216
 6                  eBay                                                          США                             42                 9,156
 7                  Tencent                                                      Китай                            41                 2,967
 8                  Priceline.com                                                 США                             24                 3,085
 9                  Yahoo!                                                        США                             20                 6,325
 10                 Yahoo! Japan                                                 Япония                           20                 2,995
 11                 Salesforce.com                                                США                             17                 1,657
 12                 Rakuten                                                      Япония                           15                 4,286
 13                 NHN                                                          Корея                            10                 1,062
 14                 Liberty Interactive                                           США                              9                 8,932
 15           ↑     Yandex                                                       Россия                            8                   447
 16                 Expedia                                                       США                              8                 3,348
 17                 LinkedIn                                                      США                              8                   243
 18                 Netflix                                                       США                              6                 2,162
 19           ↑     Mail.ru                                                      Россия                            6                   324
 20                 Netease                                                      Китай                             6                   836
 21                 Alibaba.com                                                  Китай                             5                   854
 22                 Verisign                                                      США                              5                   681
 23                 Ctrip                                                        Китай                             5                   424
 24                 Sina.com                                                     Китай                             5                   403
 25                 Rackspace                                                     США                              5                   781
Всего                                                                                                                  $969               $191,992
Note: 2011 data as of 10/12/2011; *Facebook market value per most recent trades (week of Sep 26) on SharesPost. Source: Google Finance.
Copyright 2011. All rights reserved.
                                                                                                                                                     5
81% пользователей интернета =
                   вне США
                             Топ 10 Интернет особенностей по параметру уник. юзеров в месяц, 8/11

                            Google

                       Microsoft

                       Facebook

                            Yahoo!

                       Wikipedia

                Amazon.com
                                                                  Пользователи США
                               Apple
                                                                  Международные пользователи
                          Tencent

                               VEVO

                               Baidu

                                       0   200       400        600         800         1,000   1,200
                                                 Уникальные пользователи в мес. (млн)
Источник: comScore Global, 8/11.

Copyright 2011. All rights reserved.
                                                                                                        6
За 3 года, Китай добавил больше юзеров чем существовало
                   в США... Китай / Индия / Нигерия / Россия / Иран = Крупнейшие притоки

                                                   07-10 приток
                                              Интернет юзеров                          2010 Интернет                                     Население
 Ранг              Страна                                 (млн)                        юзеров (млн)                           Y/Y Рост   Проникновение
      1            Китай                                         246                                459                         20%            34%
      2            Индия                                           42                                 88                         43             8
      3            Нигерия                                         35                                 45                          2           28
      4            Россия                                          25                                 60                          0           42
      5            Иран                                            24                                 37                         31           49
      6            США                                             22                               244                           2           79
      7            Бразилия                                        21                                 79                          4           41
      8            Филиппины                                       18                                 23                        292           25
      9            Мексика                                         13                                 35                         24           31
    10             Пакистан                                        12                                 29                         43           17
                   Топ 10                                        457                            1,099                           16%          29%
                   В мире                                        693                            2,054                           13%          30%
Note: *Russia data as of 6/10; all other data as of 12/10. Source: United Nations / International Telecommunications Union.
Copyright 2011. All rights reserved.
                                                                                                                                                     7
Соц. сети (Октябрь, 2011) превысили Интернет-юзеров
                   (Декабрь, 2006) & 70% из них (800млн) использовали Facebook

                                Часы, проведенные в соц. сетях в месяц на человека
                                                       (8/11)
             Израиль                                                                                                                           11.1
         Аргентина                                                                                                                         10.8
                 Турция                                                                                                                  10.3
                    Китай                                                                                                               10.2
                 Россия                                                                                                            9.7
      Филиппины                                                                                                              9.0
        Венесуэла                                                                                                            8.9
          Колумбия                                                                                                         8.5
                Канада                                                                                       7.4
             Мексика                                                                                         7.4
                     Перу                                                                                  7.2
                     США                                                                               6.8
                                       0           2                    4                   6                    8                 10            12
Source: Social Networking users & time spent data per comScore, Internet users data per ITU, Facebook data per Facebook.

Copyright 2011. All rights reserved.
                                                                                                                                                      8
Если он играет в Пеории…Возьмите его на Бродвей!
                     Особенно в мобильном / социальном мире…


            Компания                                                                         Соц. сервис                                         Юзеры

                                                                                     Sound Recognition /
                                              Великобрит.                                                                                       100млн+
                                                                                      Music Discovery

                                                                                       Music Discovery &
                                                    Швеция                                                                                       15млн+
                                                                                          Streaming


                                                   Израиль                             Driving Navigation                                          7млн+


                                         Германия / Брит. Sound Discovery &
                                                                                                                                                   7млн+
                                            / Швеция          Sharing

Note: *Shazam first gained traction in UK, Spotify first gained traction in Sweden, Soundcloud first gained traction in Germany / UK / Sweden, Waze first
achieved critical mass in Israel. All of these services have successfully expanded to other regions / countries, including USA.
Copyright 2011. All rights reserved.
                                                                                                                                                            9
Моб. технологии -
         Период начального роста, все еще


Copyright 2011. All rights reserved.
Прорыв Коммуникационных технологий / Сервисов
                               может продолжаться даже при общем спаде
                                  Выбор технологии (измерялось по проникновению) в США
                                      Радио vs. ТВ vs. Интернет vs. Моб. интернет, 1920-2011 гг
                        100%


                        80%
    Проникнование (%)


                                                                                     AM Радио
                        60%
                                                                                     ТВ

                                                                                     Интернет
                        40%
                                                                                     Моб. интернет (Смартфон)

                                                                                      Спады
                        20%


                         0%
                               1920 1925 1930 1935 1940 1945 1950 1955 1960 1965 1970 1975 1980 1985 1990 1995 2000 2005 2010
Source: Radio penetration data per Broadcasting & Cable Yearbook 1996, Internet penetration data per World Bank / ITU, Mobile Internet (smartphone) data per
Morgan Stanley Research; 3G data per Informa.
Copyright 2011. All rights reserved.
                                                                                                                                                               11
35% глобальный мобильный 3G рост подписчиков
                    к 936млн (17% всех моб. подписчиков), Q2:11
                                       Q2:11 3G   3G      3G Подп                                                   Q2:11 3G         3G    3G Подп
                                        Подп    Проник-     Г/Г                                                      Подп          Проник-    Г/Г
Ранг        Страна                       (млн)  новение    Рост                    Ранг      Страна                   (млн)        новение   Рост


   1        США                          179     56%        26%                      16      Канада                      15             58%      47%
   2        Япония                       117      97         10                      17      Тайвань                     14              48       28
   3        Корея                        43       82         10                      18      Португалия                  12              73       21
   4        Китай                        40        4        172                      19      Турция                      11              17      104
   5        Италия                       40       47         22                      20      Малайзия                    10              28       22
   6        Великобритания 39                     51         35                      21      Южная Африка                9               16       34
   7        Германия                     33       32         24                      22      Швеция                      9               69       35
   8        Испания                      30       53         23                      23      Мексика                     9                   9    85
   9        Бразилия                     28       13         79                      24      Филиппины                   9               10       87
  10        Индонезия                    27       12         40                      25      Сауд. Аравия                9               18       18
  11        Польша                       26       54         24                      26      Нидерланды                  8               40       41
  12        Франция                      25       39         29                      27      Австрия                     7               54       29
  13        Индия                        23        3      1,050                      28      Вьетнам                     6                   6   103
  14        Австралия                    20       71         22                      29      Израиль                     6               58       16
  15        Россия                       15        7         59                      30      Аргентина                   5               10      102

                         Глоб 3G Статистика: Подписчиков = 936млн                  Проникновение = 17%                Рост = 35%
Note: *3G includes CDMA 1x EV-DO and Rev. A/B, WCDMA, HSPA; One user may have multiple mobile subscriptions and may be counted as multiple
subscriber. Source: Informa WCIS+.
Copyright 2011. All rights reserved.
                                                                                                                                                       12
Смартфоны превзошли поставки телефонов
                                          в Европе (Q2:10) / США (Q1:11); Ост. мир последует
 Поставки смартфонов как % от общей поставки телефонов, Q1:08 - Q2:11
                                        100%


                                                       Северная Америка
                                                                                                   Смартфон > Поставки
     % квартальных поставок телефонов


                                        80%
                                                       Западная Европа                                  телефонов

                                                       Остальной мир (кроме Японии)

                                        60%

                                        50%

                                        40%


                                        20%


                                         0%
                                               Q1:08     Q3:08       Q1:09       Q3:09          Q1:10                 Q3:10   Q1:11

Source: Data per Ehud Gelblum, Morgan Stanley Research. Note: In Japan, smartphone exceeded feature phone in Q4:08.

Copyright 2011. All rights reserved.
                                                                                                                                      13
Несмотря на огромные темпы роста,
                             пользователей смартфонов все еще очень мало
                                        Смартфоны vs. Мобильных телефонов, 2011г
                             6,000
                                                                                                                   5.6 млрд
                             5,000


                             4,000
         Global Users (MM)


                             3,000


                             2,000


                             1,000         835млн

                                0
                                     Пользователи смартфонов                                            Пользователи моб. телефонов
Source: Smartphone subscriber estimates per Morgan Stanley Research; Mobile phone subscribers per Informa (as of Q2:11).
Note: While there are 936MM global 3G subscribers as of Q2:11, not all of them were smartphone users. One user may have multiple mobile subscriptions,
therefore actual user #s may be lower than subscriber #s.

Copyright 2011. All rights reserved.
                                                                                                                                                         14
iPodы изменили Медия индустрию…iPhone изменили
                                             даже быстрее… Рост iPad оставит из позади
                                                  Поставки первых 6 кварталов, iPod vs. iPhone vs. iPad

                                 15,000
                                   700
                                   45,000
                                                                iPad
                                                              iPad               iPhone
                                                                                   iPhone
                                                                                 iPhone               iPod
                                                                                                        iPod
                                                                                                       iPod
                                   40,000
                                 13,000
                                   600
       Глобальные поставки, ед.(000) (000)


                                   35,000
          Global Unit Shipments прод.


                                 11,000
                                   500
        Global Unit Shipments (000)


                                   30,000
                                        9,000
                                         400
                                         25,000

                                        7,000
                                         20,000
                                         300

                                        5,000
                                         15,000
                                         200
                                         10,000
                                        3,000
                                         100
                                          5,000
                                        1,000
                                        0 0
                                    -1,000 00 0         1
                                                        1 1            2
                                                                       22               3
                                                                                        33             44      5
                                                                                                               5
                                                                                                               5   6
                                                                                                                   6
                                                                            Кварталы послеLaunch
                                                                             Quarters After Launch
                                                                                      After запуска

Source: Apple, as of Q2:11 (6 quarters post iPad launch).

Copyright 2011. All rights reserved.
                                                                                                                       15
Телефоны на базе Андройда увеличиваются даже
                                                 быстрее iPhone
                                                           Первые 11 кварталов поставок Android & iPhone

                                                 180
                                                                     Android Global Units Shipped
                                                                         Android                         iPhone
                                                                                                    iPhone
                                                 160
         Global Cumulative Unit Shipments (MM)
          Поставки единиц продукции (млн)


                                                 140

                                                 120

                                                 100

                                                 80

                                                 60

                                                 40

                                                 20

                                                  0
                                                       0   1     2       3       4       5         6     7        8   9   10   11
                                                                                   Quarters After Launch
                                                                                Кварталы после запуска

Source: Gartner, Morgan Stanley Research, as of Q2:11.

Copyright 2011. All rights reserved.
                                                                                                                                    16
Две гонки смартфонов и планшетов, до сих пор


                                                                   Смартфоны                                                          Планшеты

                                                               Apple                Google                                Apple                   Amazon
                                                              iPhone                Android                               iPad                     Kindle


        Поставки
                                                              129млн                 152млн                               29млн                    16млнa
        в Q2:10


        Средняя цена                                            $606                  <$600                                $650                     <$200


        Дата запуска                                           Q2:07                   Q4:08                              Q2:10                     Q4:07


Note: a) Kindle shipment estimates per Scott Devitt, Morgan Stanley Research. ** ASP is average selling price, data are estimates for Android and Kindle.
Source: Apple, Morgan Stanley Research.

Copyright 2011. All rights reserved.
                                                                                                                                                            17
Использование мобильного -
                                 большое и набирает обороты
                                 % трафика с моб. устройств, Pandora, Twitter & Facebook, 2008-2011
                                 75%
         % мобильного траффика


                                                                                      60%
                                                                                                 Pandora
                                                                                      55%
                                 50%
                                                                                                 Twitter


                                                                                      33%        Facebook
                                 25%


                                        5%

                                        1%
                                   %
                                          2008          2009         2010          2011

Source: Pandora S1, Twitter, Facebook.

Copyright 2011. All rights reserved.
                                                                                                            18
Мобильный поиск -
                   Быстро растет
                                       Моб. запросов (проиндекс) Google в США 2007-2011

   120


   100                                                                4x рост
                                                                    за последние годы
     80


     60


     40


     20


        0
              2007                       2008              2009            2010           2011

Source: Google.
                                                                                                 19
Copyright 2011. All rights reserved.
                                                                                                  19
Мобильная реклама -
                                          везде быстро набирает обороты
                            InMobi – # Fortune 1000 компаний запустили мобильные рекламные кампании
                                        и ежеквартальный показ в смартфонах, 10/09-09/11

                                                       Африка                                                   250
                  в смартфонах и телефонах (B)


                                                 25                                                                    250
                                                       Северная Америка
           Ежеквартальный показ рекламы


                                                       Средний Запад                                     203
                                                 20                                                                    200
                                                       Европа


                                                                                                                             # Fortune 1000 рекламодателей
                                                       Южная Америка
                                                                                                  138
                                                 15    Азия                                                            150

                                                       # Fortune 1000 рекламодатели
                                                 10                                                                    100

                                                                                           62

                                                 5                                    37                               50
                                                                            25
                                                       3        4      8
                                                 0                                                                     0
                                                      10/09   1/10   4/10   7/10   10/10   1/11   4/11   7/11   9/11

Source: InMobi.

Copyright 2011. All rights reserved.
                                                                                                                                                             20
Моб. приложения + Доход от рекламы =
                                                   $12млрд in 2011г, до 17x в течение 3 лет

                                                         Моб. приложения + Доходы от рекламы, 2008 vs. 2011г
        Расходы на моб. прилож и рекламу ($млрд)


                                                   $15

                                                                             Мобильные приложения
                                                                                                                                         $12млрд
                                                                             Мобильная реклама
                                                   $10


                                                    $5


                                                             $0.7млрд
                                                    $0
                                                             2008           2009                         2010                            2011E
Source: Gartner. CAGR is compound annual growth rate.
Note: Apple has paid >$3B $’s to developers as of 9/11, implying gross app market revenue of $4B in 3 years; Google indicated during CQ3 earnings call that it expects
$2.5B mobile ad revenue in 2011E

Copyright 2011. All rights reserved.
                                                                                                                                                                         21
‘Иерархия потребностей’ пересмотрена?

                              1943 – Маслоу                                                                              2011 – ? ;)


                                  Само-                                                                                   Интернет /
                                 Выражение                                                                                  Моб.
                                                                                                                          Телефон

                                  Уважение
                                                                                                                              Кров
                         Принадлежность

                            Безопасность
                                                                                                                        Еда / Вода
                         Физиологические


Note: Created for discussion purposes and a bit of humor. Not intended to discredit Maslow's hierarchy, which we believe to be accurate.
Originally presented in Morgan Stanley’s “The Age of Engagement” presentation, dated April 2005

Copyright 2011. All rights reserved.
                                                                                                                                           22
Пользовательский интерфейс -
             Текст  Графика 
             Прикосновение / Звук / Движение

Copyright 2011. All rights reserved.
Что сделал один великолепный дизайнер / Артист/
                   Лидер / Бизнесмен?


     До Стива Джобса...
      компьютеры были инструментом
      для вычислений
                .

     После Стива…
      компьютеры стали прекрасными вещами,
      которые мы используем тысячами разных
      способов, чтобы сделать нашу жизнь лучше.


Copyright 2011. All rights reserved.
                                                                     24
Революция пользовательских интерфейсов -
                     сейчас эра Прикосновение / Звук / Движение
                    1980ые                1990ые                2000ые
                   Текстовые           Графический   Прикосн / Звук / Движение


Copyright 2011. All rights reserved.
                                                                                 25
Что еще крупного?

                                              Высококач. / Компактн.                           Connected
                                               беспровод Speakers                              Car Audio


                Шумоподавляющие /
                 качественные аудио                                                                        Распознование звука +
                      гарнитуры                                                                              Понимание


           4B+ Bluetooth                                                                                        Создание звука +
             устройств                                                                                           Распределение


                                                                      Онлайн
                                                                       аудио

Source: Bluetooth enabled devices shipment per iSuppli and Instat, assumes a 2.5 year replacement cycle.

Copyright 2011. All rights reserved.
                                                                                                                                   26
Возможно, пришло время услышать про ухо


      Звук будет больше чем видео...
      ‘Запись’ это новая QWERTY.

                                       -   Alexander Ljung, Основатель и ГД, SoundCloud


Copyright 2011. All rights reserved.
                                                                                          27
Коммерция -
     Быстро / Просто / Весело / Экономно =
     важно как никогда раньше…


Copyright 2011. All rights reserved.
Электронная коммерция =
                                                       четыре квартала ускоренного роста

                                                               Розничные продажи онлайн продажи в США Q1:03-Q2:11
                                                    30%
    USA Retail Sales & eCommerce Y/Y Growth Rates


                                                    20%


                                                    10%


                                                     0%
                                                           Q1:03   Q1:04   Q1:05     Q1:06    Q1:07    Q1:08   Q1:09   Q1:10   Q1:11

                                                                                   Интернет-продажи в США

                                                    -10%                           Розничные продажи в США


Note: eCommerce sales excludes travel, auto and auctions. Source: U.S. Census Bureau, comScore.

Copyright 2011. All rights reserved.
                                                                                                                                       29
eCommerce продолжает наращивать свою долю...
      % эл. коммерции от общего объема розн. продаж
                                                        at 8% Share of USA Commerce with Lots of Headroom


                                                      12%
                                                                                                                       eCommerce
                                                                                                                      проникновение
                                                      10%                                                              8% in Q2:11

                                                      8%


                                                      6%


                                                      4%


                                                      2%


                                                      0%
                                                        Q1:04    Q1:05   Q1:06     Q1:07     Q1:08   Q1:09    Q1:10     Q1:11   Q1:12
                                                            Проникн. эл. коммерц           Linear Trendline (y=0.1443x + 4.0428, R^2=0.8512)
Note: (1) : e-Commerce share is shown as a percent of DOC’s Total Retail Sales excluding Food Service &
Drinking, Food & Bev. Stores, Motor Vehicles & Parts, Gasoline Stations and Health & Personal Care Stores
Source: US Dept. of Commerce, comScore.

Copyright 2011. All rights reserved.
                                                                                                                                               30
Мобильная коммерция

                                                 Моб. продажи или Объем платежей –
                                          eBay / PayPal / Amazon.com / Target / Square, 2009-2011г
                                         $5
        Валовые моб. продажи или объем


                                         $4
               платежей ($млрд)


                                                                                                 eBay

                                                                                                 PayPal
                                         $3
                                                                                                 Target
                                         $2
                                                                                                 Amazon.com

                                         $1                                                      Square


                                         $0
                                                  2009                 2010               2011
Note: Amazon.com disclosed 2010 mobile gross sale, 2009 / 2011 data are KPCB estimates.
Source: eBay, Amazon.com, Target, Square.

Copyright 2011. All rights reserved.
                                                                                                              31
Ожила старая складская парадигма =
                   Это птица, Это самолет? Это кликни и купи с мобильника…


Copyright 2011. All rights reserved.
                                                                         32
В мобильном / прозрачном мире
                    цена значит МНОГО!

        Причины отказа от покупки среди пользователей смартфонов в США, 7/11


                                  Нашел в сети лучшую цену                                                                                   52%

                         Нашел магазин с лучшей ценой                                                                                       51%

         Увидел негативные отзывы о продукте                                                                             34%

                                                      Купил аналог                                         21%

                                          Не было в магазине                                           17%

                                              Больше не нужен                               7%

                                                                  Другое             1%
                                                                                                   % опрошенных
Source: comScore US smartphone user survey, 7/11.
Note: the same survey also indicated that 50% of USA smartphone users have used their smartphones to find a nearby store. So while mobile Internet is helping
drive foot traffic to local stores, it is also helping make pricing info more transparent for the consumers.
Copyright 2011. All rights reserved.
                                                                                                                                                                33
Местная коммерция =
                    возрождение на мобильнике
Купоны + Генерация                          Платежи + Управление     Отзывы + бизнес    Чекины + Сильный
     спроса                                     Запасами            информация / лиды     Пешеход. траф

   20млн+юзеры*                                      2млн+ юзеры*     40млн+ юзеры*       15млн+ юзеры*


                                                            местная
Note: *Users are comScore USA’s aggregate
monthly unique visitor data for companies listed
                                                           коммерция
under each category.
Total USA local advertising for 2011E is $68B, per
Morgan Stanley Research.
Copyright 2011. All rights reserved.
                                                                                                      34
Реклама -
             выглядит неплохо...


Copyright 2011. All rights reserved.
Оплата медийного времени vs. Расходы на рекламу
                                              Интернет / Моб. (вверх…) vs. Печатная реклама (вниз…)


                             % провед. в Медиа времени vs. % рекламных расходов, USA 2010

                                                                  Провед. время                 Рекламные расходы
                                               50%
          % of Total Media Consumption Time
                or Advertising Spending


                                               40%                              43% 43%


                                               30%
                                                           27%
                                                                                                      25%                          ~$20
                                               20%                                                                                 млрд.
                                                                                                                                   в США
                                                                                                                 19%
                                                                 16%
                                               10%
                                                                       11%
                                                      8%                                                               8%
                                                                                                                            0.5%
                                                0%
                                                       Печать     Радио              ТВ               Интернет         Моб.


Note: Print includes newspaper and magazine. $20B opportunity calculated assuming Internet and Mobile ad spend
share equal their respective time spent share. Source: eMarketer, 3/11.

Copyright 2011. All rights reserved.
                                                                                                                                           36
1995г                                           2011г


        Доход от интернет-рекламы                                                  $55млн                                       $73млрд
        Доход от рекламы на юзера                                                      $9                                          $49
        Интернет-пользователей                                                       6млн                                        1.5млрд


Source: Global online ad revenue per Jupiter Communications (1995), ZenithOptimedia (2011). Internet users per Morgan Stanley estimate (1995)
and comScore (2011). We note that comScore reports a lower global Internet user # than International Telecommunications Union.

Copyright 2011. All rights reserved.
                                                                                                                                                37
Оплата за клики Google продолжает активно расти,
                   моб. помогают


                                           Q2:10    Q3:10    Q4:10    Q1:11    Q2:11    Q3:11
     Валовый рекламный
     Доход ($млн)                          $6,562   $7,032   $8,167   $8,306   $8,716   $9,335
        г/г Рост                             23%      22%      26%      28%      33%      33%


     Оплаченных кликов
     (млн)                                 12,651   13,157   14,669   15,245   15,004   16,876
        г/г Рост                             15%      16%      18%      17%      18%      28%


     Стоимость клика (CPC - $)              $0.52    $0.53    $0.56    $0.54    $0.58    $0.55
        г/г Рост                              7%       6%       7%      10%      12%       4%


Source: Google, Morgan Stanley Research.

Copyright 2011. All rights reserved.
                                                                                                 38
Время, проведенное в соц. сетях, превысило время
                                               на парталах. Июнь 2011, США

                                           Трата времени в мес в США, Порталы vs. Сайты соц. сетей, 6/08 – 7/11
                                         120
                                                                                          Порталы

                                                                                          Социальные сети
                                         100
     Трата времени в мес (Млрд. минут)


                                                                                                       В Июне 2011 времени, проведенного
                                                                                                               в Соц. сетях > на Порталах
                                          80


                                          60


                                          40


                                          20


                                           0
                                               6/08   9/08   12/08   3/09   6/09   9/09    12/09    3/10   6/10   9/10   12/10   3/11   6/11

Source: comScore Media Metrix USA panel-only data.

Copyright 2011. All rights reserved.
                                                                                                                                               39
Social Networking CPMs =
                   Have Begun to Punch Closer to Their Weight

    Share of Total USA Online Display Ad Units (as of 8/11) + CPM (as of Q3:11),
                           by Top Publisher Categories

  Business / Finance                        2%                                                                             $9.90

                 Directories                2%
         Online Gaming                      3%                                                       $2.70

                        Sports               5%                                                                 $6.00

                          Email                   10%                                        $0.89

  News / Information                              11%                                                         $5.30

           Entertainment                           14%                                                   $4.25

                       Portals                           21%                                     $2.45
    Social Networking                                              30%                                  $3.80

                                       0%    10%    20%       30%       40%             $0               $5               $10      $15
                Share of Total US Online Display Ad                                                             CPM ($)
                                Units

Source: comScore, Display ad unit share as of 8/11, CPM data per Vivaki, as of Q3:11.

Copyright 2011. All rights reserved.
                                                                                                                                         40
Создание контента -
             изменилось навсегда…

Copyright 2011. All rights reserved.
• Газеты, некогда бастионы
  создания / курирования контента
  5-й год подряд испытывают                                                             $16
  снижение доходов.


                                                                   Quarterly Revenue ($B)
• С недифференцированными                                                               $12

  продуктами цены упала до
  уровня затрат. Затраты на
                                                                                            $8
  digital контент равны $0.

• Как можно создавать
                                      $4
  дифференцир. контент
  экономически выгодным образом
  когда мало кто готов за него платить?
                                      $0
  Узнайте в презентации Web 2.0         Q1:06 Q4:06 Q3:07 Q2:08 Q1:09 Q4:09 Q3:10 Q2:11
  Джоан Брэдфорт.
                                                                                                 Общий доход газет + онлайн доход

Source: Demand Media.
                                                                                                 Доход Google США
Note that Search = ~50% of USA Online Ad Revenue ($15B based on Q2 run rate) in 2011 vs. <5% in 2001;
Display = 23% of Online Ad Revenue ($7B) in 2011 vs. 62% in 2001

Copyright 2011. All rights reserved.
                                                                                                                                    42
Технологическое / Моб.
     лидерство –
     Америка должна гордиться

Copyright 2011. All rights reserved.
Мы живем в период, когда раз в 10-20 лет происходит
                   технолог. эволюция – Мобильный цикл…


      • Смартфоны + планшены вытеснили ПК
        (ноутбуки + десктопы) в Q4:10.

      • Установки операционной системы
        Windows упали на <50% в подключ.
        к Интернету устройствах в Q2:10.


Source: Morgan Stanley Research, Gartner.

Copyright 2011. All rights reserved.
                                                                         44
‘Сделано в USA’ операционные системы смартфонов =
                                    64% доля против 5% 5 лет назад

                                        Рынок операционных систем смартфонов, 2005 vs. 2011г

                                 100%


                                 80%
      Доля рынка ОС смартфонов


                                                                                    Other OS
                                 60%                                                iOS
                                                                                    Android
                                                                                    Windows Mobile
                                 40%                                                BlackBerry OS
                                                                                    Linux
                                                                                    Nokia Symbian
                                 20%


                                  0%
                                                2005                 2011г

Source: Morgan Stanley Research, Gartner.

Copyright 2011. All rights reserved.
                                                                                                     45
• Темпы инноваций в силиконовой долине
    могут быть бесприциндентными.

  • Интенсивность / фокурс / лидерство компаний
    США (Apple / Google / Amazon.com /
    Facebook) могут быть бесприциндентными.

  • Сочетание улучшений технологий
    и элегантного дизайна могут быть
    бесприциндентными.

Copyright 2011. All rights reserved.
                                              46
Мега-тренды 21-го века =
           Расширение возможностей людей
           с помощью мобильных устройств


Copyright 2011. All rights reserved.
Глобальный поток информации -
                   В реальном времени + Быстрый + Обширный
                                   16 минут ДО / ПОСЛЕ землетрясения в Японии 3/11/11
                                 Снимок @replies от и к пользователям твиттера в Японии

                        2:30pm по Японскому времени                                        2:46pm по японскому времени
                       Перед землетрясением / Цунами                                        После землетрясения / Цунами


     История развернулась в 140 символах: шок и ужас, чувство человеческой
     слабости в перемешку со спасательной информацией; сообщения тех кто
           ищет убежище и тех кто видет в этом божественное возмездие.
                                                                – LATimes, 3/11/11
Заметка: Желтые линии показывают твиты из Японии; Розовые - в Японию. Источник: Twitter.

Copyright 2011. All rights reserved.
                                                                                                                       48
• 85% населения планеты покрыто комм.
               беспроводными сигналами, обеспечивая
               больший охват vs. эл. сетей (80%)

             • 200млн+ фермеров в Индии получают
               гос. платежи / субсидии с помощью
               мобильных устройств.**


Source: *GSM Association, United Nations. **There are 90MM Kisan credit card users and 118MM job card users, both of which do not require bank
accounts but utilize mobile phones as identity verification / payment confirmation, per Ministry of Rural Development, Government of India.

Copyright 2011. All rights reserved.
                                                                                                                                                 49
World Trade as % of World GDP, 1960 - 2010
                                30%


                                25%
      World Trade as % of GDP


                                20%


                                                                                                                              2010 World Trade =
                                15%
                                                                                                                              24% of World GDP

                                10%


                                5%


                                0%
                                      1960   1965   1970    1975          1980          1985          1990          1995          2000          2005      2010
Note: World trade calculated as the sum of all countries’ imports (or exports). The biggest trading partners of USA includes EU nations, Canada, China,
Mexico, Japan and South Korea. Source: Trade data per World Trade Organization (WTO), GDP data per United Nations (UN).

Copyright 2011. All rights reserved.
                                                                                                                                                                 50
Подлинная принадлежность -
             Хороший / Плохой / Уродливый.
             Но в основном хороший?
Copyright 2011. All rights reserved.
С 800млн активными Facebook юзерами…50% которых заходят туда
           ежедневно…в среднем со 130 друзьями…и 80 страницами/ группами
           мероприятиями…и более чем 250млн фото, загружаемых в день
           и 350млн активными мобильными пользователями...

           И 835 млн смартфон-юзеров (через 2 года скорее всего 1,4 млрд)...

           Сложно спрятаться. «Правда» расходится в один клик/фото.

           «Чистое, хорошее место для бизнеса?», «Хорошие люди?»

           В мире с огромное неопределенностью - из-за быстрого уклона в
           «всегда онлайн», связывающего людей по всему миру, возможно,
           мир стоит на пороге более высокого уровня безопасности, чем когда-
           либо?

           Только время покажет нам какое это все имеет значение.


Source: Facebook, 10/11.

Copyright 2011. All rights reserved.
                                                                                52
Экономика -
           много неопределенностей


Copyright 2011. All rights reserved.
Stock Market Volatility =
                              2x Historical Average, Illustrating Uncertainty
                       100%
                                 Chicago Board Options Exchange (CBOE) Volatility Index (VIX), 1990 – 2011 YTD


                       80%
 VIX Index Value (%)


                       60%


                                                                                                    Current (10/11)
                                                                                                     Level = 40%
                       40%

                                            1990-2011
                                          Average = 20%
                       20%


                        0%
                          1990     1992     1994     1996           1998          2000     2002   2004    2006    2008   2010
Note: Data as of 10/11. VIX is a measure of implied volatility of S&P 500 index options.
Source: CBOE, Morgan Stanley Research.

Copyright 2011. All rights reserved.
                                                                                                                                54
Consumer Confidence =
                                                 Well Below Historical Average, Illustrating Uncertainty
                                                       The Conference Board Consumer Confidence Index, 1978 – 2011 YTD
                                           160


                                           140

                                                                               30 Year Average                                                 10/11
    Consumer Confidence Index (1985=100)


                                           120                                    CCI = 92.7                                                 CCI = 45.4

                                           100


                                            80


                                            60


                                            40
                                                                                                                   2/09 Trough
                                                                                                                    CCI = 25.3
                                            20


                                             0
                                              1978 1980 1982 1984 1986 1988 1990 1992 1994 1996 1998 2000 2002 2004 2006 2008 2010
Note: Index started in 1967 / benchmarked to 1985=100. The Index is calculated each month on the basis of a household survey of consumers'
opinions on current conditions and future expectations of the economy. Source: The Conference Board, 10/11.
Copyright 2011. All rights reserved.
                                                                                                                                                          55
USA Corporate Capital Spending Budgets =
                              Being Revised Down, Illustrating Uncertainty

                         Survey Results of Corporate Capital Spending Budget Revisions, 1/08 – 7/11
                          Think about your company’s overall capital budget for the current quarter, have
                          there been any adjustments made over the past 90 days?
                        50%
                                                                                    Revised Lower

                                                                                    Revised Higher               23% of Respondents
                        40%
                                                                                                                    Have Revised
                                                                                                                   Capital Budgets
     % of Respondents


                                                                                                                   Lower in CQ3:11
                        30%


                        20%


                        10%


                        0%
                               1/08    4/08   7/08   10/08   1/09   4/09   7/09   10/09   1/10   4/10   7/10   10/10   1/11   4/11   7/11

Source: ChangeWave Research.

Copyright 2011. All rights reserved.
                                                                                                                                            56
GDP Growth Forecasts =
                    Being Revised Down, Illustrating Uncertainty
                                                                                                     Difference from 6/11
                                                                                 IMF Forecasts, 9/11    IMF Forecasts
            Country / Region                     2009              2010              2011E   2012E    2011E      2012E

            USA                                  -3.5%              3.0%              1.5%    1.8%     -1.0%      -0.9%
            Euro Zone                              -4.3               1.8              1.6     1.1      -0.4       -0.6
            UK                                     -4.9               1.4              1.1     1.6      -0.4       -0.7
            Japan                                  -6.3               4.0             -0.5     2.3       0.2       -0.6
            China                                   9.2             10.3               9.5     9.0      -0.1       -0.5
            India                                   6.8             10.1               7.8     7.5      -0.4       -0.3
            Russia                                 -7.8               4.0              4.3     4.1      -0.5       -0.4
            Brazil                                 -0.6               7.5              3.8     3.6      -0.3        0.0

            Developed Markets                      -3.7               3.1              1.6     1.9      -0.6       -0.7
            Emerging Markets                        2.8               7.3              6.4     6.1      -0.2       -0.3

            World                                  -0.7               5.1              4.0     4.0      -0.3       -0.5
Note: Data is annual GDP percent change. Source: IMF World Economic Outlook, 9/11.

Copyright 2011. All rights reserved.
                                                                                                                            57
Stock Markets = Often Leading Indicators of Economic Activity
                                           Russia -33% from 52-Week High; Oil (-24%) / China (-23%) / Europe (-23%) / S&P500
                                           (-12%) / Nasdaq (-9%)

                                    180%        Stock / Commodity Markets Performance (% Change From 1/10), 1/10 – 10/11


                                    160%


                                    140%
    Index Value (1/1/2010 = 100%)


                                    120%


                                    100%


                                    80%


                                                                                                     New 2-Week Trendline?
                                    60%
                                       1/10      3/10    5/10     7/10      9/10     11/10    1/11         3/11      5/11      7/11     9/11


                                       S&P500       NASDAQ      China Shanghai Composite     MSCI Europe          Russia RTS      Oil     Gold

Note: All values are indexed to 1 (100%) on Jan 1, 2010. Data as of 10/17/11.
Source: Morgan Stanley Research, Yahoo! Finance.

Copyright 2011. All rights reserved.
                                                                                                                                                 58
USA INC. –
           PAY ATTENTION!


Copyright 2011. All rights reserved.
America’s Revenue & Expenses as % of GDP Over 110 Years;
                                               Current State = Revenue Problem? Spending Problem?
                                                          USA Inc. Revenue & Expenses as % of GDP, 1901 – 2011E
                                         50%                                                                                            $16
                                                    Revenue as % of GDP
                                                    (Left Axis)                                                                         $14
                                                                                                 Biggest Peace Time Gap


                                                                                                                                              Real GDP (in Trillions of 2005 Dollars)
                                         40%        Expenses as % of GDP                           Between Revenue &
        Revenue & Expenses as % of GDP


                                                    (Left Axis)                                  Expenses in USA History                $12
                                                    Real GDP (Right Axis)
                                                                                                                                        $10
                                         30%

                                                                                                                                        $8

                                         20%
                                                                                                                                        $6


                                                                                                                                        $4
                                         10%
                                                                                                                                        $2


                                         0%                                                                                             $0
                                           1901    1911     1921   1931     1941   1951   1961     1971   1981        1991   2001   2011E


Source: 1910 – 1930 per Census Bureau, 1940-2010 per White House OMB. Real GDP adjusted for inflation, in 2005 dollars.

Copyright 2011. All rights reserved.
                                                                                                                                                                                        60
America’s Income Statement –
                     -60% Net Margin in F2010
                                       USA Inc. Profit & Loss Statement, F1995 / F2000 / F2005 / F2010
                                                       F1995 … F2000 … F2005 … F2010        Comments
            Revenue ($B)                                   $1,352           $2,026          $2,154          $2,163          On average, revenue grew 3% Y/Y
               Y/Y Growth                                       --              11%             15%              3%         over past 15 years
                   Individual Income Taxes*                   $590          $1,005            $927            $899          Largest driver of revenue
                       % of Revenue                             44%             50%             43%             42%
                   Social Insurance Taxes                     $484            $653            $794            $865          Payroll tax on Social Security +
                      % of Revenue                              36%             32%             37%             40%         Medicare
                   Corporate Income Taxes*                    $157            $207            $278            $191          Fluctuates significantly with
                      % of Revenue                              12%             10%             13%              9%         economic conditions
                   Other                                      $120            $161            $154            $208          Includes estate & gift taxes / duties &
                      % of Revenue                               9%              8%              7%             10%         fees; relatively stable
            Expense ($B)                                   $1,516           $1,789          $2,472          $3,456          On average, expense grew 6% Y/Y
                Y/Y Growth                                      --               5%              8%             -2%         over past 15 years
                   Entitlement / Mandatory                    $788            $937          $1,295          $1,984
                                                                                                                            Significant increase owing to aging
                       % of Expense                             52%             52%             52%             57%         population + rising healthcare cost
                   Non-Defense Discretionary                  $223            $335            $497            $431
                                                                                                                            Includes education / law enforcement
                      % of Expense                              15%             19%             20%             12%
                                                                                                                            / transportation…
                      "One-Time" Items                           --              --              --           $152
                                                                                                                            Includes discretionary spending on
                        % of Expense                             --              --              --              4%
                                                                                                                            TARP, GSEs, and economic stimulus
                   Defense                                    $272            $294            $495            $694
                      % of Expense                              18%             16%             20%             20%
                                                                                                                            Significant increase owing to on-
                                                                                                                            going War on Terror
                   Net Interest on Public Debt                $232            $223            $184            $196
                                                                                                                            Decreased owing to historic low
                      % of Expense                              15%             12%              7%              6%         interest rates
            Surplus / Deficit ($B)                           -$164            $237           -$318         -$1,293          USA Inc. median net margin between
                Net Margin (%)                                 -12%             12%            -15%            -60%         1995 & 2010 = -8%

Note: USA federal fiscal year ends in September; *individual & corporate income taxes include capital gains taxes. Non-defense discretionary includes federal
spending on education, infrastructure, law enforcement, judiciary functions… Source: White House Office of Management and Budget.
Copyright 2011. All rights reserved.
                                                                                                                                                                      61
America’s Debt Level Relative to Other Countries –
                     You Do the Math…

                                          2010 Gross                                                                    2010 Gross
                                        Government Debt                                                               Government Debt
Rank      Country                             ($B)            % of GDP                Rank      Country                     ($B)        % of GDP
 1        Japan                            $12,009             220%                    16       Hungary                    $105           80%
 2        Jamaica                                19             143                    17       Israel                       168           77
 3        Greece                                436             143                    18       UK                        1,699            76
 4        Lebanon                                53             134                    19       Egypt                        161           74
 5        Iraq                                   97             120                    20       Austria                      272           72
 6        Italy                              2,445              119                    21       Sudan                         47           72
 7        Belgium                               452              97                    22       Brazil                    1,397            67
 8        Singapore                             214              96                    23       Jordan                        18           67
 9        Ireland                               196              95                    24       Côte d'Ivoire                 15           67
 10       USA                               13,707               94                    25       India                     1,046            64
 11       Portugal                              213              93                    26       Netherlands                  497           64
 12       Iceland                                12              92                    27       Cyprus                        14           61
 13       Germany                            2,759               84                    28       Spain                        848           60
 14       Canada                             1,324               84                    29       Uruguay                       23           57
 15       France                             2,110               82                    30       Pakistan                     100           57


 Note: Ranking excludes countries with gross government debt less than $10B in 2010. Gross government debt includes
 intragovernment obligations (such as Treasuries held by the Social Security Trust Fund in US’ case).
 Source: The International Monetary Fund (IMF).

 Copyright 2011. All rights reserved.
                                                                                                                                              62
USA Inc. @ kpcb.com / youtube.com / amazon.com


                    90K+ Total Views
                    14K+ YouTube Views
                    7K+ Facebook Likes
                    2K+ Retweets


Copyright 2011. All rights reserved.
                                                                       63
CLOSING THOUGHTS


Copyright 2011. All rights reserved.
Экономика – Самая темная ночь перед
      рассветом. По крайней мере, мы знаем
      какие есть проблемы. Надо решить как их
      исправить. Необходимы жертвы.

     Тех. индустрия – Вау! Беспрецедентные вре-
       мена! Если сможете удержать голову,
       когда все окружающие ее теряют...*

             *Rudyard Kipling - ‘If’


Copyright 2011. All rights reserved.
                                                  65
Disclosure


     The information offered in this presentation speaks to industry trends in general,
     and should not be construed as providing any particular recommendations or
     analysis for any specific company that is mentioned in this presentation. KPCB is
     a venture capital firm that owns significant equity positions in certain of the
     companies referenced in this presentation.


Copyright 2011. All rights reserved.
                                                                                          66

More Related Content

Viewers also liked

Integrating resiliency into decision making
Integrating resiliency into  decision makingIntegrating resiliency into  decision making
Integrating resiliency into decision making
Stantec
 
20 Jaar Na De Val Van De Berlijnse Muur
20 Jaar Na De Val Van De Berlijnse Muur20 Jaar Na De Val Van De Berlijnse Muur
20 Jaar Na De Val Van De Berlijnse Muur
GT Tervuren
 
Stantec's Creativity & Innovation Program
Stantec's Creativity & Innovation ProgramStantec's Creativity & Innovation Program
Stantec's Creativity & Innovation Program
Stantec
 
LEAP Design Portfolio
LEAP Design PortfolioLEAP Design Portfolio
LEAP Design Portfolio
Precision Group
 
2016 Frente 2 módulo 7 o sangue
2016 Frente 2 módulo 7 o sangue2016 Frente 2 módulo 7 o sangue
2016 Frente 2 módulo 7 o sangue
Colégio Batista de Mantena
 
برنامج الأيام الدراسية حول الوقف الإسلامي ببلجيكا
برنامج الأيام الدراسية حول الوقف الإسلامي ببلجيكابرنامج الأيام الدراسية حول الوقف الإسلامي ببلجيكا
برنامج الأيام الدراسية حول الوقف الإسلامي ببلجيكا
بسام البصيلي
 
Generalidades sobre músculos
Generalidades sobre músculosGeneralidades sobre músculos
Generalidades sobre músculos
Rogério Porto da Rocha
 

Viewers also liked (8)

Integrating resiliency into decision making
Integrating resiliency into  decision makingIntegrating resiliency into  decision making
Integrating resiliency into decision making
 
20 Jaar Na De Val Van De Berlijnse Muur
20 Jaar Na De Val Van De Berlijnse Muur20 Jaar Na De Val Van De Berlijnse Muur
20 Jaar Na De Val Van De Berlijnse Muur
 
Stantec's Creativity & Innovation Program
Stantec's Creativity & Innovation ProgramStantec's Creativity & Innovation Program
Stantec's Creativity & Innovation Program
 
LEAP Design Portfolio
LEAP Design PortfolioLEAP Design Portfolio
LEAP Design Portfolio
 
2016 Frente 2 módulo 7 o sangue
2016 Frente 2 módulo 7 o sangue2016 Frente 2 módulo 7 o sangue
2016 Frente 2 módulo 7 o sangue
 
برنامج الأيام الدراسية حول الوقف الإسلامي ببلجيكا
برنامج الأيام الدراسية حول الوقف الإسلامي ببلجيكابرنامج الأيام الدراسية حول الوقف الإسلامي ببلجيكا
برنامج الأيام الدراسية حول الوقف الإسلامي ببلجيكا
 
Parlamentarismo: contexto, auge, desarrollo, consecuencias
Parlamentarismo: contexto, auge, desarrollo, consecuenciasParlamentarismo: contexto, auge, desarrollo, consecuencias
Parlamentarismo: contexto, auge, desarrollo, consecuencias
 
Generalidades sobre músculos
Generalidades sobre músculosGeneralidades sobre músculos
Generalidades sobre músculos
 

More from Natalia Sakhnova

Метрики стартапа: AARRR
Метрики стартапа: AARRRМетрики стартапа: AARRR
Метрики стартапа: AARRR
Natalia Sakhnova
 
Минимально жизнеспособный продукт
Минимально жизнеспособный продуктМинимально жизнеспособный продукт
Минимально жизнеспособный продуктNatalia Sakhnova
 
Роль ментора в стартапе
Роль ментора в стартапеРоль ментора в стартапе
Роль ментора в стартапеNatalia Sakhnova
 
Как все построено в Dropbox
Как все построено в DropboxКак все построено в Dropbox
Как все построено в DropboxNatalia Sakhnova
 
Фразы, которые нельзя говорить инвесторам
Фразы, которые нельзя говорить инвесторамФразы, которые нельзя говорить инвесторам
Фразы, которые нельзя говорить инвесторам
Natalia Sakhnova
 
Создание успешного стартапа
Создание успешного стартапаСоздание успешного стартапа
Создание успешного стартапа
Natalia Sakhnova
 

More from Natalia Sakhnova (6)

Метрики стартапа: AARRR
Метрики стартапа: AARRRМетрики стартапа: AARRR
Метрики стартапа: AARRR
 
Минимально жизнеспособный продукт
Минимально жизнеспособный продуктМинимально жизнеспособный продукт
Минимально жизнеспособный продукт
 
Роль ментора в стартапе
Роль ментора в стартапеРоль ментора в стартапе
Роль ментора в стартапе
 
Как все построено в Dropbox
Как все построено в DropboxКак все построено в Dropbox
Как все построено в Dropbox
 
Фразы, которые нельзя говорить инвесторам
Фразы, которые нельзя говорить инвесторамФразы, которые нельзя говорить инвесторам
Фразы, которые нельзя говорить инвесторам
 
Создание успешного стартапа
Создание успешного стартапаСоздание успешного стартапа
Создание успешного стартапа
 

Интернет-тренды 2011

  • 1. Интернет-тренды – Web 2.0 Summit Сан-Франциско, Калифорния Мэри Микер (marym@kpcb.com) – 18 Октября, 2011 Copyright 2011. All rights reserved. Copyright 2011. All rights reserved. www.kpcb.com/internettrends2011 1
  • 2. KPCB (Digital Venture + Digital Growth) 2011 Investments Copyright 2011. All rights reserved. 2
  • 3. Интернет-тренды 1. Глобальность – Мы больше не в Канзасе… 2. Мобильность – Период раннего роста, все еще… 3. Польз. интерфейс – Текст  Графика  Касание / Звук / Движение 4. Коммерция – Быстро / Просто / Весело / Экономно = Важнее, чем когда-либо... 5. Реклама – Нужна хорошая... 6. Создание контента – Изменилось навсегда 7. Технолог. / Моб. Лидерство – Америка должна гордиться 8. Мега-тренд 21-го века = Расширение возможностей людей с помощью подключенных мобильных устройств 9. Подлинная принадлежность – Хороший / Плохой / Уродливый 10. Экономика – Много неопределенности 11. США Inc – Обратите внимание! . 12. Заключительные мысли Copyright 2011. All rights reserved. 3
  • 4. Глобальность - МЫ БОЛЬШЕ НЕ В КАНЗАСЕ… Copyright 2011. All rights reserved.
  • 5. Apple, Google, Amazon.com & Facebook остаются лидерами; Китайские (и Русские) компании продолжают движение вверх Ранг Y/Y Тренд Компания Регион 2011 объем рынка ($млрд) 2010 Доходы ($млн) 1 Apple США $373 $76,283 2 Google США 177 29,321 3 Amazon.com США 108 34,204 4 ↑ Facebook США 77* -- 5 ↑ Baidu Китай 46 1,216 6 eBay США 42 9,156 7 Tencent Китай 41 2,967 8 Priceline.com США 24 3,085 9 Yahoo! США 20 6,325 10 Yahoo! Japan Япония 20 2,995 11 Salesforce.com США 17 1,657 12 Rakuten Япония 15 4,286 13 NHN Корея 10 1,062 14 Liberty Interactive США 9 8,932 15 ↑ Yandex Россия 8 447 16 Expedia США 8 3,348 17 LinkedIn США 8 243 18 Netflix США 6 2,162 19 ↑ Mail.ru Россия 6 324 20 Netease Китай 6 836 21 Alibaba.com Китай 5 854 22 Verisign США 5 681 23 Ctrip Китай 5 424 24 Sina.com Китай 5 403 25 Rackspace США 5 781 Всего $969 $191,992 Note: 2011 data as of 10/12/2011; *Facebook market value per most recent trades (week of Sep 26) on SharesPost. Source: Google Finance. Copyright 2011. All rights reserved. 5
  • 6. 81% пользователей интернета = вне США Топ 10 Интернет особенностей по параметру уник. юзеров в месяц, 8/11 Google Microsoft Facebook Yahoo! Wikipedia Amazon.com Пользователи США Apple Международные пользователи Tencent VEVO Baidu 0 200 400 600 800 1,000 1,200 Уникальные пользователи в мес. (млн) Источник: comScore Global, 8/11. Copyright 2011. All rights reserved. 6
  • 7. За 3 года, Китай добавил больше юзеров чем существовало в США... Китай / Индия / Нигерия / Россия / Иран = Крупнейшие притоки 07-10 приток Интернет юзеров 2010 Интернет Население Ранг Страна (млн) юзеров (млн) Y/Y Рост Проникновение 1 Китай 246 459 20% 34% 2 Индия 42 88 43 8 3 Нигерия 35 45 2 28 4 Россия 25 60 0 42 5 Иран 24 37 31 49 6 США 22 244 2 79 7 Бразилия 21 79 4 41 8 Филиппины 18 23 292 25 9 Мексика 13 35 24 31 10 Пакистан 12 29 43 17 Топ 10 457 1,099 16% 29% В мире 693 2,054 13% 30% Note: *Russia data as of 6/10; all other data as of 12/10. Source: United Nations / International Telecommunications Union. Copyright 2011. All rights reserved. 7
  • 8. Соц. сети (Октябрь, 2011) превысили Интернет-юзеров (Декабрь, 2006) & 70% из них (800млн) использовали Facebook Часы, проведенные в соц. сетях в месяц на человека (8/11) Израиль 11.1 Аргентина 10.8 Турция 10.3 Китай 10.2 Россия 9.7 Филиппины 9.0 Венесуэла 8.9 Колумбия 8.5 Канада 7.4 Мексика 7.4 Перу 7.2 США 6.8 0 2 4 6 8 10 12 Source: Social Networking users & time spent data per comScore, Internet users data per ITU, Facebook data per Facebook. Copyright 2011. All rights reserved. 8
  • 9. Если он играет в Пеории…Возьмите его на Бродвей! Особенно в мобильном / социальном мире… Компания Соц. сервис Юзеры Sound Recognition / Великобрит. 100млн+ Music Discovery Music Discovery & Швеция 15млн+ Streaming Израиль Driving Navigation 7млн+ Германия / Брит. Sound Discovery & 7млн+ / Швеция Sharing Note: *Shazam first gained traction in UK, Spotify first gained traction in Sweden, Soundcloud first gained traction in Germany / UK / Sweden, Waze first achieved critical mass in Israel. All of these services have successfully expanded to other regions / countries, including USA. Copyright 2011. All rights reserved. 9
  • 10. Моб. технологии - Период начального роста, все еще Copyright 2011. All rights reserved.
  • 11. Прорыв Коммуникационных технологий / Сервисов может продолжаться даже при общем спаде Выбор технологии (измерялось по проникновению) в США Радио vs. ТВ vs. Интернет vs. Моб. интернет, 1920-2011 гг 100% 80% Проникнование (%) AM Радио 60% ТВ Интернет 40% Моб. интернет (Смартфон) Спады 20% 0% 1920 1925 1930 1935 1940 1945 1950 1955 1960 1965 1970 1975 1980 1985 1990 1995 2000 2005 2010 Source: Radio penetration data per Broadcasting & Cable Yearbook 1996, Internet penetration data per World Bank / ITU, Mobile Internet (smartphone) data per Morgan Stanley Research; 3G data per Informa. Copyright 2011. All rights reserved. 11
  • 12. 35% глобальный мобильный 3G рост подписчиков к 936млн (17% всех моб. подписчиков), Q2:11 Q2:11 3G 3G 3G Подп Q2:11 3G 3G 3G Подп Подп Проник- Г/Г Подп Проник- Г/Г Ранг Страна (млн) новение Рост Ранг Страна (млн) новение Рост 1 США 179 56% 26% 16 Канада 15 58% 47% 2 Япония 117 97 10 17 Тайвань 14 48 28 3 Корея 43 82 10 18 Португалия 12 73 21 4 Китай 40 4 172 19 Турция 11 17 104 5 Италия 40 47 22 20 Малайзия 10 28 22 6 Великобритания 39 51 35 21 Южная Африка 9 16 34 7 Германия 33 32 24 22 Швеция 9 69 35 8 Испания 30 53 23 23 Мексика 9 9 85 9 Бразилия 28 13 79 24 Филиппины 9 10 87 10 Индонезия 27 12 40 25 Сауд. Аравия 9 18 18 11 Польша 26 54 24 26 Нидерланды 8 40 41 12 Франция 25 39 29 27 Австрия 7 54 29 13 Индия 23 3 1,050 28 Вьетнам 6 6 103 14 Австралия 20 71 22 29 Израиль 6 58 16 15 Россия 15 7 59 30 Аргентина 5 10 102 Глоб 3G Статистика: Подписчиков = 936млн Проникновение = 17% Рост = 35% Note: *3G includes CDMA 1x EV-DO and Rev. A/B, WCDMA, HSPA; One user may have multiple mobile subscriptions and may be counted as multiple subscriber. Source: Informa WCIS+. Copyright 2011. All rights reserved. 12
  • 13. Смартфоны превзошли поставки телефонов в Европе (Q2:10) / США (Q1:11); Ост. мир последует Поставки смартфонов как % от общей поставки телефонов, Q1:08 - Q2:11 100% Северная Америка Смартфон > Поставки % квартальных поставок телефонов 80% Западная Европа телефонов Остальной мир (кроме Японии) 60% 50% 40% 20% 0% Q1:08 Q3:08 Q1:09 Q3:09 Q1:10 Q3:10 Q1:11 Source: Data per Ehud Gelblum, Morgan Stanley Research. Note: In Japan, smartphone exceeded feature phone in Q4:08. Copyright 2011. All rights reserved. 13
  • 14. Несмотря на огромные темпы роста, пользователей смартфонов все еще очень мало Смартфоны vs. Мобильных телефонов, 2011г 6,000 5.6 млрд 5,000 4,000 Global Users (MM) 3,000 2,000 1,000 835млн 0 Пользователи смартфонов Пользователи моб. телефонов Source: Smartphone subscriber estimates per Morgan Stanley Research; Mobile phone subscribers per Informa (as of Q2:11). Note: While there are 936MM global 3G subscribers as of Q2:11, not all of them were smartphone users. One user may have multiple mobile subscriptions, therefore actual user #s may be lower than subscriber #s. Copyright 2011. All rights reserved. 14
  • 15. iPodы изменили Медия индустрию…iPhone изменили даже быстрее… Рост iPad оставит из позади Поставки первых 6 кварталов, iPod vs. iPhone vs. iPad 15,000 700 45,000 iPad iPad iPhone iPhone iPhone iPod iPod iPod 40,000 13,000 600 Глобальные поставки, ед.(000) (000) 35,000 Global Unit Shipments прод. 11,000 500 Global Unit Shipments (000) 30,000 9,000 400 25,000 7,000 20,000 300 5,000 15,000 200 10,000 3,000 100 5,000 1,000 0 0 -1,000 00 0 1 1 1 2 22 3 33 44 5 5 5 6 6 Кварталы послеLaunch Quarters After Launch After запуска Source: Apple, as of Q2:11 (6 quarters post iPad launch). Copyright 2011. All rights reserved. 15
  • 16. Телефоны на базе Андройда увеличиваются даже быстрее iPhone Первые 11 кварталов поставок Android & iPhone 180 Android Global Units Shipped Android iPhone iPhone 160 Global Cumulative Unit Shipments (MM) Поставки единиц продукции (млн) 140 120 100 80 60 40 20 0 0 1 2 3 4 5 6 7 8 9 10 11 Quarters After Launch Кварталы после запуска Source: Gartner, Morgan Stanley Research, as of Q2:11. Copyright 2011. All rights reserved. 16
  • 17. Две гонки смартфонов и планшетов, до сих пор Смартфоны Планшеты Apple Google Apple Amazon iPhone Android iPad Kindle Поставки 129млн 152млн 29млн 16млнa в Q2:10 Средняя цена $606 <$600 $650 <$200 Дата запуска Q2:07 Q4:08 Q2:10 Q4:07 Note: a) Kindle shipment estimates per Scott Devitt, Morgan Stanley Research. ** ASP is average selling price, data are estimates for Android and Kindle. Source: Apple, Morgan Stanley Research. Copyright 2011. All rights reserved. 17
  • 18. Использование мобильного - большое и набирает обороты % трафика с моб. устройств, Pandora, Twitter & Facebook, 2008-2011 75% % мобильного траффика 60% Pandora 55% 50% Twitter 33% Facebook 25% 5% 1% % 2008 2009 2010 2011 Source: Pandora S1, Twitter, Facebook. Copyright 2011. All rights reserved. 18
  • 19. Мобильный поиск - Быстро растет Моб. запросов (проиндекс) Google в США 2007-2011 120 100 4x рост за последние годы 80 60 40 20 0 2007 2008 2009 2010 2011 Source: Google. 19 Copyright 2011. All rights reserved. 19
  • 20. Мобильная реклама - везде быстро набирает обороты InMobi – # Fortune 1000 компаний запустили мобильные рекламные кампании и ежеквартальный показ в смартфонах, 10/09-09/11 Африка 250 в смартфонах и телефонах (B) 25 250 Северная Америка Ежеквартальный показ рекламы Средний Запад 203 20 200 Европа # Fortune 1000 рекламодателей Южная Америка 138 15 Азия 150 # Fortune 1000 рекламодатели 10 100 62 5 37 50 25 3 4 8 0 0 10/09 1/10 4/10 7/10 10/10 1/11 4/11 7/11 9/11 Source: InMobi. Copyright 2011. All rights reserved. 20
  • 21. Моб. приложения + Доход от рекламы = $12млрд in 2011г, до 17x в течение 3 лет Моб. приложения + Доходы от рекламы, 2008 vs. 2011г Расходы на моб. прилож и рекламу ($млрд) $15 Мобильные приложения $12млрд Мобильная реклама $10 $5 $0.7млрд $0 2008 2009 2010 2011E Source: Gartner. CAGR is compound annual growth rate. Note: Apple has paid >$3B $’s to developers as of 9/11, implying gross app market revenue of $4B in 3 years; Google indicated during CQ3 earnings call that it expects $2.5B mobile ad revenue in 2011E Copyright 2011. All rights reserved. 21
  • 22. ‘Иерархия потребностей’ пересмотрена? 1943 – Маслоу 2011 – ? ;) Само- Интернет / Выражение Моб. Телефон Уважение Кров Принадлежность Безопасность Еда / Вода Физиологические Note: Created for discussion purposes and a bit of humor. Not intended to discredit Maslow's hierarchy, which we believe to be accurate. Originally presented in Morgan Stanley’s “The Age of Engagement” presentation, dated April 2005 Copyright 2011. All rights reserved. 22
  • 23. Пользовательский интерфейс - Текст  Графика  Прикосновение / Звук / Движение Copyright 2011. All rights reserved.
  • 24. Что сделал один великолепный дизайнер / Артист/ Лидер / Бизнесмен? До Стива Джобса... компьютеры были инструментом для вычислений . После Стива… компьютеры стали прекрасными вещами, которые мы используем тысячами разных способов, чтобы сделать нашу жизнь лучше. Copyright 2011. All rights reserved. 24
  • 25. Революция пользовательских интерфейсов - сейчас эра Прикосновение / Звук / Движение 1980ые 1990ые 2000ые Текстовые Графический Прикосн / Звук / Движение Copyright 2011. All rights reserved. 25
  • 26. Что еще крупного? Высококач. / Компактн. Connected беспровод Speakers Car Audio Шумоподавляющие / качественные аудио Распознование звука + гарнитуры Понимание 4B+ Bluetooth Создание звука + устройств Распределение Онлайн аудио Source: Bluetooth enabled devices shipment per iSuppli and Instat, assumes a 2.5 year replacement cycle. Copyright 2011. All rights reserved. 26
  • 27. Возможно, пришло время услышать про ухо Звук будет больше чем видео... ‘Запись’ это новая QWERTY. - Alexander Ljung, Основатель и ГД, SoundCloud Copyright 2011. All rights reserved. 27
  • 28. Коммерция - Быстро / Просто / Весело / Экономно = важно как никогда раньше… Copyright 2011. All rights reserved.
  • 29. Электронная коммерция = четыре квартала ускоренного роста Розничные продажи онлайн продажи в США Q1:03-Q2:11 30% USA Retail Sales & eCommerce Y/Y Growth Rates 20% 10% 0% Q1:03 Q1:04 Q1:05 Q1:06 Q1:07 Q1:08 Q1:09 Q1:10 Q1:11 Интернет-продажи в США -10% Розничные продажи в США Note: eCommerce sales excludes travel, auto and auctions. Source: U.S. Census Bureau, comScore. Copyright 2011. All rights reserved. 29
  • 30. eCommerce продолжает наращивать свою долю... % эл. коммерции от общего объема розн. продаж at 8% Share of USA Commerce with Lots of Headroom 12% eCommerce проникновение 10% 8% in Q2:11 8% 6% 4% 2% 0% Q1:04 Q1:05 Q1:06 Q1:07 Q1:08 Q1:09 Q1:10 Q1:11 Q1:12 Проникн. эл. коммерц Linear Trendline (y=0.1443x + 4.0428, R^2=0.8512) Note: (1) : e-Commerce share is shown as a percent of DOC’s Total Retail Sales excluding Food Service & Drinking, Food & Bev. Stores, Motor Vehicles & Parts, Gasoline Stations and Health & Personal Care Stores Source: US Dept. of Commerce, comScore. Copyright 2011. All rights reserved. 30
  • 31. Мобильная коммерция Моб. продажи или Объем платежей – eBay / PayPal / Amazon.com / Target / Square, 2009-2011г $5 Валовые моб. продажи или объем $4 платежей ($млрд) eBay PayPal $3 Target $2 Amazon.com $1 Square $0 2009 2010 2011 Note: Amazon.com disclosed 2010 mobile gross sale, 2009 / 2011 data are KPCB estimates. Source: eBay, Amazon.com, Target, Square. Copyright 2011. All rights reserved. 31
  • 32. Ожила старая складская парадигма = Это птица, Это самолет? Это кликни и купи с мобильника… Copyright 2011. All rights reserved. 32
  • 33. В мобильном / прозрачном мире цена значит МНОГО! Причины отказа от покупки среди пользователей смартфонов в США, 7/11 Нашел в сети лучшую цену 52% Нашел магазин с лучшей ценой 51% Увидел негативные отзывы о продукте 34% Купил аналог 21% Не было в магазине 17% Больше не нужен 7% Другое 1% % опрошенных Source: comScore US smartphone user survey, 7/11. Note: the same survey also indicated that 50% of USA smartphone users have used their smartphones to find a nearby store. So while mobile Internet is helping drive foot traffic to local stores, it is also helping make pricing info more transparent for the consumers. Copyright 2011. All rights reserved. 33
  • 34. Местная коммерция = возрождение на мобильнике Купоны + Генерация Платежи + Управление Отзывы + бизнес Чекины + Сильный спроса Запасами информация / лиды Пешеход. траф 20млн+юзеры* 2млн+ юзеры* 40млн+ юзеры* 15млн+ юзеры* местная Note: *Users are comScore USA’s aggregate monthly unique visitor data for companies listed коммерция under each category. Total USA local advertising for 2011E is $68B, per Morgan Stanley Research. Copyright 2011. All rights reserved. 34
  • 35. Реклама - выглядит неплохо... Copyright 2011. All rights reserved.
  • 36. Оплата медийного времени vs. Расходы на рекламу Интернет / Моб. (вверх…) vs. Печатная реклама (вниз…) % провед. в Медиа времени vs. % рекламных расходов, USA 2010 Провед. время Рекламные расходы 50% % of Total Media Consumption Time or Advertising Spending 40% 43% 43% 30% 27% 25% ~$20 20% млрд. в США 19% 16% 10% 11% 8% 8% 0.5% 0% Печать Радио ТВ Интернет Моб. Note: Print includes newspaper and magazine. $20B opportunity calculated assuming Internet and Mobile ad spend share equal their respective time spent share. Source: eMarketer, 3/11. Copyright 2011. All rights reserved. 36
  • 37. 1995г 2011г Доход от интернет-рекламы $55млн $73млрд Доход от рекламы на юзера $9 $49 Интернет-пользователей 6млн 1.5млрд Source: Global online ad revenue per Jupiter Communications (1995), ZenithOptimedia (2011). Internet users per Morgan Stanley estimate (1995) and comScore (2011). We note that comScore reports a lower global Internet user # than International Telecommunications Union. Copyright 2011. All rights reserved. 37
  • 38. Оплата за клики Google продолжает активно расти, моб. помогают Q2:10 Q3:10 Q4:10 Q1:11 Q2:11 Q3:11 Валовый рекламный Доход ($млн) $6,562 $7,032 $8,167 $8,306 $8,716 $9,335 г/г Рост 23% 22% 26% 28% 33% 33% Оплаченных кликов (млн) 12,651 13,157 14,669 15,245 15,004 16,876 г/г Рост 15% 16% 18% 17% 18% 28% Стоимость клика (CPC - $) $0.52 $0.53 $0.56 $0.54 $0.58 $0.55 г/г Рост 7% 6% 7% 10% 12% 4% Source: Google, Morgan Stanley Research. Copyright 2011. All rights reserved. 38
  • 39. Время, проведенное в соц. сетях, превысило время на парталах. Июнь 2011, США Трата времени в мес в США, Порталы vs. Сайты соц. сетей, 6/08 – 7/11 120 Порталы Социальные сети 100 Трата времени в мес (Млрд. минут) В Июне 2011 времени, проведенного в Соц. сетях > на Порталах 80 60 40 20 0 6/08 9/08 12/08 3/09 6/09 9/09 12/09 3/10 6/10 9/10 12/10 3/11 6/11 Source: comScore Media Metrix USA panel-only data. Copyright 2011. All rights reserved. 39
  • 40. Social Networking CPMs = Have Begun to Punch Closer to Their Weight Share of Total USA Online Display Ad Units (as of 8/11) + CPM (as of Q3:11), by Top Publisher Categories Business / Finance 2% $9.90 Directories 2% Online Gaming 3% $2.70 Sports 5% $6.00 Email 10% $0.89 News / Information 11% $5.30 Entertainment 14% $4.25 Portals 21% $2.45 Social Networking 30% $3.80 0% 10% 20% 30% 40% $0 $5 $10 $15 Share of Total US Online Display Ad CPM ($) Units Source: comScore, Display ad unit share as of 8/11, CPM data per Vivaki, as of Q3:11. Copyright 2011. All rights reserved. 40
  • 41. Создание контента - изменилось навсегда… Copyright 2011. All rights reserved.
  • 42. • Газеты, некогда бастионы создания / курирования контента 5-й год подряд испытывают $16 снижение доходов. Quarterly Revenue ($B) • С недифференцированными $12 продуктами цены упала до уровня затрат. Затраты на $8 digital контент равны $0. • Как можно создавать $4 дифференцир. контент экономически выгодным образом когда мало кто готов за него платить? $0 Узнайте в презентации Web 2.0 Q1:06 Q4:06 Q3:07 Q2:08 Q1:09 Q4:09 Q3:10 Q2:11 Джоан Брэдфорт. Общий доход газет + онлайн доход Source: Demand Media. Доход Google США Note that Search = ~50% of USA Online Ad Revenue ($15B based on Q2 run rate) in 2011 vs. <5% in 2001; Display = 23% of Online Ad Revenue ($7B) in 2011 vs. 62% in 2001 Copyright 2011. All rights reserved. 42
  • 43. Технологическое / Моб. лидерство – Америка должна гордиться Copyright 2011. All rights reserved.
  • 44. Мы живем в период, когда раз в 10-20 лет происходит технолог. эволюция – Мобильный цикл… • Смартфоны + планшены вытеснили ПК (ноутбуки + десктопы) в Q4:10. • Установки операционной системы Windows упали на <50% в подключ. к Интернету устройствах в Q2:10. Source: Morgan Stanley Research, Gartner. Copyright 2011. All rights reserved. 44
  • 45. ‘Сделано в USA’ операционные системы смартфонов = 64% доля против 5% 5 лет назад Рынок операционных систем смартфонов, 2005 vs. 2011г 100% 80% Доля рынка ОС смартфонов Other OS 60% iOS Android Windows Mobile 40% BlackBerry OS Linux Nokia Symbian 20% 0% 2005 2011г Source: Morgan Stanley Research, Gartner. Copyright 2011. All rights reserved. 45
  • 46. • Темпы инноваций в силиконовой долине могут быть бесприциндентными. • Интенсивность / фокурс / лидерство компаний США (Apple / Google / Amazon.com / Facebook) могут быть бесприциндентными. • Сочетание улучшений технологий и элегантного дизайна могут быть бесприциндентными. Copyright 2011. All rights reserved. 46
  • 47. Мега-тренды 21-го века = Расширение возможностей людей с помощью мобильных устройств Copyright 2011. All rights reserved.
  • 48. Глобальный поток информации - В реальном времени + Быстрый + Обширный 16 минут ДО / ПОСЛЕ землетрясения в Японии 3/11/11 Снимок @replies от и к пользователям твиттера в Японии 2:30pm по Японскому времени 2:46pm по японскому времени Перед землетрясением / Цунами После землетрясения / Цунами История развернулась в 140 символах: шок и ужас, чувство человеческой слабости в перемешку со спасательной информацией; сообщения тех кто ищет убежище и тех кто видет в этом божественное возмездие. – LATimes, 3/11/11 Заметка: Желтые линии показывают твиты из Японии; Розовые - в Японию. Источник: Twitter. Copyright 2011. All rights reserved. 48
  • 49. • 85% населения планеты покрыто комм. беспроводными сигналами, обеспечивая больший охват vs. эл. сетей (80%) • 200млн+ фермеров в Индии получают гос. платежи / субсидии с помощью мобильных устройств.** Source: *GSM Association, United Nations. **There are 90MM Kisan credit card users and 118MM job card users, both of which do not require bank accounts but utilize mobile phones as identity verification / payment confirmation, per Ministry of Rural Development, Government of India. Copyright 2011. All rights reserved. 49
  • 50. World Trade as % of World GDP, 1960 - 2010 30% 25% World Trade as % of GDP 20% 2010 World Trade = 15% 24% of World GDP 10% 5% 0% 1960 1965 1970 1975 1980 1985 1990 1995 2000 2005 2010 Note: World trade calculated as the sum of all countries’ imports (or exports). The biggest trading partners of USA includes EU nations, Canada, China, Mexico, Japan and South Korea. Source: Trade data per World Trade Organization (WTO), GDP data per United Nations (UN). Copyright 2011. All rights reserved. 50
  • 51. Подлинная принадлежность - Хороший / Плохой / Уродливый. Но в основном хороший? Copyright 2011. All rights reserved.
  • 52. С 800млн активными Facebook юзерами…50% которых заходят туда ежедневно…в среднем со 130 друзьями…и 80 страницами/ группами мероприятиями…и более чем 250млн фото, загружаемых в день и 350млн активными мобильными пользователями... И 835 млн смартфон-юзеров (через 2 года скорее всего 1,4 млрд)... Сложно спрятаться. «Правда» расходится в один клик/фото. «Чистое, хорошее место для бизнеса?», «Хорошие люди?» В мире с огромное неопределенностью - из-за быстрого уклона в «всегда онлайн», связывающего людей по всему миру, возможно, мир стоит на пороге более высокого уровня безопасности, чем когда- либо? Только время покажет нам какое это все имеет значение. Source: Facebook, 10/11. Copyright 2011. All rights reserved. 52
  • 53. Экономика - много неопределенностей Copyright 2011. All rights reserved.
  • 54. Stock Market Volatility = 2x Historical Average, Illustrating Uncertainty 100% Chicago Board Options Exchange (CBOE) Volatility Index (VIX), 1990 – 2011 YTD 80% VIX Index Value (%) 60% Current (10/11) Level = 40% 40% 1990-2011 Average = 20% 20% 0% 1990 1992 1994 1996 1998 2000 2002 2004 2006 2008 2010 Note: Data as of 10/11. VIX is a measure of implied volatility of S&P 500 index options. Source: CBOE, Morgan Stanley Research. Copyright 2011. All rights reserved. 54
  • 55. Consumer Confidence = Well Below Historical Average, Illustrating Uncertainty The Conference Board Consumer Confidence Index, 1978 – 2011 YTD 160 140 30 Year Average 10/11 Consumer Confidence Index (1985=100) 120 CCI = 92.7 CCI = 45.4 100 80 60 40 2/09 Trough CCI = 25.3 20 0 1978 1980 1982 1984 1986 1988 1990 1992 1994 1996 1998 2000 2002 2004 2006 2008 2010 Note: Index started in 1967 / benchmarked to 1985=100. The Index is calculated each month on the basis of a household survey of consumers' opinions on current conditions and future expectations of the economy. Source: The Conference Board, 10/11. Copyright 2011. All rights reserved. 55
  • 56. USA Corporate Capital Spending Budgets = Being Revised Down, Illustrating Uncertainty Survey Results of Corporate Capital Spending Budget Revisions, 1/08 – 7/11 Think about your company’s overall capital budget for the current quarter, have there been any adjustments made over the past 90 days? 50% Revised Lower Revised Higher 23% of Respondents 40% Have Revised Capital Budgets % of Respondents Lower in CQ3:11 30% 20% 10% 0% 1/08 4/08 7/08 10/08 1/09 4/09 7/09 10/09 1/10 4/10 7/10 10/10 1/11 4/11 7/11 Source: ChangeWave Research. Copyright 2011. All rights reserved. 56
  • 57. GDP Growth Forecasts = Being Revised Down, Illustrating Uncertainty Difference from 6/11 IMF Forecasts, 9/11 IMF Forecasts Country / Region 2009 2010 2011E 2012E 2011E 2012E USA -3.5% 3.0% 1.5% 1.8% -1.0% -0.9% Euro Zone -4.3 1.8 1.6 1.1 -0.4 -0.6 UK -4.9 1.4 1.1 1.6 -0.4 -0.7 Japan -6.3 4.0 -0.5 2.3 0.2 -0.6 China 9.2 10.3 9.5 9.0 -0.1 -0.5 India 6.8 10.1 7.8 7.5 -0.4 -0.3 Russia -7.8 4.0 4.3 4.1 -0.5 -0.4 Brazil -0.6 7.5 3.8 3.6 -0.3 0.0 Developed Markets -3.7 3.1 1.6 1.9 -0.6 -0.7 Emerging Markets 2.8 7.3 6.4 6.1 -0.2 -0.3 World -0.7 5.1 4.0 4.0 -0.3 -0.5 Note: Data is annual GDP percent change. Source: IMF World Economic Outlook, 9/11. Copyright 2011. All rights reserved. 57
  • 58. Stock Markets = Often Leading Indicators of Economic Activity Russia -33% from 52-Week High; Oil (-24%) / China (-23%) / Europe (-23%) / S&P500 (-12%) / Nasdaq (-9%) 180% Stock / Commodity Markets Performance (% Change From 1/10), 1/10 – 10/11 160% 140% Index Value (1/1/2010 = 100%) 120% 100% 80% New 2-Week Trendline? 60% 1/10 3/10 5/10 7/10 9/10 11/10 1/11 3/11 5/11 7/11 9/11 S&P500 NASDAQ China Shanghai Composite MSCI Europe Russia RTS Oil Gold Note: All values are indexed to 1 (100%) on Jan 1, 2010. Data as of 10/17/11. Source: Morgan Stanley Research, Yahoo! Finance. Copyright 2011. All rights reserved. 58
  • 59. USA INC. – PAY ATTENTION! Copyright 2011. All rights reserved.
  • 60. America’s Revenue & Expenses as % of GDP Over 110 Years; Current State = Revenue Problem? Spending Problem? USA Inc. Revenue & Expenses as % of GDP, 1901 – 2011E 50% $16 Revenue as % of GDP (Left Axis) $14 Biggest Peace Time Gap Real GDP (in Trillions of 2005 Dollars) 40% Expenses as % of GDP Between Revenue & Revenue & Expenses as % of GDP (Left Axis) Expenses in USA History $12 Real GDP (Right Axis) $10 30% $8 20% $6 $4 10% $2 0% $0 1901 1911 1921 1931 1941 1951 1961 1971 1981 1991 2001 2011E Source: 1910 – 1930 per Census Bureau, 1940-2010 per White House OMB. Real GDP adjusted for inflation, in 2005 dollars. Copyright 2011. All rights reserved. 60
  • 61. America’s Income Statement – -60% Net Margin in F2010 USA Inc. Profit & Loss Statement, F1995 / F2000 / F2005 / F2010 F1995 … F2000 … F2005 … F2010 Comments Revenue ($B) $1,352 $2,026 $2,154 $2,163 On average, revenue grew 3% Y/Y Y/Y Growth -- 11% 15% 3% over past 15 years Individual Income Taxes* $590 $1,005 $927 $899 Largest driver of revenue % of Revenue 44% 50% 43% 42% Social Insurance Taxes $484 $653 $794 $865 Payroll tax on Social Security + % of Revenue 36% 32% 37% 40% Medicare Corporate Income Taxes* $157 $207 $278 $191 Fluctuates significantly with % of Revenue 12% 10% 13% 9% economic conditions Other $120 $161 $154 $208 Includes estate & gift taxes / duties & % of Revenue 9% 8% 7% 10% fees; relatively stable Expense ($B) $1,516 $1,789 $2,472 $3,456 On average, expense grew 6% Y/Y Y/Y Growth -- 5% 8% -2% over past 15 years Entitlement / Mandatory $788 $937 $1,295 $1,984 Significant increase owing to aging % of Expense 52% 52% 52% 57% population + rising healthcare cost Non-Defense Discretionary $223 $335 $497 $431 Includes education / law enforcement % of Expense 15% 19% 20% 12% / transportation… "One-Time" Items -- -- -- $152 Includes discretionary spending on % of Expense -- -- -- 4% TARP, GSEs, and economic stimulus Defense $272 $294 $495 $694 % of Expense 18% 16% 20% 20% Significant increase owing to on- going War on Terror Net Interest on Public Debt $232 $223 $184 $196 Decreased owing to historic low % of Expense 15% 12% 7% 6% interest rates Surplus / Deficit ($B) -$164 $237 -$318 -$1,293 USA Inc. median net margin between Net Margin (%) -12% 12% -15% -60% 1995 & 2010 = -8% Note: USA federal fiscal year ends in September; *individual & corporate income taxes include capital gains taxes. Non-defense discretionary includes federal spending on education, infrastructure, law enforcement, judiciary functions… Source: White House Office of Management and Budget. Copyright 2011. All rights reserved. 61
  • 62. America’s Debt Level Relative to Other Countries – You Do the Math… 2010 Gross 2010 Gross Government Debt Government Debt Rank Country ($B) % of GDP Rank Country ($B) % of GDP 1 Japan $12,009 220% 16 Hungary $105 80% 2 Jamaica 19 143 17 Israel 168 77 3 Greece 436 143 18 UK 1,699 76 4 Lebanon 53 134 19 Egypt 161 74 5 Iraq 97 120 20 Austria 272 72 6 Italy 2,445 119 21 Sudan 47 72 7 Belgium 452 97 22 Brazil 1,397 67 8 Singapore 214 96 23 Jordan 18 67 9 Ireland 196 95 24 Côte d'Ivoire 15 67 10 USA 13,707 94 25 India 1,046 64 11 Portugal 213 93 26 Netherlands 497 64 12 Iceland 12 92 27 Cyprus 14 61 13 Germany 2,759 84 28 Spain 848 60 14 Canada 1,324 84 29 Uruguay 23 57 15 France 2,110 82 30 Pakistan 100 57 Note: Ranking excludes countries with gross government debt less than $10B in 2010. Gross government debt includes intragovernment obligations (such as Treasuries held by the Social Security Trust Fund in US’ case). Source: The International Monetary Fund (IMF). Copyright 2011. All rights reserved. 62
  • 63. USA Inc. @ kpcb.com / youtube.com / amazon.com 90K+ Total Views 14K+ YouTube Views 7K+ Facebook Likes 2K+ Retweets Copyright 2011. All rights reserved. 63
  • 64. CLOSING THOUGHTS Copyright 2011. All rights reserved.
  • 65. Экономика – Самая темная ночь перед рассветом. По крайней мере, мы знаем какие есть проблемы. Надо решить как их исправить. Необходимы жертвы. Тех. индустрия – Вау! Беспрецедентные вре- мена! Если сможете удержать голову, когда все окружающие ее теряют...* *Rudyard Kipling - ‘If’ Copyright 2011. All rights reserved. 65
  • 66. Disclosure The information offered in this presentation speaks to industry trends in general, and should not be construed as providing any particular recommendations or analysis for any specific company that is mentioned in this presentation. KPCB is a venture capital firm that owns significant equity positions in certain of the companies referenced in this presentation. Copyright 2011. All rights reserved. 66