
More Related Content
What's hot
What's hot (13)
Viewers also liked
Viewers also liked (18)
Similar to 200310KA
Similar to 200310KA (20)
More from finance29
More from finance29 (20)
Recently uploaded
Recently uploaded (20)
200310KA
- 1. UNITED STATES SECURITIES AND EXCHANGE COMMISSION Washington, D.C. 20549 Form 10-K/A Amendment No. 1 (Mark One) ¥ ANNUAL REPORT PURSUANT TO SECTION 13 OR 15(d) OF THE SECURITIES EXCHANGE ACT OF 1934 For the Ñscal year ended December 31, 2003 or n TRANSITION REPORT PURSUANT TO SECTION 13 OR 15(d) OF THE SECURITIES EXCHANGE ACT OF 1934 For the transition period from to Commission Ñle number: 1-12079 Calpine Corporation (A Delaware Corporation) I.R.S. Employer IdentiÑcation No. 77-0212977 50 West San Fernando Street San Jose, California 95113 Telephone: (408) 995-5115 Securities registered pursuant to Section 12(b) of the Act: Calpine Corporation Common Stock, $.001 Par Value Registered on the New York Stock Exchange Securities registered pursuant to Section 12(g) of the Act: None Indicate by check mark whether the registrant (1) has Ñled all reports required to be Ñled by Section 13 or 15(d) of the Securities Exchange Act of 1934 during the preceding 12 months (or for such shorter period that the registrant was required to Ñle such reports), and (2) has been subject to such Ñling requirements for the past 90 days. Yes ¥ No n Indicate by check mark if disclosure of delinquent Ñlers pursuant to Item 405 of Regulation S-K is not contained herein, and will not be contained, to the best of registrant's knowledge, in deÑnitive proxy or information statements incorporated by reference in Part III of this Form 10-K or any amendment to this Form 10-K. n Indicate by check mark whether the registrant is an accelerated Ñler (as deÑned in Rule 12b-2 of the Securities Exchange Act). Yes ¥ No n Aggregate market value of the common equity held by non-aÇliates of the registrant as of June 30, 2003, the last business day of the registrant's most recently completed second Ñscal quarter: approximately $2.5 billion. Common stock outstanding as of March 19, 2004: 415,736,644 shares. DOCUMENTS INCORPORATED BY REFERENCE Portions of the documents listed below have been incorporated by reference into the indicated parts of this report, as speciÑed in the responses to the item numbers involved. (1) Designated portions of the Proxy Statement relating to the 2004 Annual Meeting of Shareholders ÏÏÏÏÏÏÏÏÏÏÏÏÏÏÏÏÏÏ Part III (Items 10, 11, 12, 13 and 14)
- 2. FORM 10-K ANNUAL REPORT For the Year Ended December 31, 2003 TABLE OF CONTENTS Page PART I Item 1. Business ÏÏÏÏÏÏÏÏÏÏÏÏÏÏÏÏÏÏÏÏÏÏÏÏÏÏÏÏÏÏÏÏÏÏÏÏÏÏÏÏÏÏÏÏÏÏÏÏÏÏÏÏÏÏÏÏÏÏÏÏÏÏÏÏÏÏÏÏ 1 Item 2. Properties ÏÏÏÏÏÏÏÏÏÏÏÏÏÏÏÏÏÏÏÏÏÏÏÏÏÏÏÏÏÏÏÏÏÏÏÏÏÏÏÏÏÏÏÏÏÏÏÏÏÏÏÏÏÏÏÏÏÏÏÏÏÏÏÏÏÏÏ 42 Item 3. Legal Proceedings ÏÏÏÏÏÏÏÏÏÏÏÏÏÏÏÏÏÏÏÏÏÏÏÏÏÏÏÏÏÏÏÏÏÏÏÏÏÏÏÏÏÏÏÏÏÏÏÏÏÏÏÏÏÏÏÏÏÏÏÏ 46 Item 4. Submission of Matters to a Vote of Security HoldersÏÏÏÏÏÏÏÏÏÏÏÏÏÏÏÏÏÏÏÏÏÏÏÏÏÏÏÏÏÏÏ 52 PART II Item 5. Market for Registrant's Common Equity and Related Stockholder Matters ÏÏÏÏÏÏÏÏÏÏÏÏ 52 Item 6. Selected Financial Data ÏÏÏÏÏÏÏÏÏÏÏÏÏÏÏÏÏÏÏÏÏÏÏÏÏÏÏÏÏÏÏÏÏÏÏÏÏÏÏÏÏÏÏÏÏÏÏÏÏÏÏÏÏÏÏ 54 Item 7. Management's Discussion and Analysis of Financial Condition and Results of Operations 58 Item 7A. Quantitative and Qualitative Disclosures About Market Risk ÏÏÏÏÏÏÏÏÏÏÏÏÏÏÏÏÏÏÏÏÏÏÏÏ 107 Item 8. Financial Statements and Supplementary Data ÏÏÏÏÏÏÏÏÏÏÏÏÏÏÏÏÏÏÏÏÏÏÏÏÏÏÏÏÏÏÏÏÏÏÏÏ 107 Item 9. Changes in and Disagreements With Accountants on Accounting and Financial Disclosure ÏÏÏÏÏÏÏÏÏÏÏÏÏÏÏÏÏÏÏÏÏÏÏÏÏÏÏÏÏÏÏÏÏÏÏÏÏÏÏÏÏÏÏÏÏÏÏÏÏÏÏÏÏÏÏÏÏÏÏÏÏÏÏÏÏÏÏ 108 Item 9A. Controls and Procedures ÏÏÏÏÏÏÏÏÏÏÏÏÏÏÏÏÏÏÏÏÏÏÏÏÏÏÏÏÏÏÏÏÏÏÏÏÏÏÏÏÏÏÏÏÏÏÏÏÏÏÏÏÏÏÏ 108 PART III Item 10. Directors and Executive OÇcers of the Registrant ÏÏÏÏÏÏÏÏÏÏÏÏÏÏÏÏÏÏÏÏÏÏÏÏÏÏÏÏÏÏÏÏÏ 109 Item 11. Executive CompensationÏÏÏÏÏÏÏÏÏÏÏÏÏÏÏÏÏÏÏÏÏÏÏÏÏÏÏÏÏÏÏÏÏÏÏÏÏÏÏÏÏÏÏÏÏÏÏÏÏÏÏÏÏÏÏ 109 Item 12. Security Ownership of Certain BeneÑcial Owners and Management ÏÏÏÏÏÏÏÏÏÏÏÏÏÏÏÏÏÏ 109 Item 13. Certain Relationships and Related Transactions ÏÏÏÏÏÏÏÏÏÏÏÏÏÏÏÏÏÏÏÏÏÏÏÏÏÏÏÏÏÏÏÏÏÏÏ 110 Item 14. Principal Accounting Fees and Services ÏÏÏÏÏÏÏÏÏÏÏÏÏÏÏÏÏÏÏÏÏÏÏÏÏÏÏÏÏÏÏÏÏÏÏÏÏÏÏÏÏÏ 110 PART IV Item 15. Exhibits, Financial Statement Schedules, and Reports on Form 8-K ÏÏÏÏÏÏÏÏÏÏÏÏÏÏÏÏÏÏ 111 Signatures and Power of AttorneyÏÏÏÏÏÏÏÏÏÏÏÏÏÏÏÏÏÏÏÏÏÏÏÏÏÏÏÏÏÏÏÏÏÏÏÏÏÏÏÏÏÏÏÏÏÏÏÏÏÏÏÏÏÏÏÏÏ 124 Index to Consolidated Financial Statements and Other Information ÏÏÏÏÏÏÏÏÏÏÏÏÏÏÏÏÏÏÏÏÏÏÏÏÏÏÏÏ F-1 1
- 3. EXPLANATORY NOTE This Amendment No. 1 to the Annual Report on Form 10-K for Calpine Corporation (quot;quot;Calpine'') for the Ñscal year ended December 31, 2003, as Ñled with the Securities and Exchange Commission (quot;quot;SEC'') on March 25, 2004, is being Ñled in connection with the SEC's review of Calpine's registration statement on Form S-3, relating to the resale of 4.75% contingent convertible senior notes sold by Calpine on November 17, 2003 and January 9, 2004, and 1934 Exchange Act Ñlings incorporated by reference thereto. As a result of this review there were no changes to the Consolidated Financial Statements. This Amendment No. 1 does provide, however, revised or expanded disclosure in Part I: Item 1 quot;quot;Business'' and Item 2 quot;quot;Properties''; Part II: Item 6 quot;quot;Selected Financial Data,'' Item 7 quot;quot;Management's Discussion and Analysis of Financial Condition and Results of Operations,'' Item 9A quot;quot;Controls and Procedures''; and Part IV: Item 15 quot;quot;Exhibits, Financial Statement Schedules and Reports on Form 8-K.'' Unrelated to the aforementioned review, we have made certain reclassiÑcations to the Consolidated Balance Sheets as described in Note 2 of the Notes to the Consolidated Financial Statements under ReclassiÑcations. PART I Item 1. Business In addition to historical information, this report contains forward-looking statements. Such statements include those concerning Calpine Corporation's (quot;quot;the Company's'') expected Ñnancial performance and its strategic and operational plans, as well as all assumptions, expectations, predictions, intentions or beliefs about future events. You are cautioned that any such forward-looking statements are not guarantees of future performance and involve a number of risks and uncertainties that could cause actual results to diÅer materially from the forward-looking statements such as, but not limited to, (i) the timing and extent of deregulation of energy markets and the rules and regulations adopted on a transitional basis with respect thereto, (ii) the timing and extent of changes in commodity prices for energy, particularly natural gas and electricity, and the impact of related derivatives transactions, (iii) unscheduled outages of operating plants, (iv) unseasonable weather patterns that produce reduced demand for power, (v) systemic economic slowdowns, which can adversely aÅect consumption of power by businesses and consumers, (vi) commercial operations of new plants that may be delayed or prevented because of various development and construction risks, such as a failure to obtain the necessary permits to operate, failure of third-party contractors to perform their contractual obligations or failure to obtain project Ñnancing on acceptable terms, (vii) cost estimates are preliminary and actual costs may be higher than estimated, (viii) a competitor's development of lower-cost power plants or of a lower cost means of operating a Öeet of power plants, (ix) risks associated with marketing and selling power from power plants in the evolving energy market, (x) the successful exploitation of an oil or gas resource that ultimately depends upon the geology of the resource, the total amount and costs to develop recoverable reserves, and legal title, regulatory, gas administration, marketing and operational factors relating to the extraction of natural gas, (xi) our estimates of oil and gas reserves may not be accurate, (xii) the eÅects on the Company's business resulting from reduced liquidity in the trading and power generation industry, (xiii) the Company's ability to access the capital markets on attractive terms or at all, (xiv) sources and uses of cash are estimates based on current expectations; actual sources may be lower and actual uses may be higher than estimated, (xv) the direct or indirect eÅects on the Company's business of a lowering of its credit rating (or actions it may take in response to changing credit rating criteria) including increased collateral requirements, refusal by the Company's current or potential counterparties to enter into transactions with it and its inability to obtain credit or capital in desired amounts or on favorable terms, (xvi) possible future claims, litigation and enforcement actions pertaining to the foregoing, (xvii) eÅects of the application of regulations, including changes in regulations or the interpretation thereof; or (xviii) other risks as identiÑed herein. Current information set forth in this Ñling has been updated to March 24, 2004, and Calpine undertakes no duty to further update this information. All other information in this Ñling is presented as of the speciÑc date noted and has not been updated since that time. 2
- 4. We Ñle annual, quarterly and periodic reports, proxy statements and other information with the SEC. You may obtain and copy any document we Ñle with the SEC at the SEC's public reference room at 450 Fifth Street, N.W., Washington, D.C. 20549. You may obtain information on the operation of the SEC's public We Ñle annual, quarterly and periodic reports, proxy statements and other information with the SEC. You may obtain and copy any document we Ñle with the SEC at the SEC's public reference room at 450 Fifth Street, N.W., Washington, D.C. 20549. You may obtain information on the operation of the SEC's public reference facilities by calling the SEC at 1-800-SEC-0330. You can request copies of these documents, upon payment of a duplicating fee, by writing to the SEC at its principal oÇce at 450 Fifth Street, N.W., Washington, D.C. 20549-1004. The SEC maintains an Internet website at http://www.sec.gov that contains reports, proxy and information statements, and other information regarding issuers that Ñle electronically with the SEC. Our SEC Ñlings are accessible through the Internet at that website. Our reports on Forms 10-K, 10-Q and 8-K, and amendments to those reports, are available for download, free of charge, as soon as reasonably practicable after these reports are Ñled with the SEC, at our website at www.calpine.com. The content of our website is not a part of this report. You may request a copy of our SEC Ñlings, at no cost to you, by writing or telephoning us at: Calpine Corporation, 50 West San Fernando Street, San Jose, California 95113, attention: Lisa M. Bodensteiner, Assistant Secretary, telephone: (408) 995-5115. We will not send exhibits to the documents, unless the exhibits are speciÑcally requested and you pay our fee for duplication and delivery. OVERVIEW We are a San Jose, California based power company engaged in the development, construction, ownership and operation of power generation facilities and the sale of electricity predominantly in the United States, but also in Canada and the United Kingdom. We were established as a corporation in 1984. We focus on two eÇcient and clean types of power generation technologies, natural gas-Ñred combustion turbine and geothermal. We currently lease and operate a signiÑcant Öeet of geothermal power plants at The Geysers, and have increased our operating portfolio of clean burning natural gas power plants by 17,201 megawatts (quot;quot;MW'') over the past three years. We have a proven track record in the development of new power facilities and may make acquisitions as opportunities arise. We also have in place an experienced gas production and management team to give us a broad range of fuel sourcing options, and we own over 800 billion cubic feet equivalent (quot;quot;Bcfe'') of net proved natural gas reserves located in Alberta, Canada as well as in the Sacramento Basin, Rockies and Gulf Coast regions of the United States. Additionally, we own a 25% interest in Calpine Natural Gas Trust, which has proved reserves of approximately 72 Bcfe (18 Bcfe net to Calpine's equity interest). We are currently capable of producing, net to Calpine's interest, 215 million cubic feet equivalent (quot;quot;MMcfe'') of natural gas per day, and Calpine Natural Gas Trust (quot;quot;CNG Trust'') total production, net of royalties, is currently 25 MMcfe (6.2 MMcfe net to Calpine's interest) of natural gas per day. Calpine has the Ñrst right to purchase all of CNG Trust's production at market prices. Currently, we own interests in 87 power plants having a net capacity of 22,206 MW. We also have 12 gas- Ñred projects and 1 project expansion currently under construction collectively having a net capacity of 7,685 MW. The completion of the new projects currently under construction would give us interests in 99 power plants located in 22 states, 3 Canadian provinces and the United Kingdom, and we will own net capacity of 29,891 MW. Of this total generating capacity, 97% will be attributable to gas-Ñred facilities and 3% will be attributable to geothermal facilities. Calpine Energy Services, L.P. (quot;quot;CES'') provides the trading and risk management services needed to schedule power sales and to ensure fuel is delivered to the power plants on time to meet delivery requirements and to manage and optimize the value of our physical power generation and gas production assets. Complementing CES's activities, we have recently reorganized our marketing and sales organization to better meet the needs of our growing list of wholesale and large retail customers. We focus our sales activities on load serving entities such as local utilities, municipalities and cooperatives, as well as on large-scale end users such as industrial and commercial companies. See a further discussion of our marketing and sales 3
- 5. organization in quot;quot;Strategy'' below. As a general goal, we seek to have 65% of our available capacity sold under long-term contracts or hedged by our risk management group. Currently we have 52% of our available capacity sold or hedged for 2004. We continue to strengthen our system operations management and information technology capabilities to enhance the economic performance of our portfolio of assets in our major markets and to provide load- following and other ancillary services to our customers. These operational optimization systems, combined with our sales, marketing and risk management capabilities, enable us to add value to traditional commodity products in ways that not all competitors can match. Our construction organization has assembled an experienced team of construction management profes- sionals to ensure that our projects are built using our standard design speciÑcations reÖecting our exacting operational standards. We have established relationships with leading equipment manufacturers for gas turbine generators, steam turbine generators and heat recovery steam generators and other key equipment. We will continue to leverage these capabilities and relationships to ensure that our power plants are completed on time and are the best built and lowest cost energy facilities possible. With a vision of enhancing the performance of our modern portfolio of gas-Ñred power plants and lowering our replacement parts maintenance costs, we have fostered the development of our wholly owned subsidiary, Power Systems Manufacturing (quot;quot;PSM''), to design and manufacture high performance combus- tion system and turbine blade parts. PSM manufactures new vanes, blades, combustors and other replacement parts for the industrial gas turbine industry. It oÅers a wide range of Low Emissions Combustion systems and advanced airfoils designed to be transparently compatible for retroÑtting or replacing existing combustion systems or components operating in General Electric and Siemens Westinghouse turbines. In 2003 we expanded our energy services capabilities with the acquisition of Netherlands-based Thomassen Turbine Systems (quot;quot;TTS''). TTS complements Calpine's broad array of energy services by selling combustion turbine component parts and repair services worldwide. We established Calpine Power Services (quot;quot;CPS'') to oÅer the unique skills that we have honed in building and operating our own power plants to third party customers. We are now selling, and have received contracts for, various engineering, procurement, construction management, plant commissioning, operations, and maintenance services through CPS. As we build the nation's most modern and eÇcient portfolio of gas-Ñred generation assets and establish our low-cost position, our integrated operations and skill sets have allowed us to weather a multi-year downturn in the North American energy industry. We have demonstrated the Öexibility to adapt to fundamental market changes. SpeciÑcally, we responded to the market downturn by reducing capital expenditures, selling or monetizing various gas, power, and contractual assets, restructuring our equipment procurement obligations, and reorganizing to reÖect our transition from a development focused company to an operations focused company. These eÅorts have allowed us to cut costs and raise capital while positioning ourselves to continue our quest to be the power company in North America with the largest market capitalization. See Note 25 of the Notes to Consolidated Financial Statements for Operating Segments Disclosures. THE MARKET The electric power industry represents one of the largest industries in the United States and impacts nearly every aspect of our economy, with an estimated end-user market of nearly $260 billion of electricity sales in 2003 based on information published by the Energy Information Administration of the Department of Energy (quot;quot;EIA''). Historically, the power generation industry has been largely characterized by electric utility monopolies producing electricity from old, ineÇcient, polluting, high-cost generating facilities selling to a captive customer base. However, industry trends and regulatory initiatives have transformed some markets into more competitive grounds where load-serving entities and end-users may purchase electricity from a variety of suppliers, including independent power producers, power marketers, regulated public utilities and others. For the past decade, the power industry has been deregulated at the wholesale level allowing generators 4
- 6. to sell directly to the load serving entities, such as public utilities, municipalities and electric cooperatives. Although industry trends and regulatory initiatives aimed at further deregulation have slowed, the power industry continues to transform into a more competitive market. The North American Electric Reliability Council (quot;quot;NERC'') estimates that in the United States, peak (summer) electric demand in 2003 totaled approximately 720,000 MW, while summer generating capacity in 2003 totaled approximately 912,000 MW, creating a peak summer reserve margin of 192,000 MW, or 26.7%. Historically, utility reserve margins have been targeted to be 15% above peak demand to provide for load forecasting errors, scheduled and unscheduled plant outages and local area grid protection. Some regions have margins well in excess of the 15% target range, while other regions remain short of ideal reserve margins. The estimated 192,000 MW of reserve margin in 2003 compares to an estimated 120,000 MW in 2002. The increase is due in large part to the start-up of new low-cost, clean-burning, gas-Ñred power plants. The United States market consists of regional electric markets not all of which are eÅectively interconnected, so reserve margins vary from region to region. Even though most new power plants are fueled by natural gas, the majority of power generated in the U.S. is still produced by coal and nuclear power plants. The EIA has estimated that approximately 51% of the electricity generated in the U.S. is fueled by coal, 20% by nuclear sources, 17% by natural gas, 7% by hydro, and 5% from fuel oil and other sources. As regulations continue to evolve, many of the current coal plants will likely be faced with installing a signiÑcant amount of costly emission control devices. This activity could cause some of the oldest and dirtiest coal plants to be retired, thereby allowing a greater proportion of power to be produced by cleaner natural gas-Ñred generation. Due primarily to the completion of gas-Ñred combustion turbine projects, we have seen power supplies increase and higher reserve margins in the last two years accompanied by a decrease in liquidity in the energy trading markets, and a general lessening of enthusiasm for investing in energy companies. In 2003 while electricity prices generally increased, the cost of natural gas grew at an even greater rate, further depressing spark spreads (the margin between the value of the electricity sold and the cost of fuel to generate that electricity) from the low levels in 2002. Based on strength in residential and commercial demand, overall consumption of electricity was estimated to have grown by approximately 2.9% in 2004 through February compared to the same period in 2003, according to Edison Electric Institute (quot;quot;EEI'') published data. The growth rate for calendar year 2003 was 1.8%. The growth rate in supply is diminishing with many developers canceling, or delaying completion of their projects as a result of current market conditions. The supply and demand balance in the natural gas industry continues to be strained with gas prices rising to over $6.40 per million btu (quot;quot;MMbtu'') in the Ñrst quarter of 2004, compared to an average of approximately $5.50 per MMbtu in 2003 and $3 per MMbtu in 2002. In addition, capital market participants are slowly making progress in restructuring their portfolios, thereby stabilizing Ñnancial pressures on the industry. Overall, we expect the market to continue these trends and work through the current oversupply of power in several regions within the next few years. As the supply- demand picture improves, we expect to see spark spreads improve and capital markets regain their interest in helping to repower America with clean, highly eÇcient energy technologies. STRATEGY Our vision is to become North America's largest power company and ultimately become a major worldwide power company. In achieving our corporate strategic objectives, the number one priority for our company is maintaining the highest level of integrity in all of our endeavors. We have posted on our website (www.calpine.com Ghttp://www.calpine.comH) our Code of Conduct applicable to all employees, including our principal executive oÇcer, principal Ñnancial oÇcer and principal accounting oÇcer. We intend to satisfy the disclosure requirement under Item 10 of Form 8-K regarding any amendments to or waivers from the Code of Conduct by posting such information on our website at www.calpine.com. Our timeline to achieve our strategic objectives is Öexible and will be guided by our view of market fundamentals. When necessary, we will slow or delay our growth activities in order to ensure that our Ñnancial health is secure and our investment opportunities meet our long-term rate of return requirements. 5
- 7. Near-Term Objectives Our ability to adapt as needed to market dynamics has led us to develop a set of near-term strategic objectives that will guide our activities until market fundamentals improve. These include: ‚ Continue to focus on our liquidity position as our second highest priority after integrity; ‚ Complete our 2004 reÑnancing program, which includes Calpine Generating Company, LLC (quot;quot;CalGen'') (see quot;quot;Recent Developments'' for more information), the remaining outstanding 4% Convertible Senior Notes Due 2006, and the Remarketable Term Income Deferrable Equity Securities (quot;quot;HIGH TIDES''); ‚ Complete our current construction program and start construction of new projects in strategic locations only when Ñnancing is available and attractive returns are expected; ‚ Continue to lower operating and overhead costs per megawatt hour produced and improve operating performance with an increasingly eÇcient power plant Öeet; and ‚ Utilize our marketing and sales capabilities to selectively increase our power contract portfolio. Longer-Term Objectives We plan on realizing our strategy by (1) achieving the lowest-cost position in the industry by applying our fully integrated areas of expertise to the cost-eÅective development, construction, Ñnancing, fueling, and operation of the most modern and eÇcient power generation facilities and by achieving economies of scale in general, administrative and other support costs, and (2) enhancing the value of the power we generate in the marketplace (a) by operating our plants as a system, (b) by selling directly to load-serving entities and, to the extent allowable, to industrial customers, in each of the markets in which we participate, (c) by oÅering load- following and other ancillary services to our customers, and (d) by providing eÅective marketing, risk management and asset optimization activities through our CES and marketing and sales organizations. Our quot;quot;system approach'' refers to our ability to cluster our standardized, highly eÇcient power generation assets within a given energy market and to sell the energy from that system of power plants, rather than using quot;quot;unit speciÑc'' marketing contracts. The clustering of standardized power generation assets allows for signiÑcant economies of scale to be achieved. SpeciÑcally, construction costs, supply chain activities such as inventory and warehousing costs, labor, and fuel procurement costs can all be reduced with this approach. The choice to focus on highly eÇcient and clean technologies reduces our fuel costs, a major expense when operating power plants. Furthermore, our lower-than-market heat rate (high eÇciency advantage) provides us a competitive advantage in times of rising fuel prices, and our systems approach to fuel purchases reduces imbalance charges when a plant is forced out of service. Finally, utilizing our system approach in a sales contract allows us to provide power to a customer from whichever plant in the system is most economical at a given period of time. In addition, the operation of plants can be coordinated when increasing or decreasing power output throughout the day to enhance overall system eÇciency, thereby enhancing the heat rate advantage already enjoyed by the plants. In total, this approach lays a foundation for a sustainable competitive cost advantage in operating our plants. The integration of gas production, hedging, optimization and marketing activities achieves additional cost reductions while simultaneously enhancing revenues. Our Öeet of natural gas burning power plants requires a large amount of gas to operate. Our fuel strategy is to produce from our own gas reserves enough fuel to provide a natural hedge against gas price volatility, while providing a secure and reliable source of fuel and lowering our fuel costs over time. The ownership of gas provides our CES risk management organization with additional Öexibility when structuring Ñxed price transactions with our customers. Recent trends conÑrm that both buyers and sellers of power beneÑt from signing long-term power contracts and avoiding the severe volatility often seen with power prices. The trend towards signing long-term contracts is creating opportunities for companies, such as ours, that own power plants and gas reserves to negotiate directly with buyers (end users and load serving entities) that need power, thereby skipping the trading middlemen, many of whom have now exited the market. 6
- 8. Our marketing and sales organization is dedicated to serving wholesale and industrial customers with reliable, cost-eÅective electricity and a full range of services. The organization oÅers customers: (1) wholesale bulk energy; (2) Ñrm supply energy; (3) fully dispatchable energy; (4) full service requirements energy; (5) renewable energy; (6) energy scheduling services; (7) engineering, construction, operations and maintenance services; and (8) critical reliability energy services. Our physical, Ñnancial and intellectual assets and our generating facilities that are pooled into unique energy centers in key markets, enable us to create customizable energy solutions for our customers. For example, our wholesale energy products deliver power when, where and in the capacity our customers need. Our power marketing experience gives us the know-how to structure innovative deals that meet our customers' particular requirements. Our highly tailored, yet understandable energy contracts help customers oÅset pricing risk and other variables. Our quot;quot;Virtual Power Plant'' projects provide customers with an energy resource that is reliable and Öexible. They give customers all of the advantages of owning and operating their own plants without many of the risks, by gaining access to a portfolio of highly eÇcient generation assets and by implementing our IT solutions to allow power to be dispatched as needed. Marketing and Sales is pursuing 21,000 MW of active opportunities with 135 customers across the United States. This customer base includes municipalities, cooperatives, investor owned utilities, industrial customers and commercial customers across the United States. Our Ñnancing strategy includes an objective to achieve and maintain an investment grade credit and bond rating from the major rating agencies within the next several years. We intend to employ various approaches for extending or reÑnancing existing credit facilities and for Ñnancing new plants, with a goal of retaining maximum system operating Öexibility. The availability of capital at attractive terms will be a key requirement to enable us to develop and construct new plants. We have adjusted to recent market conditions by taking near-term actions focused on liquidity. We have been very successful throughout 2003 and early 2004 at selling certain less strategically important assets, monetizing several contracts, establishing a Canadian natural gas trust to raise funds based on selling to the trust certain of our oil and gas assets, buying back our debt, issuing convertible and non-convertible senior notes, and raising capital with non-recourse project Ñnancing. COMPETITION We are engaged in several diÅerent types of business activities each of which has its own competitive environment. To better understand the competitive landscape we face, it is helpful to look at Ñve diÅerent groupings of business activities. Development and Construction. In this activity, we face competition from independent power producers (quot;quot;IPPs''), non-regulated subsidiaries of utilities, and increasingly from regulated utilities and large end-users of electricity. Furthermore, the regulatory and community pressures against locating a power plant at a speciÑc site can often be substantial, causing months or years of delays. Similarly, the construction process is highly competitive as there are only a few primary suppliers of key gas turbine, steam turbine and heat recovery steam generator equipment used in a state of the art gas turbine power plant. Additionally, we have seen periods of strong competition with respect to securing the best construction personnel and contractors. Power Plant Operations. The competitive landscape faced by our power plant operations organization consists of a patchwork of highly competitive and highly regulated market environments. This patchwork has been caused by an uneven transition to deregulated markets across the various states and provinces of North America. For example, in markets where there is open competition, our merchant capacity (that which has not been sold under a long-term contract) competes directly on a real time basis with all other sources of electricity such as nuclear, coal, oil, gas-Ñred, and renewable units owned by others. However, there are other markets where the local incumbent utility still predominantly uses its own supply to meet its own demand before dispatching competitively provided power. Each of these markets oÅers a unique and challenging competitive environment. Asset Acquisition and Divestiture. The recent downturn in the electricity industry has prompted many companies to sell assets to improve their Ñnancial positions. In addition, the postponement of plans for construction of new power plants is also creating a competitive market for the sale of excess equipment. Although there is a strong buyers market at the moment, relatively few assets are changing hands due to the gap between sellers' and buyers' price expectations. 7
- 9. Gas Production and Operations. Gas production is a signiÑcant component of our operations and an area that we would like to expand when market conditions are attractive. However, this market is also highly competitive and is populated by numerous participants including majors, large independents and smaller quot;quot;wild cat'' type exploration companies. Recently, the competition in this sector has increased due to a fundamental shift in the supply and demand balance for gas in North America. This shift has driven gas prices higher and has led to increased production activities and development of alternative supply options such as LNG or coal gasiÑcation. In the near-term, however, we expect that the market to Ñnd and produce natural gas will remain highly competitive. Power Marketing and Sales. Power marketing and sales generally includes all those activities associated with identifying customers, negotiating, and selling energy and service contracts to load-serving entities and large scale industrial and retail end-users. SpeciÑcally, there has been a trend for trading companies that served a quot;quot;middle man'' role to exit the industry for Ñnancial and business model reasons. Instead, power generators are increasingly selling long-term power directly to load serving entities (utilities, municipalities, cooperatives) and large scale end-users, thereby reducing the high levels of price volatility witnessed in the industry since 2001. RECENT DEVELOPMENTS Financing. On January 9, 2004, one of the initial purchasers of the 43/4% Contingent Convertible Senior Notes Due 2023 exercised in full its option to purchase an additional $250.0 million of these notes. The notes are convertible into cash and into shares of Calpine common stock upon the occurrence of certain contingencies at an initial conversion price of $6.50 per share, which represents a 38% premium over the New York Stock Exchange closing price of $4.71 per share on November 6, 2003, the date the notes were originally priced. Upon conversion of the notes, we will deliver par value in cash and any additional value in Calpine shares. On January 15, 2004, we completed the sale of our 50-percent undivided interest in the 545-megawatt Lost Pines 1 Power Project to GenTex Power Corporation, an aÇliate of the Lower Colorado River Authority (quot;quot;LCRA''). Under the terms of the agreement, we received a cash payment of $146.8 million and recorded a gain before taxes of $35.5 million in January 2004. In addition, CES entered into a tolling agreement with LCRA to purchase 250 megawatts of electricity through December 31, 2004. At December 31, 2003, we classiÑed our undivided interest in the Lost Pines facility as quot;quot;held for sale'' and reclassiÑed all earnings to discontinued operations (see Note 10 of the Notes to Consolidated Financial Statements). In January 2004 CES concluded a settlement with the Commodity Futures Trading Commission (quot;quot;CFTC'') related to the CFTC's Ñnding of inaccurate reporting of certain natural gas trading information by one former CES employee during 2001 and 2002. Neither Calpine nor CES beneÑted from the trader's conduct. Under the terms of the agreement, CES paid a civil monetary penalty in the amount of $1.5 million without admitting or denying the Ñndings in the CFTC's order. Subsequent to December 31, 2003, we repurchased approximately $177.0 million in principal amount of our outstanding 4% Convertible Senior Notes Due 2006 (quot;quot;2006 Convertible Senior Notes'') that can be put to us in exchange for approximately $176.0 million in cash. Additionally, on February 9, 2004, we made a cash tender oÅer, which expired on March 9, 2004, for all of the outstanding 2006 Convertible Senior Notes at a price of par plus accrued interest. On March 10, 2004, we paid an aggregate amount of $412.8 million for the tendered 2006 Convertible Senior Notes which included accrued interest of $3.4 million. Currently, 2006 Convertible Senior Notes in the aggregate principal amount of $73.7 million remain outstanding. On February 2, 2004, a class action complaint was Ñled in the United States District Court for the Southern District of New York against CES and others. The complaint alleges unlawful manipulation of natural gas futures and options contracts traded on NYMEX during the period January 21, 2000 through December 31, 2002. The causes of action alleged are fraudulent concealment and violations of the Commodity Exchange Act, and CES anticipates Ñling a motion to dismiss the complaint. This complaint was Ñled as a 8
- 10. related action to another consolidated class action complaint involving numerous other defendants. The court has not granted class action certiÑcation for any of the matters at this time. On February 18, 2004, one of our wholly owned subsidiaries closed on the sale of natural gas properties to Calpine Natural Gas Trust (quot;quot;CNG Trust''). We received consideration of Cdn$40.5 million (US$30.9 million). We hold 25% of the outstanding trust units of CNG Trust and account for the investment using the equity method. On February 18, 2004, we entered into an agreement to purchase the Brazos Valley Power Plant in Fort Bend County, Texas, for approximately $175.0 million in cash, subject to certain adjustments. We expect to acquire the 570-megawatt, natural gas-Ñred facility with the net proceeds from the sale of Lost Pines 1 and cash on hand. The special purpose companies that own Brazos Valley are indirectly owned by the consortium of banks that had provided construction Ñnancing for the power plant and had taken possession of the plant from the original developer in 2003. Upon completion of the transaction, Brazos Valley will become part of the collateral package for the Calpine Construction Finance Company, L.P. (quot;quot;CCFC I'') First Priority Secured Institutional Term Loans Due 2009 and Second Priority Senior Secured Floating Rate Notes Due 2011. On February 20, 2004, we completed a $250.0 million, non-recourse project Ñnancing for the 600- megawatt Rocky Mountain Energy Center. A consortium of banks Ñnanced the construction of the plant at a rate of LIBOR plus 250 basis points. Upon commercial operation of the Rocky Mountain Energy Center in the summer of 2004, the banks will provide a three-year term-loan facility. On March 23, 2004, our wholly owned subsidiary CalGen, formerly Calpine Construction Finance Company II, LLC (quot;quot;CCFC II''), completed its oÅering of secured term loans and secured notes. As expected, we realized net total proceeds from the oÅerings (after payment of transaction fees and expenses, including the fee payable to Morgan Stanley in connection with an index hedge) in the approximate amount of $2.3 billion. The oÅerings included: Amount Description Interest Rate $235.0 million First Priority Secured Floating Rate Notes Due 2009 LIBOR plus 375 basis points $640.0 million Second Priority Secured Floating Rate Notes Due 2010 LIBOR plus 575 basis points $680.0 million Third Priority Secured Floating Rate Notes Due 2011 LIBOR plus 900 basis points $150.0 million Third Priority Secured Notes Due 2011 11.50% $600.0 million First Priority Secured Term Loans due 2009 LIBOR plus 375 basis points(1) $100.0 million Second Priority Secured Term Loans due 2010 LIBOR plus 575 basis points(2) (1) We may also elect a Base Rate plus 275 basis points. (2) We may also elect a Base Rate plus 475 basis points. The secured term loans and secured notes described above in each case are secured, through a combination of pledges of the equity interests in CalGen and its Ñrst tier subsidiary, CalGen Expansion Company, liens on the assets of CalGen's power generating facilities (other than its Goldendale facility) and related assets located throughout the United States. The lenders' recourse is limited to such security, and none of the indebtedness is guaranteed by Calpine. Net proceeds from the oÅerings were used to reÑnance amounts outstanding under the $2.5 billion CCFC II revolving construction credit facility, which was scheduled to mature in November 2004, and to pay fees and transaction costs associated with the reÑnancing. Concurrently with this reÑnancing, we amended and restated the CCFC II credit facility (as amended and restated, the quot;quot;CalGen revolving credit facility'') to reduce the commitments under the facility to $200.0 million and extend its maturity to March 2007. Interest under the CalGen revolving facility equals LIBOR plus 350 basis points (or, at our election, the Base Rate plus 250 basis points). Outstanding indebtedness and letters of credit at December 31, 2003, and at the reÑnancing date, under the CCFC II credit facility totaled approximately $2.3 billion and 2.4 billion, respectively. See quot;quot;Ì Summary of Key Activities'' for 2003 developments. 9
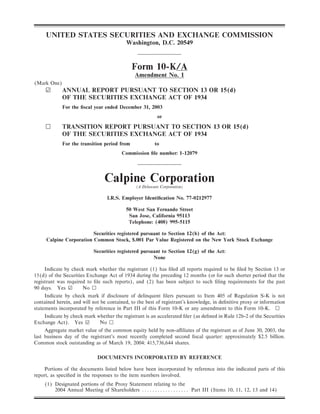
- 11. DESCRIPTION OF POWER GENERATION FACILITIES 1 1 NPCC 1 1 3 1 NEPOOL 4 MA PP 1 1 1 NYPOOL 2 W ECC 1 MAAC 39 3 2 MAIN 1 1 1 3 ECAR 2 SPP 1 2 1 1 1 SERC 3 1 2 10 1 1 1 1 ERCOT 1 1 UK 2 FRCC 10
- 12. At March 24, 2004, we had ownership or lease interests in 87 operating power generation facilities representing 22,206 megawatts of net capacity. Of these projects, 68 are gas-Ñred power plants with a net capacity of 21,356 megawatts, and 19 are geothermal power generation facilities with a net capacity of 850 megawatts. We also have 12 gas-Ñred projects and 1 project expansion currently under construction with a net capacity of 7,685 megawatts. We expect to complete construction of advanced development projects. The timing of the completion of these projects will be based on market fundamentals and when our return on investment criteria are expected to be met, and Ñnancing is available on attractive terms. Each of the power generation facilities currently in operation produces electricity for sale to a utility, other third-party end user, or to an intermediary such as a trading company. Thermal energy produced by the gas-Ñred cogeneration facilities is sold to industrial and governmental users. The gas-Ñred and geothermal power generation projects in which we have an interest produce electricity and thermal energy that are sold pursuant to short-term and long-term power sales agreements or into the spot market. Revenue from a power sales agreement often consists of either or both of the following components: energy payments and capacity payments. Energy payments are based on a power plant's net electrical output, and payment rates are typically either at Ñxed rates or indexed to fuel costs. Capacity payments are based on a power plant's net electrical output and/or its available capacity. Energy payments are earned for each kilowatt-hour of energy delivered, while capacity payments, under certain circumstances, are earned whether or not any electricity is scheduled by the customer and delivered. Upon completion of our projects under construction, we will provide operating and maintenance services for 97 of the 99 power plants in which we have an interest. Such services include the operation of power plants, geothermal steam Ñelds, wells and well pumps, gas Ñelds, gathering systems and gas pipelines. We also supervise maintenance, materials purchasing and inventory control, manage cash Öow, train staÅ and prepare operating and maintenance manuals for each power generation facility that we operate. As a facility develops an operating history, we analyze its operation and may modify or upgrade equipment or adjust operating procedures or maintenance measures to enhance the facility's reliability or proÑtability. These services are sometimes performed for third parties under the terms of an operating and maintenance agreement pursuant to which we are generally reimbursed for certain costs, paid an annual operating fee and may also be paid an incentive fee based on the performance of the facility. The fees payable to us may be subordinated to any lease payments or debt service obligations of Ñnancing for the project. In order to provide fuel for the gas-Ñred power generation facilities in which we have an interest, natural gas reserves are acquired or natural gas is purchased from third parties under supply agreements. We manage a gas-Ñred power facility's fuel supply so that we protect the plant's spark spread. We currently hold interests in geothermal leaseholds in Lake and Sonoma Counties in northern California (quot;quot;The Geysers'') that produce steam that is supplied to geothermal power generation facilities owned by us for use in producing electricity. In late 2003 we began to inject waste water from the City of Santa Rosa Recharge Project into our geothermal reservoirs. We expect this recharge project to extend the useful life and enhance the performance of The Geysers geothermal resources and power plants. Certain power generation facilities in which we have an interest have been Ñnanced primarily with project Ñnancing that is structured to be serviced out of the cash Öows derived from the sale of electricity and thermal energy produced by such facilities and provides that the obligations to pay interest and principal on the loans are secured almost solely by the capital stock or partnership interests, physical assets, contracts and/or cash Öow attributable to the entities that own the facilities. The lenders under non-recourse project Ñnancing generally have no recourse for repayment against us or any of our assets or the assets of any other entity other than foreclosure on pledges of stock or partnership interests and the assets attributable to the entities that own the facilities. Our plan historically has been to reÑnance project-speciÑc construction Ñnancing with long-term capital market Ñnancing after construction projects enter commercial operation. Substantially all of the power generation facilities in which we have an interest are located on sites which we own or are leased on a long-term basis. See Item 2. quot;quot;Properties.'' 11
- 13. Set forth below is certain information regarding our operating power plants and plants under construction as of March 24, 2004. Megawatts Calpine Net With Calpine Net Interest Number Baseload Peaking Interest with of Plants Capacity Capacity Baseload Peaking In operation Geothermal power plants ÏÏÏÏÏÏÏÏÏÏÏÏÏÏÏÏÏÏ 19 850 850 850 850 Gas-Ñred power plantsÏÏÏÏÏÏÏÏÏÏÏÏÏÏÏÏÏÏÏÏÏ 68 18,941 23,347 17,104 21,356 Under construction New facilities ÏÏÏÏÏÏÏÏÏÏÏÏÏÏÏÏÏÏÏÏÏÏÏÏÏÏÏÏ 12 6,057 7,028 6,057 7,028 Expansion projectÏÏÏÏÏÏÏÏÏÏÏÏÏÏÏÏÏÏÏÏÏÏÏÏÏ Ì 438 657 438 657 Total ÏÏÏÏÏÏÏÏÏÏÏÏÏÏÏÏÏÏÏÏÏÏÏÏÏÏÏÏÏÏÏÏÏ 99 26,286 31,882 24,449 29,891 Operating Power Plants Country, Calpine Net US With Calpine Net Interest State or Baseload Peaking Calpine Interest With Total 2003 Can. Capacity Capacity Interest Baseload Peaking Generation Power Plant Province (MW) (MW) Percentage (MW) (MW) MWh(1) Geothermal Power Plants Sonoma County (12 plants)ÏÏÏÏÏ CA 512.0 512.0 100.0% 512.0 512.0 4,022,608 Lake County (2 plants) ÏÏÏÏÏÏÏÏ CA 145.0 145.0 100.0% 145.0 145.0 1,202,592 Calistoga ÏÏÏÏÏÏÏÏÏÏÏÏÏÏÏÏÏÏÏÏÏ CA 73.0 73.0 100.0% 73.0 73.0 615,960 Sonoma ÏÏÏÏÏÏÏÏÏÏÏÏÏÏÏÏÏÏÏÏÏÏ CA 53.0 53.0 100.0% 53.0 53.0 350,317 West Ford FlatÏÏÏÏÏÏÏÏÏÏÏÏÏÏÏÏ CA 27.0 27.0 100.0% 27.0 27.0 237,225 Bear CanyonÏÏÏÏÏÏÏÏÏÏÏÏÏÏÏÏÏÏ CA 20.0 20.0 100.0% 20.0 20.0 157,028 Aidlin ÏÏÏÏÏÏÏÏÏÏÏÏÏÏÏÏÏÏÏÏÏÏÏ CA 20.0 20.0 100.0% 20.0 20.0 146,448 Total Geothermal Power Plants (19)ÏÏÏÏÏÏÏÏÏÏÏÏÏÏÏÏÏÏÏÏÏ 850.0 850.0 850.0 850.0 6,732,178 Gas-Fired Power Plants Saltend Energy Centre ÏÏÏÏÏÏÏÏÏ UK 1,200.0 1,200.0 100.0% 1,200.0 1,200.0 9,095,929 Acadia Energy Center ÏÏÏÏÏÏÏÏÏÏ LA 1,080.0 1,160.0 50.0% 540.0 580.0 2,259,944 Oneta Energy CenterÏÏÏÏÏÏÏÏÏÏÏ OK 994.0 994.0 100.0% 994.0 994.0 611,992 Freestone Energy CenterÏÏÏÏÏÏÏÏ TX 1,022.0 1,022.0 100.0% 1,022.0 1,022.0 4,930,706 Broad River Energy Center ÏÏÏÏÏ SC Ì 840.0 100.0% Ì 840.0 206,078 Delta Energy Center ÏÏÏÏÏÏÏÏÏÏÏ CA 799.0 882.0 100.0% 799.0 882.0 5,440,349 Baytown Energy Center ÏÏÏÏÏÏÏÏ TX 742.0 830.0 100.0% 742.0 830.0 5,045,069 Morgan Energy Center ÏÏÏÏÏÏÏÏÏ AL 722.0 852.0 100.0% 722.0 852.0 95,457 Pasadena Power Plant ÏÏÏÏÏÏÏÏÏÏ TX 751.0 787.0 100.0% 751.0 787.0 4,080,123 Magic Valley Generating Station TX 700.0 751.0 100.0% 700.0 751.0 2,683,274 Decatur Energy Center ÏÏÏÏÏÏÏÏÏ AL 692.0 838.0 100.0% 692.0 838.0 429,220 Hermiston Power Project ÏÏÏÏÏÏÏ OR 546.0 642.0 100.0% 546.0 642.0 2,615,001 Channel Energy CenterÏÏÏÏÏÏÏÏÏ TX 527.0 574.0 100.0% 527.0 574.0 3,144,479 Aries Power Project ÏÏÏÏÏÏÏÏÏÏÏÏ MO 516.0 591.0 50.0% 258.0 295.5 791,065 South Point Energy CenterÏÏÏÏÏÏ AZ 520.0 530.0 100.0% 520.0 530.0 2,944,368 Los Medanos Energy Center ÏÏÏÏ CA 497.0 566.0 100.0% 497.0 566.0 3,344,159 Sutter Energy Center ÏÏÏÏÏÏÏÏÏÏ CA 535.0 543.0 100.0% 535.0 543.0 3,234,514 12
- 14. Country, Calpine Net US With Calpine Net Interest State or Baseload Peaking Calpine Interest With Total 2003 Can. Capacity Capacity Interest Baseload Peaking Generation Power Plant Province (MW) (MW) Percentage (MW) (MW) MWh(1) Lost Pines 1 Power Project(2)ÏÏÏ TX Ì Ì 0.0% Ì Ì 3,101,574 Ontelaunee Energy Center ÏÏÏÏÏÏ PA 561.0 584.0 100.0% 561.0 584.0 863,253 Westbrook Energy CenterÏÏÏÏÏÏÏ ME 528.0 528.0 100.0% 528.0 528.0 3,307,527 Corpus Christi Energy Center ÏÏÏ TX 414.0 537.0 100.0% 414.0 537.0 1,854,208 Hidalgo Energy Center ÏÏÏÏÏÏÏÏÏ TX 502.0 502.0 78.5% 394.1 394.1 1,743,360 Carville Energy Center ÏÏÏÏÏÏÏÏÏ LA 455.0 531.0 100.0% 455.0 531.0 1,697,994 Texas City Power PlantÏÏÏÏÏÏÏÏÏ TX 465.0 471.0 100.0% 465.0 471.0 2,446,410 RockGen Energy Center ÏÏÏÏÏÏÏÏ WI Ì 460.0 100.0% Ì 460.0 223,977 Deer Park Energy Center, Phases 1 and 1a ÏÏÏÏÏÏÏÏÏÏÏÏÏ TX 354.0 362.0 100.0% 354.0 362.0 1,823,311 Clear Lake Power Plant ÏÏÏÏÏÏÏÏ TX 335.0 412.0 100.0% 335.0 412.0 1,918,603 Zion Energy Center ÏÏÏÏÏÏÏÏÏÏÏÏ IL Ì 513.0 100.0% Ì 513.0 74,781 Santa Rosa Energy Center ÏÏÏÏÏÏ FL 250.0 250.0 100.0% 250.0 250.0 22,706 Blue Spruce Energy Center ÏÏÏÏÏ CO Ì 300.0 100.0% Ì 300.0 290,410 Calgary Energy Centre ÏÏÏÏÏÏÏÏÏ AB 250.0 300.0 30.0% 75.0 90.0 731,449 Rumford Power Plant ÏÏÏÏÏÏÏÏÏÏ ME 237.0 251.0 100.0% 237.0 251.0 1,547,533 Hog Bayou Energy Center ÏÏÏÏÏÏ AL 246.6 246.6 100.0% 246.6 246.6 122,762 Tiverton Power PlantÏÏÏÏÏÏÏÏÏÏÏ RI 240.0 240.0 100.0% 240.0 240.0 1,689,698 Gordonsville Power Plant(3) ÏÏÏÏ VA Ì Ì 0.0% Ì Ì 155,402 Island Cogeneration ÏÏÏÏÏÏÏÏÏÏÏÏ BC 230.0 230.0 30.0% 69.0 69.0 1,487,028 Pine BluÅ Energy Center ÏÏÏÏÏÏÏ AR 213.3 213.3 100.0% 213.3 213.3 1,503,735 Los Esteros Critical Energy Center ÏÏÏÏÏÏÏÏÏÏÏÏÏÏÏÏÏÏÏÏÏ CA Ì 180.0 100.0% Ì 180.0 164,251 Morris Power Plant ÏÏÏÏÏÏÏÏÏÏÏÏ IL 155.0 177.5 86.0% 134.0 146.4 484,971 Dighton Power Plant ÏÏÏÏÏÏÏÏÏÏÏ MA 162.0 168.0 100.0% 162.0 168.0 449,781 Androscoggin Energy Center ÏÏÏÏ ME 160.0 160.0 32.3% 51.7 51.7 796,172 Auburndale Power Plant ÏÏÏÏÏÏÏÏ FL 143.0 153.0 30.0% 42.9 45.9 1,094,795 Grays Ferry Power PlantÏÏÏÏÏÏÏÏ PA 143.0 148.0 40.0% 57.2 59.2 765,609 Gilroy Peaking Energy Center ÏÏÏ CA Ì 135.0 100.0% Ì 135.0 69,338 Gilroy Power Plant ÏÏÏÏÏÏÏÏÏÏÏÏ CA 112.0 131.0 100.0% 112.0 131.0 184,603 Pryor Power Plant ÏÏÏÏÏÏÏÏÏÏÏÏÏ OK 109.0 124.0 80.0% 87.2 99.2 331,035 Sumas Power Plant ÏÏÏÏÏÏÏÏÏÏÏÏ WA 120.0 122.0 0.1% 0.1 0.1 943,343 Parlin Power Plant ÏÏÏÏÏÏÏÏÏÏÏÏÏ NJ 89.0 118.0 80.0% 71.2 94.4 84,825 Auburndale Peaking Energy Center ÏÏÏÏÏÏÏÏÏÏÏÏÏÏÏÏÏÏÏÏÏ FL Ì 115.0 100.0% Ì 115.0 36,067 King City Power Plant ÏÏÏÏÏÏÏÏÏ CA 103.0 115.0 40.0% 41.2 46.0 928,484 Kennedy International Airport Power Plant (quot;quot;KIAC'') ÏÏÏÏÏÏ NY 95.0 105.0 100.0% 95.0 105.0 581,122 Bethpage Power Plant ÏÏÏÏÏÏÏÏÏÏ NY 52.0 53.7 100.0% 52.0 53.7 423,104 Bethpage Peaking Energy Center NY Ì 48.0 100.0% Ì 48.0 97,005 Pittsburg Power Plant ÏÏÏÏÏÏÏÏÏÏ CA 64.0 71.0 100.0% 64.0 71.0 239,991 Newark Power Plant ÏÏÏÏÏÏÏÏÏÏÏ NJ 47.0 58.0 80.0% 37.6 46.4 376,911 Greenleaf 1 Power Plant ÏÏÏÏÏÏÏÏ CA 50.0 50.0 100.0% 50.0 50.0 388,939 Greenleaf 2 Power Plant ÏÏÏÏÏÏÏÏ CA 50.0 50.0 100.0% 50.0 50.0 363,320 Whitby CogenerationÏÏÏÏÏÏÏÏÏÏÏ ON 50.0 50.0 15.0% 7.5 7.5 344,648 King City Peaking Energy Center CA Ì 45.0 100.0% Ì 45.0 17,436 13
- 15. Country, Calpine Net US With Calpine Net Interest State or Baseload Peaking Calpine Interest With Total 2003 Can. Capacity Capacity Interest Baseload Peaking Generation Power Plant Province (MW) (MW) Percentage (MW) (MW) MWh(1) Yuba City Energy Center ÏÏÏÏÏÏÏ CA Ì 45.0 100.0% Ì 45.0 19,078 Feather River Energy Center ÏÏÏÏ CA Ì 45.0 100.0% Ì 45.0 15,745 Creed Energy CenterÏÏÏÏÏÏÏÏÏÏÏ CA Ì 45.0 100.0% Ì 45.0 14,266 Lambie Energy Center ÏÏÏÏÏÏÏÏÏ CA Ì 45.0 100.0% Ì 45.0 14,140 Wolfskill Energy Center ÏÏÏÏÏÏÏÏ CA Ì 45.0 100.0% Ì 45.0 16,820 Goose Haven Energy Center ÏÏÏÏ CA Ì 45.0 100.0% Ì 45.0 13,524 Riverview Energy Center ÏÏÏÏÏÏÏ CA Ì 45.0 100.0% Ì 45.0 15,693 Stony Brook Power Plant ÏÏÏÏÏÏÏ NY 36.0 40.0 100.0% 36.0 40.0 346,971 Watsonville Power Plant ÏÏÏÏÏÏÏÏ CA 29.0 30.0 100.0% 29.0 30.0 211,755 Agnews Power Plant ÏÏÏÏÏÏÏÏÏÏÏ CA 26.5 28.6 100.0% 26.5 28.6 219,153 Philadelphia Water Project ÏÏÏÏÏÏ PA 22.0 23.0 66.4% 14.6 15.3 Ì Total Gas-Fired Power Plants (68) ÏÏÏÏÏÏÏÏÏÏÏÏÏÏÏ 18,941.4 23,346.7 17,103.7 21,355.9 87,610,343 Total Operating Power Plants (87) ÏÏÏÏÏÏÏÏÏÏÏÏÏÏÏ 19,791.4 24,196.7 17,953.7 22,205.9 94,342,521 Consolidated Projects including plants with operating leases ÏÏÏ 17,722.4 21,965.7 17,039.2 21,211.9 Equity (Unconsolidated) Projects 2,069.0 2,231.0 914.5 994.0 (1) Generation MWh is shown here as 100% of each plant's gross generation in megawatt hours (quot;quot;MWh''). (2) This facility is presented here only to state the facility's generation in MWh for 2003. This facility was sold in January 2004. See Note 10 of the Notes to Consolidated Financial Statements for more information regarding the sale of this facility. (3) This facility is presented here only to state the facility's generation in MWh through November 26, 2003, the date it was sold. See Note 7 of the Notes to Consolidated Financial Statements for more information regarding the sale of this facility. 14
- 16. Projects Under Construction (All gas-Ñred) Country, Calpine Net US With Calpine Net Interest State or Baseload Peaking Calpine Interest With Can. Capacity Capacity Interest Baseload Peaking Power Plant Province (MW) (MW) Percentage (MW) (MW) Projects Under Construction Deer Park Energy Center* TX 438.0 657.0 100.0% 438.0 657.0 Hillabee Energy CenterÏÏÏÏ AL 710.0 770.0 100.0% 710.0 770.0 Pastoria Energy Center ÏÏÏÏ CA 759.0 769.0 100.0% 759.0 769.0 Fremont Energy Center ÏÏÏ OH 550.0 700.0 100.0% 550.0 700.0 Columbia Energy Center ÏÏ SC 464.0 641.0 100.0% 464.0 641.0 Riverside Energy Center ÏÏÏ WI 518.0 602.0 100.0% 518.0 602.0 Metcalf Energy Center ÏÏÏÏ CA 556.0 602.0 100.0% 556.0 602.0 Osprey Energy Center ÏÏÏÏÏ FL 530.0 609.0 100.0% 530.0 609.0 Washington Parish Energy Center ÏÏÏÏÏÏÏÏÏÏÏÏÏÏÏÏ LA 509.0 565.0 100.0% 509.0 565.0 Otay Mesa Energy Center CA 510.0 593.0 100.0% 510.0 593.0 Rocky Mountain Energy Center ÏÏÏÏÏÏÏÏÏÏÏÏÏÏÏÏ CO 479.0 601.0 100.0% 479.0 601.0 Goldendale Energy Center WA 237.0 271.0 100.0% 237.0 271.0 Fox Energy Center ÏÏÏÏÏÏÏ WI 235.0 305.0 100.0% 235.0 305.0 Total Projects Under Construction ÏÏÏÏÏÏÏÏÏ 6,495.0 7,685 6,495.0 7,685.0 * Expansion project. ACQUISITIONS OF POWER PROJECTS AND PROJECTS UNDER CONSTRUCTION We have extensive experience in the development and acquisition of power generation projects. We have historically focused principally on the development and acquisition of interests in gas-Ñred and geothermal power projects, although we may also consider projects that utilize other power generation technologies. We have signiÑcant expertise in a variety of power generation technologies and have substantial capabilities in each aspect of the development and acquisition process, including design, engineering, procurement, construction management, fuel and resource acquisition and management, power marketing, Ñnancing and operations. As indicated in the Strategy Section, our development and acquisition activities have been greatly scaled back, for the indeÑnite future, to focus on liquidity and operational priorities. Acquisitions We may consider the acquisition of an interest in operating projects as well as projects under development where we would assume responsibility for completing the development of the project. In the acquisition of power generation facilities, we generally seek to acquire 100% ownership of facilities that oÅer us attractive opportunities for earnings growth, and that permit us to assume sole responsibility for the operation and maintenance of the facility. In evaluating and selecting a project for acquisition, we consider a variety of factors, including the type of power generation technology utilized, the location of the project, the terms of any existing power or thermal energy sales agreements, gas supply and transportation agreements and wheeling agreements, the quantity and quality of any geothermal or other natural resource involved, and the actual condition of the physical plant. In addition, we assess the past performance of an operating project and prepare Ñnancial projections to determine the proÑtability of the project. Acquisition activity is dependent on the 15
- 17. availability of Ñnancing on attractive terms and the expectation of returns that meet our long-term requirements. Although our preference is to own 100% of the power plants we acquire or develop, there are situations when we take less than 100% ownership. Reasons why we may take less than a 100% interest in a power plant may include, but are not limited to: (a) our acquisitions of other independent power producers such as Cogeneration Corporation of America in 1999 and SkyGen Energy LLC in 2000 in which minority interest projects were included in the portfolio of assets owned by the acquired entities (Grays Ferry Power Plant (40% now owned by Calpine) and Androscoggin Energy Center (32.3% now owned by Calpine), respectively); (b) opportunities to co-invest with non-regulated subsidiaries of regulated electric utilities, which under PURPA are restricted to 50% ownership of cogeneration qualifying facilities; and (c) opportunities to invest in merchant power projects with partners who bring marketing, funding, permitting or other resources that add value to a project, for example, Acadia Energy Center in Louisiana (50% owned by Calpine and 50% owned by Cleco Midstream Resources, an aÇliate of Cleco Corporation). None of our equity investment projects have nominal carrying values as a result of material recurring losses. Further, there is no history of impairment in any of these investments. Projects Under Construction The development and construction of power generation projects involves numerous elements, including evaluating and selecting development opportunities, designing and engineering the project, obtaining power sales agreements in some cases, acquiring necessary land rights, permits and fuel resources, obtaining Ñnancing, procuring equipment and managing construction. We intend to focus on completing projects already in construction and starting new projects only when Ñnancing is available and attractive returns are expected. Deer Park Energy Center. In March 2001 we announced plans to build, own and operate a 1,019- megawatt, natural gas-Ñred energy center in Deer Park, Texas. The Deer Park Energy Center supplies steam to Shell Chemical Company, and electric power generated at the facility is sold on the wholesale market. Construction began in mid-2001. The Ñrst and second phases of the project entered commercial operation in June 2003 and the Ñnal phase is expected to begin commercial operation in June 2004. Hillabee Energy Center. On February 24, 2000, we announced plans to build, own and operate the Hillabee Energy Center, a 770-megawatt, natural gas-Ñred cogeneration facility in Tallapoosa County, Alabama. Construction began in mid-2001, and we expect commercial operation of the facility will commence in spring 2006. Pastoria Energy Center. In April 2001 we acquired the rights to develop the 769-megawatt Pastoria Energy Center, a combined-cycle project planned for Kern County, California. Construction began in mid- 2001, and commercial operation is scheduled to begin in the fall of 2004 for phase one and in mid-2005 for phase two. Fremont Energy Center. On May 23, 2000, we announced plans to build, own and operate the Fremont Energy Center, a 700-megawatt natural gas-Ñred electricity generating facility to be located near Fremont, Ohio. Commercial operation is expected to commence in the summer of 2006. Columbia Energy Center. On September 25, 2001, we announced plans to construct the new 641- megawatt Columbia Energy Center, a natural gas-Ñred cogeneration facility located on property leased from Voridian (formerly Eastman Chemical Company) in Calhoun County, S.C. The facility will sell electricity to the wholesale power market and will supply thermal energy to Voridian. Commercial operation is expected to commence in the spring of 2004. Riverside Energy Center. On December 18, 2002, we announced that construction of the Riverside Energy Center, a 602-megawatt natural gas-Ñred electricity generating facility had begun in Beloit, Wisconsin. We anticipate commercial operation of the facility to begin in the summer of 2004. Metcalf Energy Center. On April 30, 1999, we submitted an Application for CertiÑcation with the California Energy Commission (quot;quot;CEC'') to build, own and operate the Metcalf Energy Center, a 602-mega- 16
- 18. watt natural gas-Ñred electricity generating facility located in San Jose, California. The CEC permit was approved on September 21, 2001. Construction of the facility began in June 2002, and commercial operation is anticipated to commence in the summer of 2005. Osprey Energy Center. On January 11, 2000, we announced plans to build, own and operate the Osprey Energy Center, a 609-megawatt, natural gas-Ñred cogeneration energy center near the city of Auburndale, Florida. Construction commenced in the fall 2001 and commercial operation of the facility is scheduled to begin in the spring of 2004. Upon commercial operation, the Osprey Energy Center will supply electric power to Tampa, Florida-based Seminole Electric Cooperative, Inc. for a period of 16 years. Washington Parish Energy Center. On January 26, 2001, we announced the acquisition of the development rights from Cogentrix, an independent power company based in North Carolina, for the 565- megawatt Washington Parish Energy Center, located near Bogalusa, Louisiana. We are managing construc- tion of the facility, which began in January 2001, and will operate the facility when it enters commercial operation, which is anticipated to be in the summer of 2006. Otay Mesa Energy Center. On July 10, 2001, we acquired Otay Mesa Generating Company, LLC and the associated development rights including a license from the California Energy Commission. The 593- megawatt facility is located in southern San Diego County, California. Construction began in 2001. In October 2003 we signed a term sheet setting forth the principal terms and conditions for a ten-year, 570- megawatt power sales agreement with San Diego Gas & Electric (quot;quot;SDG&E''). Under the Ñnal agreement, we will supply electricity to SDG&E from the Otay Mesa Energy Center. Power deliveries are scheduled to begin in 2007. Rocky Mountain Energy Center. In August 2002 we commenced construction of the 601-megawatt, natural gas-Ñred Rocky Mountain Energy Center in Weld County, Colorado. We will sell the output of the facility to Public Service Co. of Colorado under the terms of a ten-year tolling agreement. Commercial operation of the facility is expected to commence in the summer of 2004. Goldendale Energy Center. In April 2001 we acquired the rights to develop a 271-megawatt combined- cycle energy center located in Goldendale, Washington. Construction of the Goldendale Energy Center began in the summer of 2001 and commercial operation is expected to commence in the summer of 2004. Energy generated by the facility will be sold directly into the Northwest Power Pool. Fox Energy Center. In 2003 we acquired the fully permitted 305-megawatt Fox Energy Center in Kaukauna, Wisconsin, which will be used to fulÑll an existing contract with Wisconsin Public Service. Commercial operation is expected to begin in the summer of 2005. OIL AND GAS PROPERTIES In 1997 we began an equity gas strategy to diversify the gas sources for our natural gas-Ñred power plants by purchasing Montis Niger, Inc., a gas production and pipeline company operating primarily in the Sacramento Basin in northern California. We currently supply the majority of the fuel requirements for the Greenleaf 1 and 2 Power Plants from these reserves. In October 1999, we purchased Sheridan Energy, Inc. (quot;quot;Sheridan''), a natural gas exploration and production company operating in northern California and the Gulf Coast region. The Sheridan acquisition provided the initial management team and operational infrastructure to evaluate and acquire oil and gas reserves to keep pace with our growth in gas-Ñred power plants. In December 1999, we added Vintage Petroleum, Inc.'s interest in the Rio Vista Gas Unit and related areas, representing primarily natural gas reserves located in the Sacramento Basin in northern California. Sheridan was merged into Calpine in April 2000 and Calpine Natural Gas L.P. (quot;quot;CNGLP'') was established to manage our oil and gas properties in the U.S. Additionally, we own a 25% interest in CNG Trust, which has proved reserves of approximately 72 Bcfe (18 Bcfe, net to Calpine's equity interest). We are currently capable of producing, net to Calpine's interest, 215 MMcfe of natural gas per day, and CNG Trust total production, net of royalties, is currently 25 MMcfe (6.2 MMcfe net to Calpine's interest) of natural gas per day. Calpine has the Ñrst right to purchase all of CNG Trust's production at market prices. 17
- 19. The focus of the equity gas program has been on acquisitions in strategic markets where we are developing low-cost natural gas supplies and proprietary pipeline systems in support of our natural gas-Ñred power plants. In conjunction with these eÅorts we acquired various gas assets and gas companies in 2001 and 2000. See Note 6 of the Notes to Consolidated Financial Statements for more information regarding the 2001 acquisitions. In 2002 and 2003 certain non-strategic divestments were completed to further focus operations on gas production and to enhance liquidity. These divestments are discussed in detail under Note 10 of the Notes to Consolidated Financial Statements. As a result of our oil and gas acquisition, divestment and drilling program activity, equity equivalent net production from continuing operations was approximately 260 MMcfe/day at December 31, 2003, enough to fuel approximately 2,300 megawatts of our power plant Öeet, assuming an average capacity factor of 70%. MARKETING, HEDGING, OPTIMIZATION, AND TRADING ACTIVITIES Most of the electric power generated by our plants is transferred to our marketing and risk management unit, CES, which sells it to load-serving entities (e.g., utilities) industrial and large retail end users, and to other third parties (e.g., power trading and marketing companies). Because a suÇciently liquid market does not exist for electricity Ñnancial instruments (typically, exchange and over-the-counter traded contracts that net settle rather than entail physical delivery) at most of the locations where we sell power, CES also enters into incremental physical purchase and sale transactions as part of its hedging, balancing, and optimization activities. The hedging, balancing, and optimization activities that we engage in are directly related to exposures that arise from our ownership and operation of power plants and gas reserves and are designed to protect or enhance our quot;quot;spark spread'' (the diÅerence between our fuel cost and the revenue we receive for our electric generation). In many of these transactions CES purchases and resells power and gas in contracts with third parties. We utilize derivatives, which are deÑned in Statement of Financial Accounting Standards (quot;quot;SFAS'') No. 133, quot;quot;Accounting for Derivative Instruments and Hedging Activities'' to include many physical commodity contracts and commodity Ñnancial instruments such as exchange-traded swaps and forward contracts, to optimize the returns that we are able to achieve from our power and gas assets. From time to time we have entered into contracts considered energy trading contracts under Emerging Issues Task Force (quot;quot;EITF'') Issue No. 02-3, quot;quot;Issues Related to Accounting for Contracts Involved in Energy Trading and Risk Management Activities.'' However, our risk managers have low capital at risk and value at risk limits for energy trading, and our risk management policy limits, at any given time, our net sales of power to our generation capacity and limits our net purchases of gas to our fuel consumption requirements on a total portfolio basis. This model is markedly diÅerent from that of companies that engage in signiÑcant commodity trading operations that are unrelated to underlying physical assets. Derivative commodity instruments are accounted for under the requirements of SFAS No. 133. The EITF reached a consensus under EITF Issue No. 02-3 that gains and losses on derivative instruments within the scope of SFAS No. 133 should be shown net in the income statement if the derivative instruments are held for trading purposes. In addition we present on a net basis certain types of hedging, balancing and optimization revenues and costs of revenue under EITF Issue No. 03-11, quot;quot;Reporting Realized Gains and Losses on Derivative Instruments That Are Subject to FASB Statement No. 133 and Not quot;Held for Trading Purposes' As DeÑned in EITF Issue No. 02-3: quot;Issues Involved in Accounting for Derivative Contracts Held for Trading Purposes and Contracts Involved in Energy Trading and Risk Management Activities' '' (quot;quot;EITF Issue No. 03-11''), which we adopted prospectively on October 1, 2003. See Item 7. quot;quot;Management's Discussion and Analysis Ì Impact of Recent Accounting Pronounce- ments'' and Note 2 to the Consolidated Financial Statements for a discussion of the eÅects of adopting this standard. 18
- 20. Following is a discussion of the types of electricity and gas hedging, balancing, optimization, and trading activities in which we engage. Electricity Transactions ‚ Electricity hedging transactions are entered into to reduce potential volatility in future results. An example of an electricity hedging transaction would be one in which we sell power at a Ñxed rate to allow us to predict the future revenues from our portfolio of generating plants. Hedging is a dynamic process; from time to time we adjust the extent to which our portfolio is hedged. An example of an electricity hedge adjusting transaction would be the purchase of power in the market to reduce the extent to which we had previously hedged our generation portfolio through Ñxed price power sales. To illustrate, suppose we had elected to hedge 65% of our portfolio of generation capacity for the following six months but then believed that prices for electricity were going to steadily move up during that same period. We might buy electricity on the open market to reduce our hedged position to, say, 50%. If electricity prices, do in fact increase, we might then sell electricity again to increase our hedged position back to the 65% level and generate additional margin. ‚ Electricity balancing activities are typically short-term in nature and are done to make sure that sales commitments to deliver power are fulÑlled. An example of an electricity balancing transaction would be where one of our generating plants has an unscheduled outage so we buy replacement power to deliver to a customer to meet our sales commitment. ‚ Electricity optimization activity, also generally short-term in nature, is done to maximize our proÑt potential by executing the most proÑtable alternatives in the power markets. An example of an electricity optimization transaction would be fulÑlling a power sales contract with power purchases from third parties instead of generating power when the market price for power is below the cost of generation. In all cases, optimization activity is associated with the operating Öexibility in our systems of power plants, natural gas assets, and gas and power contracts. That Öexibility provides us with alternatives to most proÑtably manage our portfolio. ‚ Electricity trading activities are done with the purpose of proÑting from movement in commodity prices or to transact business with customers in market areas where we do not have generating assets. An example of an electricity trading contract would be where we buy and sell electricity, typically with trading company counterparties, solely to proÑt from electricity price movements. We have engaged in limited activity of this type to date in terms of earnings impact. All such activity is done by CES, mostly through short-term contracts. Another example of an electricity trading contract would be one in which we transact with customers in market areas where we do not have generating assets, generally to develop market experience and customer relations in areas where we expect to have generation assets in the future. We have done a small number of such transactions to date. Natural Gas Transactions ‚ Gas hedging transactions are also entered into to reduce potential volatility in future results. An example of a gas hedging transaction would be where we purchase gas at a Ñxed rate to allow us to predict the future costs of fuel for our generating plants or conversely where we enter into a Ñnancial forward contract to essentially swap Öoating rate (indexed) gas for Ñxed price gas. Similar to electricity hedging, gas hedging is a dynamic process, and from time to time we adjust the extent to which our portfolio is hedged. To illustrate, suppose we had elected to hedge 65% of our gas requirements for our generation capacity for the next six months through Ñxed price gas purchases but then believed that prices for gas were going to steadily decline during that same period. We might sell Ñxed price gas on the open market to reduce our hedged gas position to 50%. If gas prices do in fact decrease, we might then buy Ñxed price gas again to increase our hedged position back to the 65% level and increase our margins. ‚ Gas balancing activities are typically short-term in nature and are done to ensure that purchase commitments for gas are adjusted for changes in production schedules. An example of a gas balancing 19
- 21. transaction would be where one of our generating plants has an unscheduled outage so we sell the gas that we had purchased for that plant to a third party. ‚ Gas optimization activities are also generally short-term in nature and are done to maximize our proÑt potential by executing the most proÑtable alternatives in the gas markets. An example of gas optimization is selling our gas supply, not generating power, and fulÑlling power sales contracts with power purchases from third parties, instead of generating power when market gas prices spike relative to our gas supply cost. ‚ Gas trading activities are done with the purpose of proÑting from movement in commodity prices. An example of gas trading contracts would be where we buy and sell gas, typically with a trading company counterparty, solely to proÑt from gas price movements or where we transact with customers in market areas where we do not have fuel consumption requirements. We have engaged in a limited level of this type of activity to date. All such activity is done by CES, mostly through short-term contracts. In some instances economic hedges may not be designated as hedges for accounting purposes. The accounting treatment of our various risk management and trading activities is governed by SFAS No. 133, EITF Issue No. 02-3, as discussed above, and EITF Issue No. 03-11 which we adopted on October 1, 2003, and is discussed further in Note 2 of the Notes to Consolidated Financial Statements. An example of an economic hedge that is not a hedge for accounting purposes would be a long-term Ñxed price electric sales contract that economically hedges us against the risk of falling electric prices, but which for accounting purposes is exempted from derivative accounting under SFAS No. 133 as a normal sale. For a further discussion of our derivative accounting methodology, see Item 7 Ì quot;quot;Management's Discussion and Analysis of Financial Condition and Results of Operation Ì Application of Critical Accounting Policies.'' GOVERNMENT REGULATION We are subject to complex and stringent energy, environmental and other governmental laws and regulations at the federal, state and local levels in connection with the development, ownership and operation of our energy generation facilities. Federal laws and regulations govern transactions by electric and gas utility companies, the types of fuel which may be utilized by an electricity generating plant, the type of energy which may be produced by such a plant, the ownership of a plant, and access to and service on the transmission grid. In most instances, public utilities that serve retail customers are subject to rate regulation by the state's related utility regulatory commission. A state utility regulatory commission is often primarily responsible for determining whether a public utility may recover the costs of wholesale electricity purchases or other supply- related activity through retail rates that the public utility may charge its customers. The state utility regulatory commission may, from time to time, impose restrictions or limitations on the manner in which a public utility may transact with wholesale power sellers, such as independent power producers. Under certain circumstances where speciÑc exemptions are otherwise unavailable, state utility regulatory commissions may have broad jurisdiction over non-utility electric power plants. Energy producing projects also are subject to federal, state and local laws and administrative regulations which govern the emissions and other substances produced, discharged or disposed of by a plant and the geographical location, zoning, land use and operation of a plant. Applicable federal environmental laws typically have both state and local enforcement and implementation provisions. These environmental laws and regulations generally require that a wide variety of permits and other approvals be obtained before the commencement of construction or operation of an energy producing facility and that the facility then operate in compliance with such permits and approvals. Federal Energy Regulation PURPA The enactment of the Public Utility Regulatory Policies Act of 1978, as amended (quot;quot;PURPA''), and the adoption of regulations thereunder by the Federal Energy Regulatory Commission (quot;quot;FERC'') provided incentives for the development of cogeneration facilities and small power production facilities (those utilizing renewable fuels and having a capacity of less than 80 megawatts). 20