Download to read offline
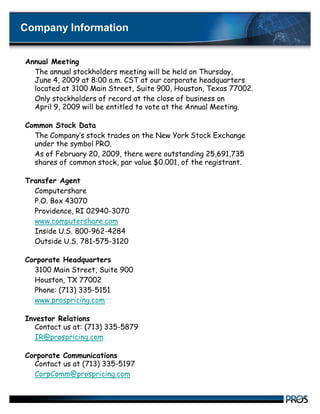
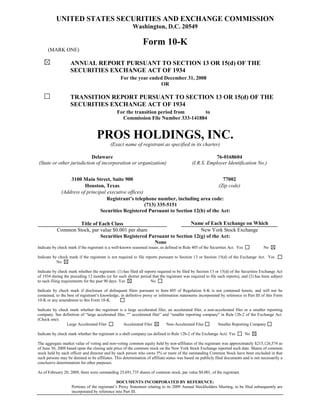

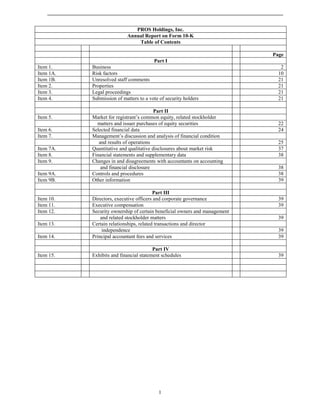

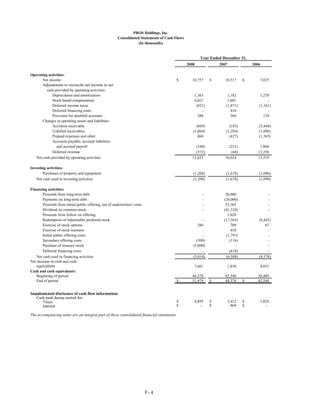
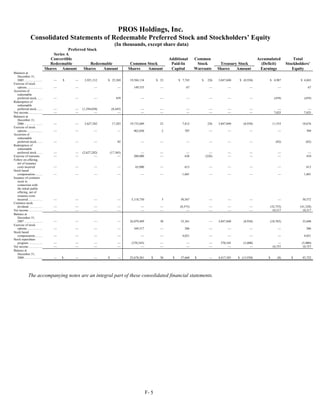


Pros Holdings, Inc. will hold its annual stockholders meeting on June 4, 2009, at its Houston headquarters, where only stockholders of record as of April 9, 2009, can vote. The company specializes in pricing and margin optimization software to enhance financial performance across various industries, having installed over 200 solutions globally. The 10-K report includes detailed information on business operations, risk factors, and financial performance for the year ending December 31, 2008.


