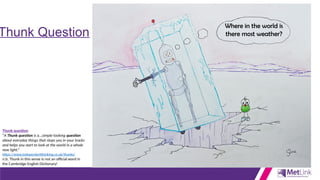
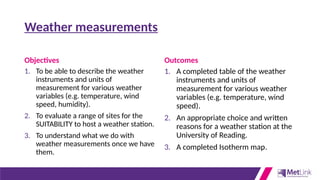
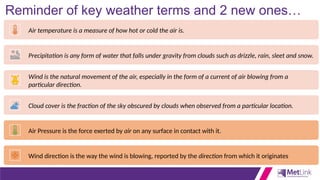
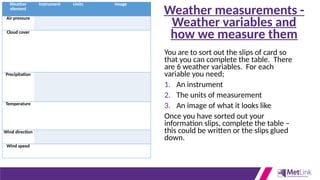
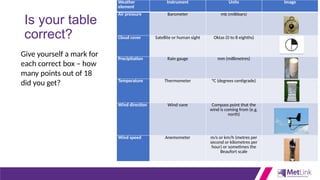
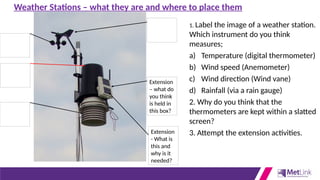
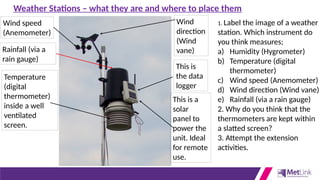
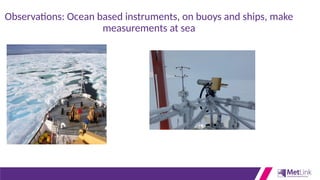
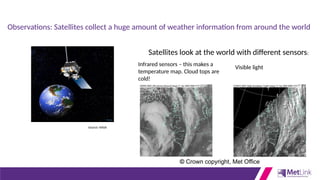
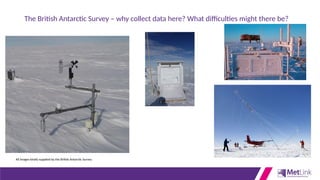
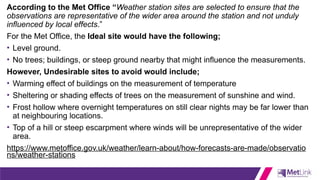
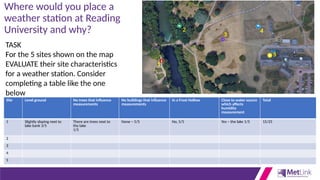
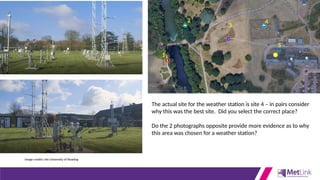
Thunk Question
Thunk question
“A Thunk question is a…simple-looking question
about everyday things that stops you in your tracks
and helps you start to look at the world in a whole
new light.”
https://www.independentthinking.co.uk/thunks/
n.b. Thunk in this sense is not an official word in
the Cambridge English Dictionary!
Where in the world is
there most weather?
Connect your weather learning…
Verbally in pairs;
1. Define the term ‘Weather’
2. Name as many different weather variables as possible
3. Explain how the weather has affected you in the past week
Or attempt this Quizlet set - https://quizlet.com/_8y56zy?x=1jqt&i=38anvz
Weather measurements
Objectives
1. To be able to describe the weather
instruments and units of
measurement for various weather
variables (e.g. temperature, wind
speed, humidity).
2. To evaluate a range of sites for the
SUITABILITY to host a weather station.
3. To understand what we do with
weather measurements once we have
them.
Outcomes
1. A completed table of the weather
instruments and units of
measurement for various weather
variables (e.g. temperature, wind
speed).
2. An appropriate choice and written
reasons for a weather station at the
University of Reading.
3. A completed Isotherm map.
Reminder of key weather terms and 2 new ones…
Air temperature is a measure of how hot or cold the air is.
Precipitation is any form of water that falls under gravity from clouds such as drizzle, rain, sleet and snow.
Wind is the natural movement of the air, especially in the form of a current of air blowing from a
particular direction.
Cloud cover is the fraction of the sky obscured by clouds when observed from a particular location.
Air Pressure is the force exerted by air on any surface in contact with it.
Wind direction is the way the wind is blowing, reported by the direction from which it originates
Weather measurements -
Weather variables and
how we measure them
Weather
element
Instrument Units Image
Air pressure
Cloud cover
Precipitation
Temperature
Wind direction
Wind speed
You are to sort out the slips of card so
that you can complete the table. There
are 6 weather variables. For each
variable you need;
1. An instrument
2. The units of measurement
3. An image of what it looks like
Once you have sorted out your
information slips, complete the table –
this could be written or the slips glued
down.
Is your table
correct?
Weather
element
Instrument Units Image
Air pressure Barometer mb (millibars)
Cloud cover Satellite or human sight Oktas (0 to 8 eighths)
Precipitation Rain gauge mm (millimetres)
Temperature Thermometer °C (degrees centigrade)
Wind direction Wind vane Compass point that the
wind is coming from (e.g.
north)
Wind speed Anemometer m/s or km/h (metres per
second or kilometres per
hour) or sometimes the
Beaufort scale
Give yourself a mark for
each correct box – how
many points out of 18
did you get?
Extension
- What is
this and
why is it
needed?
Extension
– what do
you think
is held in
this box?
1. Label the image of a weather station.
Which instrument do you think
measures;
a) Temperature (digital thermometer)
b) Wind speed (Anemometer)
c) Wind direction (Wind vane)
d) Rainfall (via a rain gauge)
2. Why do you think that the
thermometers are kept within a slatted
screen?
3. Attempt the extension activities.
Weather Stations – what they are and where to place them
Wind speed
(Anemometer)
This is a
solar
panel to
power the
unit. Ideal
for remote
use.
This is
the data
logger
Rainfall (via a
rain gauge)
Temperature
(digital
thermometer)
inside a well
ventilated
screen.
Wind
direction
(Wind
vane)
1. Label the image of a weather
station. Which instrument do
you think measures;
a) Humidity (Hygrometer)
b) Temperature (digital
thermometer)
c) Wind speed (Anemometer)
d) Wind direction (Wind vane)
e) Rainfall (via a rain gauge)
2. Why do you think that the
thermometers are kept within
a slatted screen?
3. Attempt the extension
activities.
Weather Stations – what they are and where to place them
A school weather station in
the Himalayas
A portable or hand-held
weather station
Different weather
stations around the
world!
The following slides show other ways of gaining
weather data. Whilst looking at the images, discuss…
What can these instruments measure that weather stations can’t?
Observations: Planes
Commercial aircraft routinely carry digital instruments to record weather
conditions on their flight path.
Smaller aircraft can be used to make very detailed observations.
DID YOU KNOW?: During the Corona virus pandemic,
the quality of the weather forecast fell by around 10%
because so much less data from aeroplanes was being
collected.
Observations: Radar instruments on the ground measure rainfall
Image courtesy of MeteoGroup and DTN. Originally published on RainToday.Co.UK.
Image courtesy of Lindsay Bennett, Leeds University
DID YOU KNOW? Weather radar
instruments can detect
migrating insects!
Observations: Ocean based instruments, on buoys and ships, make
measurements at sea
Observations: Satellites collect a huge amount of weather information from around the world
Source: NASA
Satellites look at the world with different sensors:
Visible light
Infrared sensors – this makes a
temperature map. Cloud tops are
cold!
© Crown copyright, Met Office
The British Antarctic Survey – why collect data here? What difficulties might there be?
All images kindly supplied by the British Antarctic Survey
According to the Met Office “Weather station sites are selected to ensure that the
observations are representative of the wider area around the station and not unduly
influenced by local effects.”
For the Met Office, the Ideal site would have the following;
• Level ground.
• No trees; buildings, or steep ground nearby that might influence the measurements.
However, Undesirable sites to avoid would include;
• Warming effect of buildings on the measurement of temperature
• Sheltering or shading effects of trees on the measurement of sunshine and wind.
• Frost hollow where overnight temperatures on still clear nights may be far lower than
at neighbouring locations.
• Top of a hill or steep escarpment where winds will be unrepresentative of the wider
area.
https://www.metoffice.gov.uk/weather/learn-about/how-forecasts-are-made/observatio
ns/weather-stations
Where would you place a
weather station at Reading
University and why?
1
2
3
4
5
TASK
For the 5 sites shown on the map
EVALUATE their site characteristics
for a weather station. Consider
completing a table like the one
below
Site Level ground No trees that influence
measurements
No buildings that influence
measurements
In a Frost Hollow Close to water source
which affects
humidity
measurement
Total
1 Slightly sloping next to
lake bank 3/5
There are trees next to
the lake
1/5
None – 5/5 No, 5/5 Yes – the lake 1/5 15/25
2
3
4
5
1
2
3
4
5
The actual site for the weather station is site 4 – in pairs consider
why this was the best site. Did you select the correct place?
Do the 2 photographs opposite provide more evidence as to why
this area was chosen for a weather station?
Image credits: the University of Reading
Review - Why do we measure the weather?
Look at the rainfall radar for today - at http://www.raintoday.co.uk/
1. What does this animation show?
2. How can we use this information (as a forecast)
EXTENSION
3. How has that data been collected?
4. How accurate is it?
5. Why do we need this information in the UK?
6. What other data could be represented on maps like these?
• OR https://quizlet.com/_8y575t?x=1jqt&i=38anvz
Weather measurements and climate change
1850 2018
1900 1950 2000
How do weather
measurements help our
understanding of climate
change?

2.Weather_measurements_Easier.pptx material

  • 1.
    Thunk Question Thunk question “AThunk question is a…simple-looking question about everyday things that stops you in your tracks and helps you start to look at the world in a whole new light.” https://www.independentthinking.co.uk/thunks/ n.b. Thunk in this sense is not an official word in the Cambridge English Dictionary! Where in the world is there most weather?
  • 2.
    Connect your weatherlearning… Verbally in pairs; 1. Define the term ‘Weather’ 2. Name as many different weather variables as possible 3. Explain how the weather has affected you in the past week Or attempt this Quizlet set - https://quizlet.com/_8y56zy?x=1jqt&i=38anvz
  • 3.
  • 4.
    Weather measurements Objectives 1. Tobe able to describe the weather instruments and units of measurement for various weather variables (e.g. temperature, wind speed, humidity). 2. To evaluate a range of sites for the SUITABILITY to host a weather station. 3. To understand what we do with weather measurements once we have them. Outcomes 1. A completed table of the weather instruments and units of measurement for various weather variables (e.g. temperature, wind speed). 2. An appropriate choice and written reasons for a weather station at the University of Reading. 3. A completed Isotherm map.
  • 5.
    Reminder of keyweather terms and 2 new ones… Air temperature is a measure of how hot or cold the air is. Precipitation is any form of water that falls under gravity from clouds such as drizzle, rain, sleet and snow. Wind is the natural movement of the air, especially in the form of a current of air blowing from a particular direction. Cloud cover is the fraction of the sky obscured by clouds when observed from a particular location. Air Pressure is the force exerted by air on any surface in contact with it. Wind direction is the way the wind is blowing, reported by the direction from which it originates
  • 6.
    Weather measurements - Weathervariables and how we measure them Weather element Instrument Units Image Air pressure Cloud cover Precipitation Temperature Wind direction Wind speed You are to sort out the slips of card so that you can complete the table. There are 6 weather variables. For each variable you need; 1. An instrument 2. The units of measurement 3. An image of what it looks like Once you have sorted out your information slips, complete the table – this could be written or the slips glued down.
  • 7.
    Is your table correct? Weather element InstrumentUnits Image Air pressure Barometer mb (millibars) Cloud cover Satellite or human sight Oktas (0 to 8 eighths) Precipitation Rain gauge mm (millimetres) Temperature Thermometer °C (degrees centigrade) Wind direction Wind vane Compass point that the wind is coming from (e.g. north) Wind speed Anemometer m/s or km/h (metres per second or kilometres per hour) or sometimes the Beaufort scale Give yourself a mark for each correct box – how many points out of 18 did you get?
  • 8.
    Extension - What is thisand why is it needed? Extension – what do you think is held in this box? 1. Label the image of a weather station. Which instrument do you think measures; a) Temperature (digital thermometer) b) Wind speed (Anemometer) c) Wind direction (Wind vane) d) Rainfall (via a rain gauge) 2. Why do you think that the thermometers are kept within a slatted screen? 3. Attempt the extension activities. Weather Stations – what they are and where to place them
  • 9.
    Wind speed (Anemometer) This isa solar panel to power the unit. Ideal for remote use. This is the data logger Rainfall (via a rain gauge) Temperature (digital thermometer) inside a well ventilated screen. Wind direction (Wind vane) 1. Label the image of a weather station. Which instrument do you think measures; a) Humidity (Hygrometer) b) Temperature (digital thermometer) c) Wind speed (Anemometer) d) Wind direction (Wind vane) e) Rainfall (via a rain gauge) 2. Why do you think that the thermometers are kept within a slatted screen? 3. Attempt the extension activities. Weather Stations – what they are and where to place them
  • 10.
    A school weatherstation in the Himalayas A portable or hand-held weather station Different weather stations around the world!
  • 11.
    The following slidesshow other ways of gaining weather data. Whilst looking at the images, discuss… What can these instruments measure that weather stations can’t?
  • 12.
    Observations: Planes Commercial aircraftroutinely carry digital instruments to record weather conditions on their flight path. Smaller aircraft can be used to make very detailed observations. DID YOU KNOW?: During the Corona virus pandemic, the quality of the weather forecast fell by around 10% because so much less data from aeroplanes was being collected.
  • 13.
    Observations: Radar instrumentson the ground measure rainfall Image courtesy of MeteoGroup and DTN. Originally published on RainToday.Co.UK. Image courtesy of Lindsay Bennett, Leeds University DID YOU KNOW? Weather radar instruments can detect migrating insects!
  • 14.
    Observations: Ocean basedinstruments, on buoys and ships, make measurements at sea
  • 15.
    Observations: Satellites collecta huge amount of weather information from around the world Source: NASA Satellites look at the world with different sensors: Visible light Infrared sensors – this makes a temperature map. Cloud tops are cold! © Crown copyright, Met Office
  • 16.
    The British AntarcticSurvey – why collect data here? What difficulties might there be? All images kindly supplied by the British Antarctic Survey
  • 17.
    According to theMet Office “Weather station sites are selected to ensure that the observations are representative of the wider area around the station and not unduly influenced by local effects.” For the Met Office, the Ideal site would have the following; • Level ground. • No trees; buildings, or steep ground nearby that might influence the measurements. However, Undesirable sites to avoid would include; • Warming effect of buildings on the measurement of temperature • Sheltering or shading effects of trees on the measurement of sunshine and wind. • Frost hollow where overnight temperatures on still clear nights may be far lower than at neighbouring locations. • Top of a hill or steep escarpment where winds will be unrepresentative of the wider area. https://www.metoffice.gov.uk/weather/learn-about/how-forecasts-are-made/observatio ns/weather-stations
  • 18.
    Where would youplace a weather station at Reading University and why? 1 2 3 4 5 TASK For the 5 sites shown on the map EVALUATE their site characteristics for a weather station. Consider completing a table like the one below Site Level ground No trees that influence measurements No buildings that influence measurements In a Frost Hollow Close to water source which affects humidity measurement Total 1 Slightly sloping next to lake bank 3/5 There are trees next to the lake 1/5 None – 5/5 No, 5/5 Yes – the lake 1/5 15/25 2 3 4 5
  • 19.
    1 2 3 4 5 The actual sitefor the weather station is site 4 – in pairs consider why this was the best site. Did you select the correct place? Do the 2 photographs opposite provide more evidence as to why this area was chosen for a weather station? Image credits: the University of Reading
  • 20.
    Review - Whydo we measure the weather? Look at the rainfall radar for today - at http://www.raintoday.co.uk/ 1. What does this animation show? 2. How can we use this information (as a forecast) EXTENSION 3. How has that data been collected? 4. How accurate is it? 5. Why do we need this information in the UK? 6. What other data could be represented on maps like these? • OR https://quizlet.com/_8y575t?x=1jqt&i=38anvz
  • 21.
    Weather measurements andclimate change 1850 2018 1900 1950 2000 How do weather measurements help our understanding of climate change?

Editor's Notes

  • #6 Frasmacon CC BY-SA Valentin de Bruyn / Coton CC BY-SA Rolf Gebhardt CC BY-SA 3.0
  • #12 Images copyright Andrew McGrath/ Airborne Research Australia
  • #13 Images copyright Lindsay Bennett/ Meteogroup
  • #14 Images copyright Helen Johnson/ British Antarctic Survey
  • #15 Images copyright NASA and ECMWF
  • #18 Image source: Google Maps with CNES / Airbus, Getmapping pls, Infoterra Ltd & Bluesky, Landsat / Copernicus, Maxar Technologies
  • #19 Image source: Google Maps with CNES / Airbus, Getmapping pls, Infoterra Ltd & Bluesky, Landsat / Copernicus, Maxar Technologies