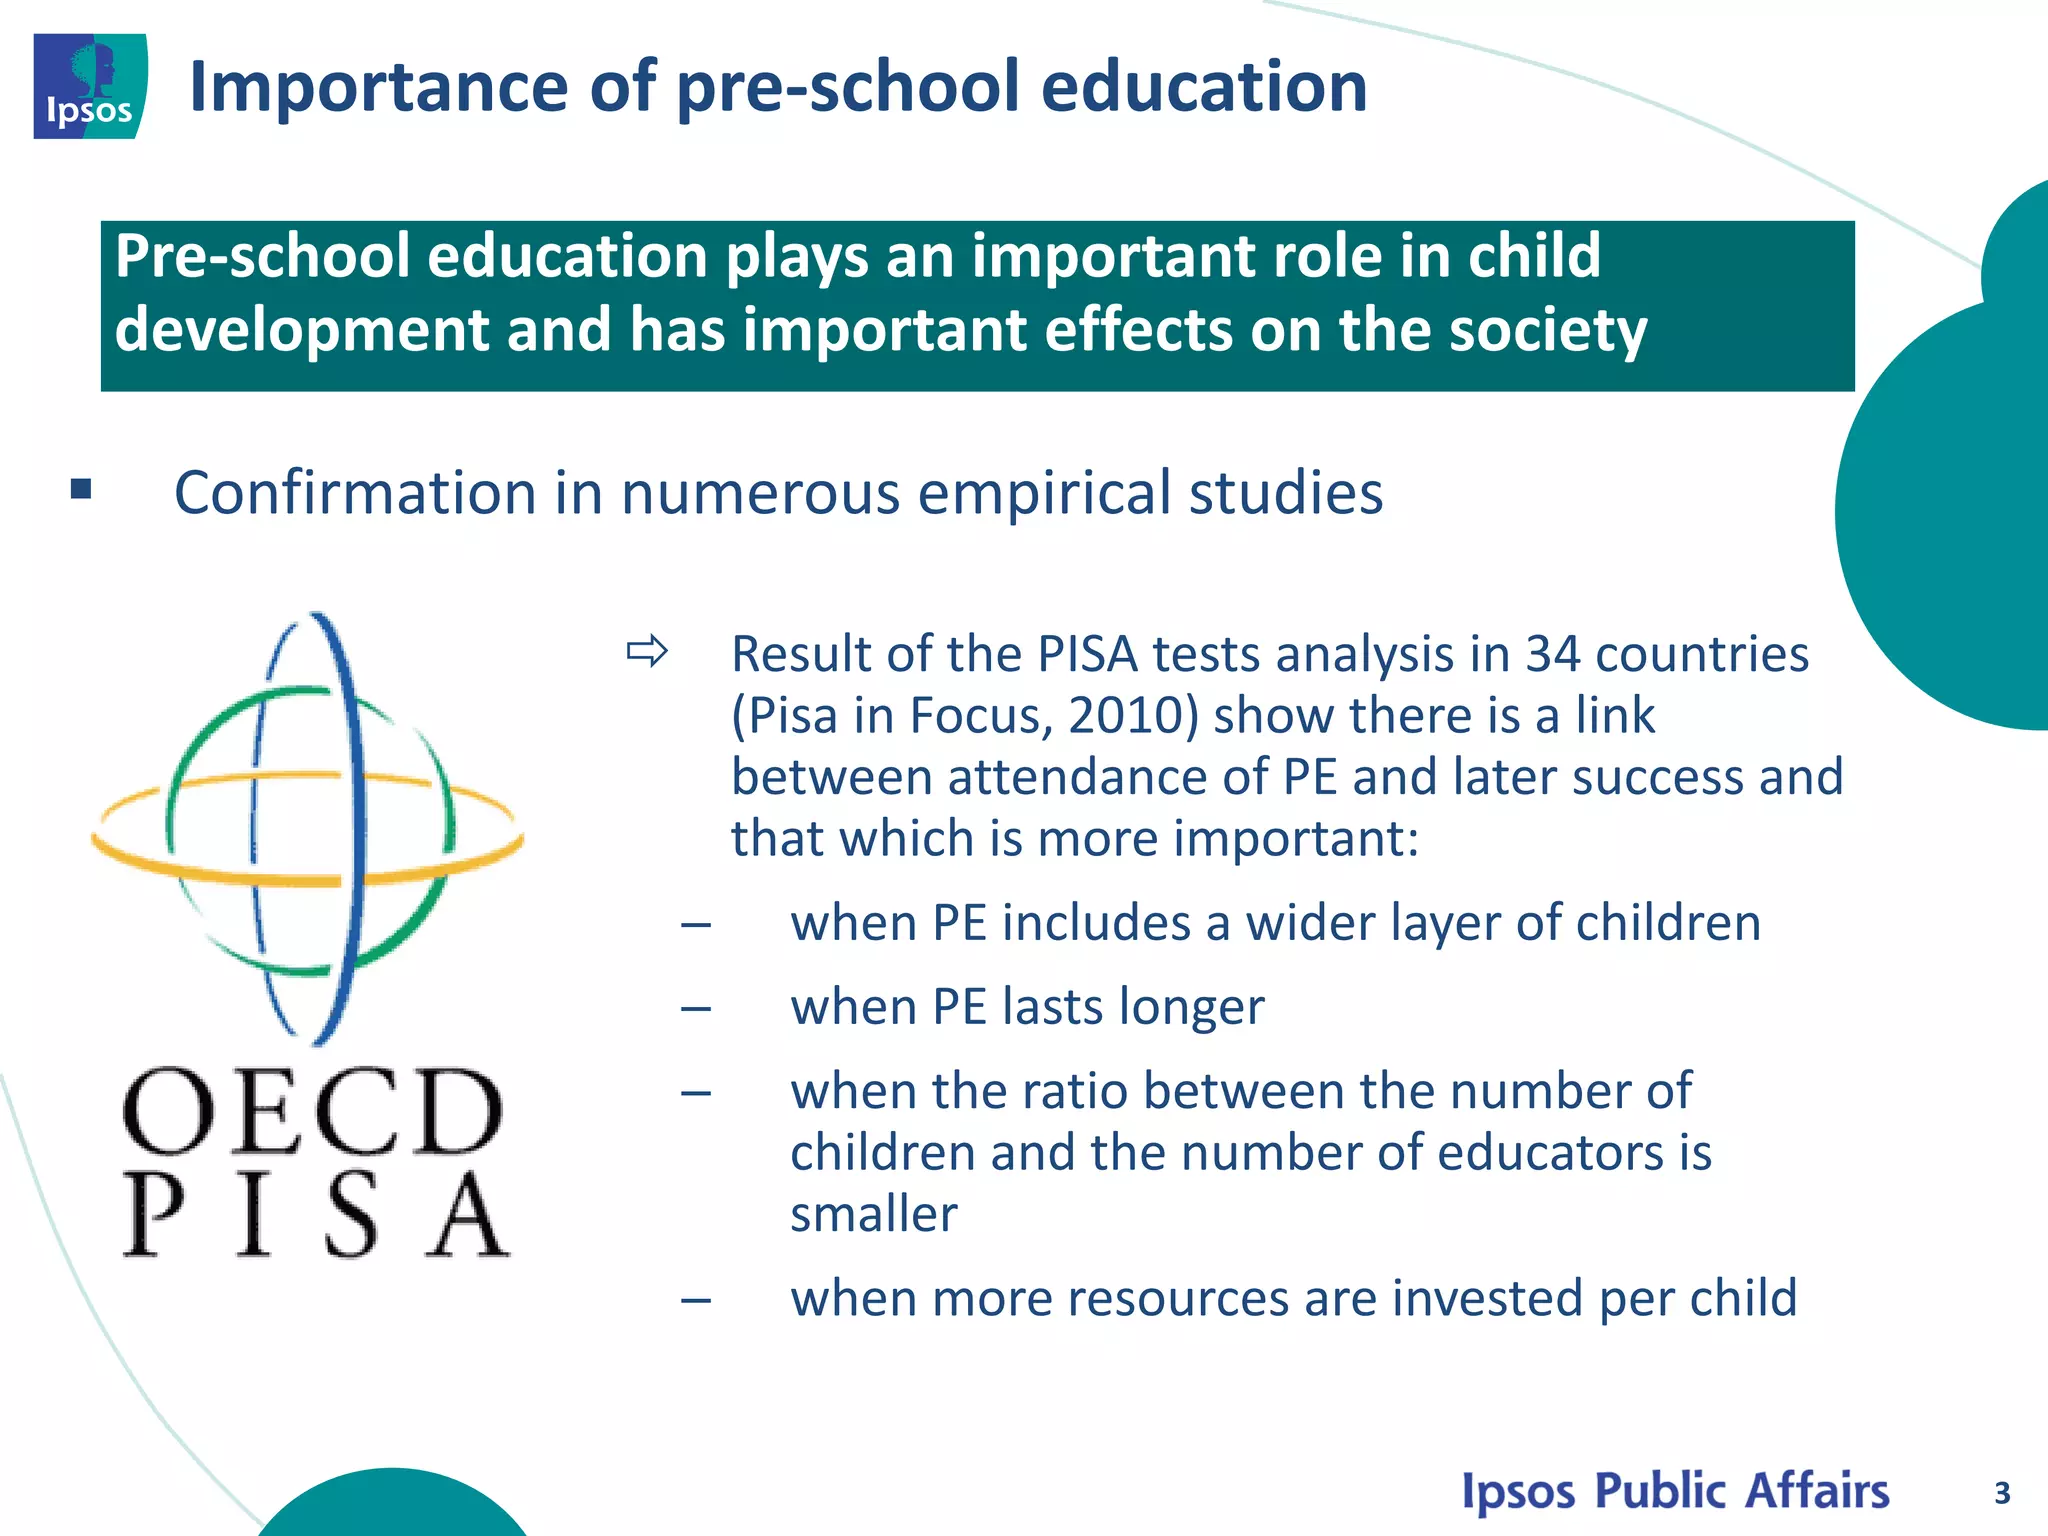
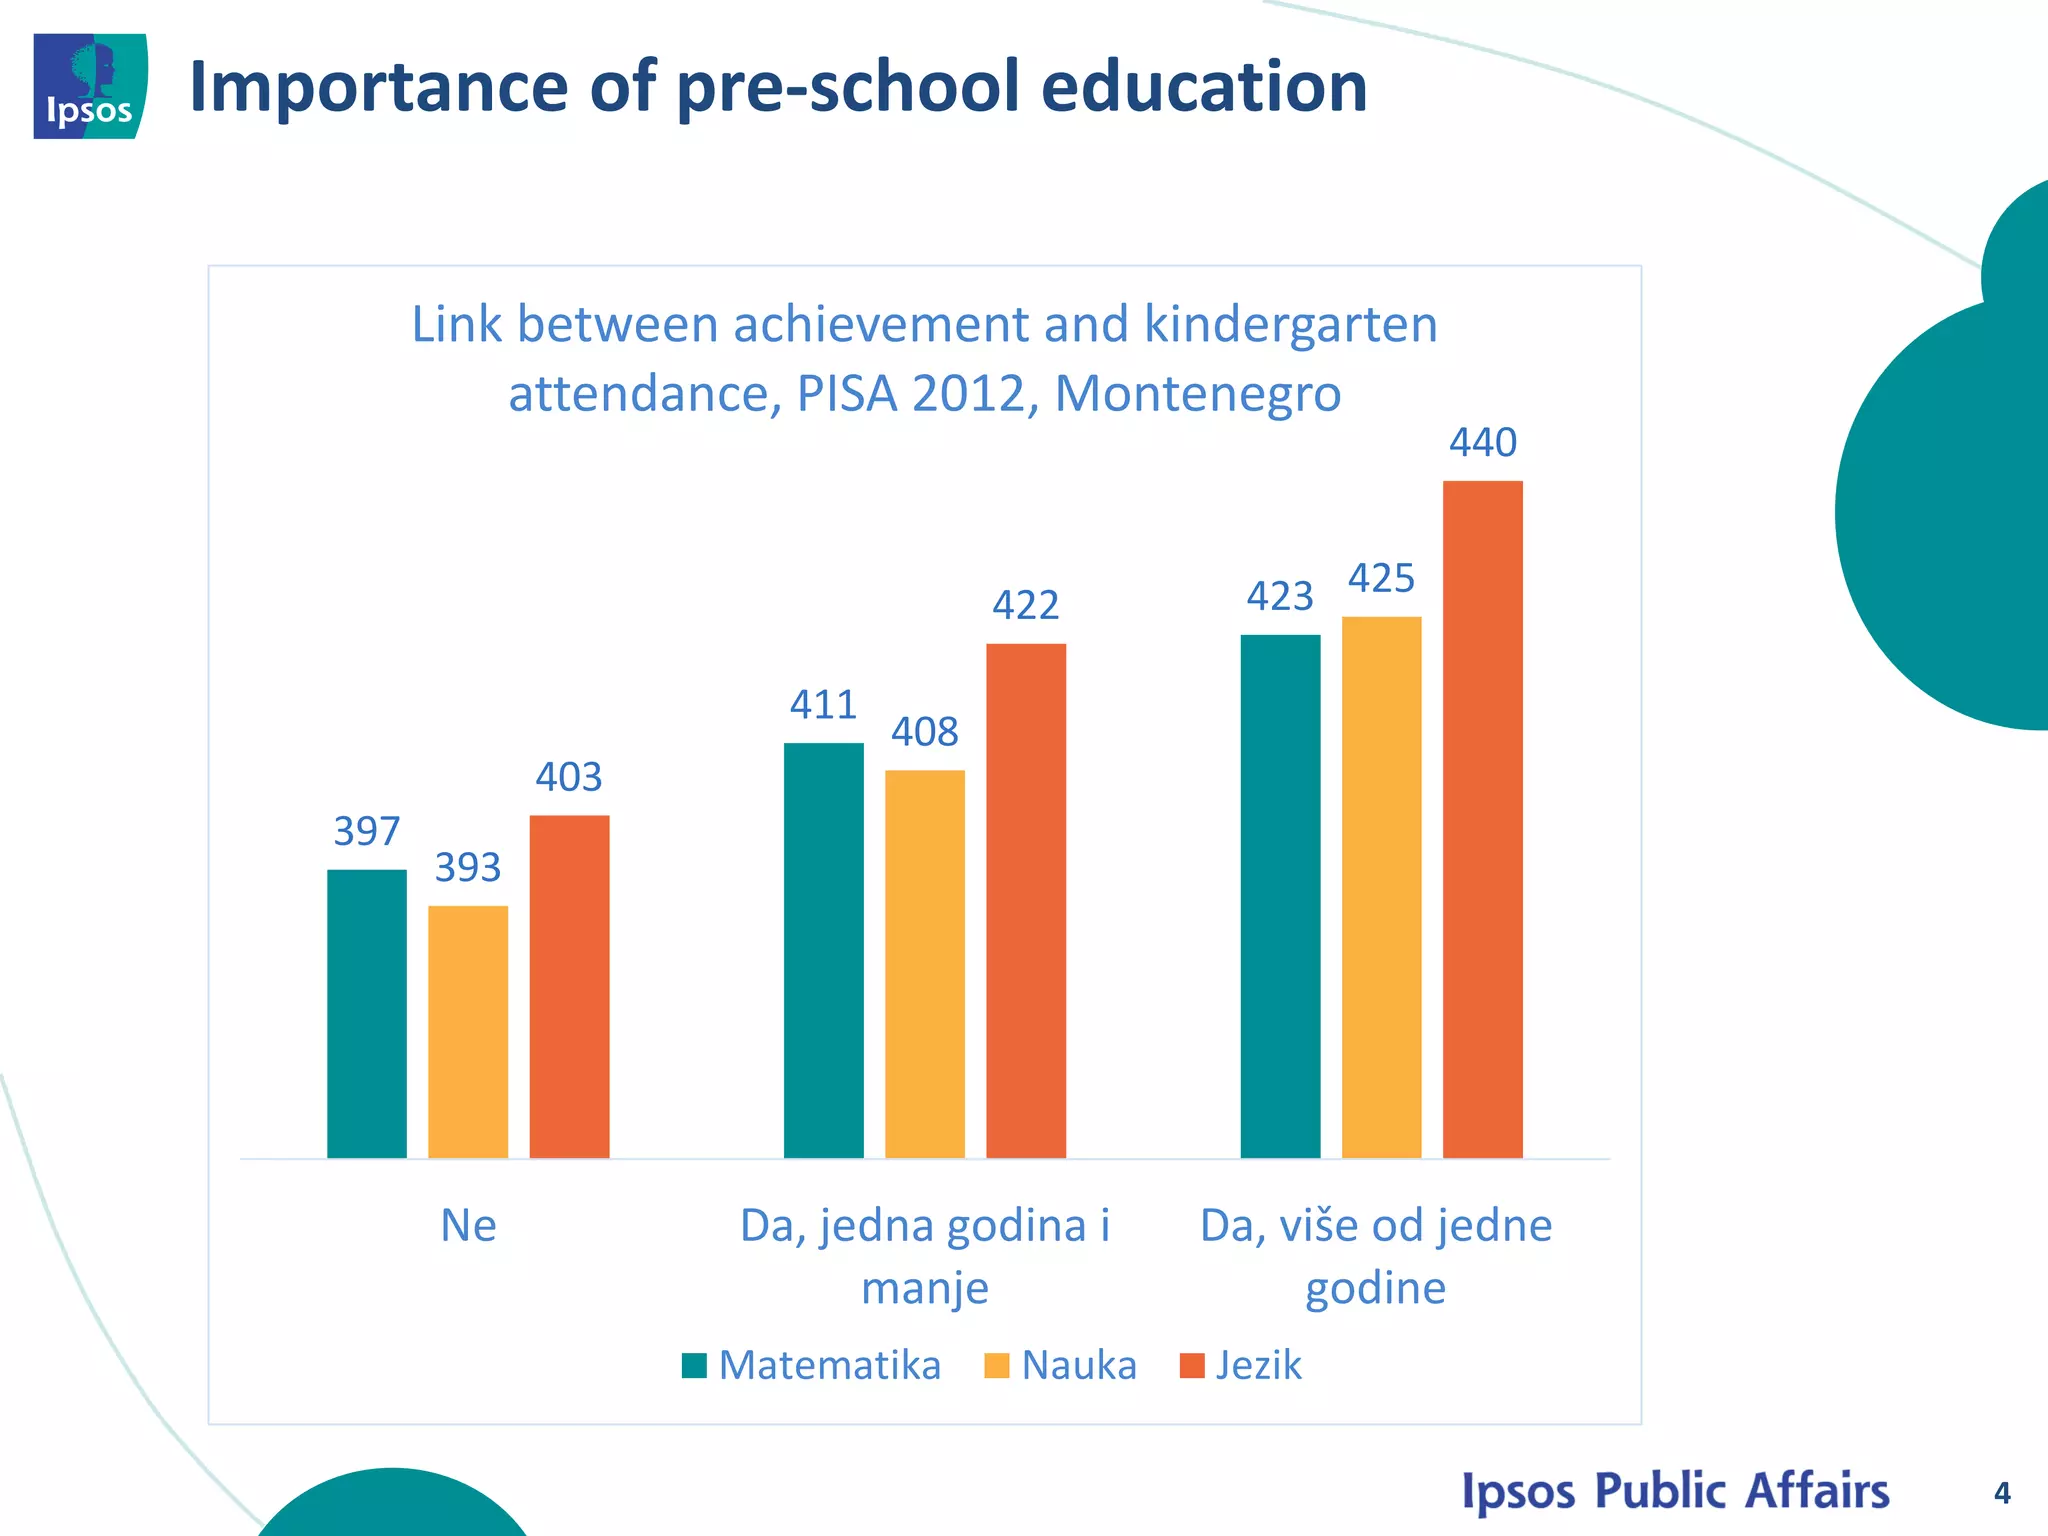
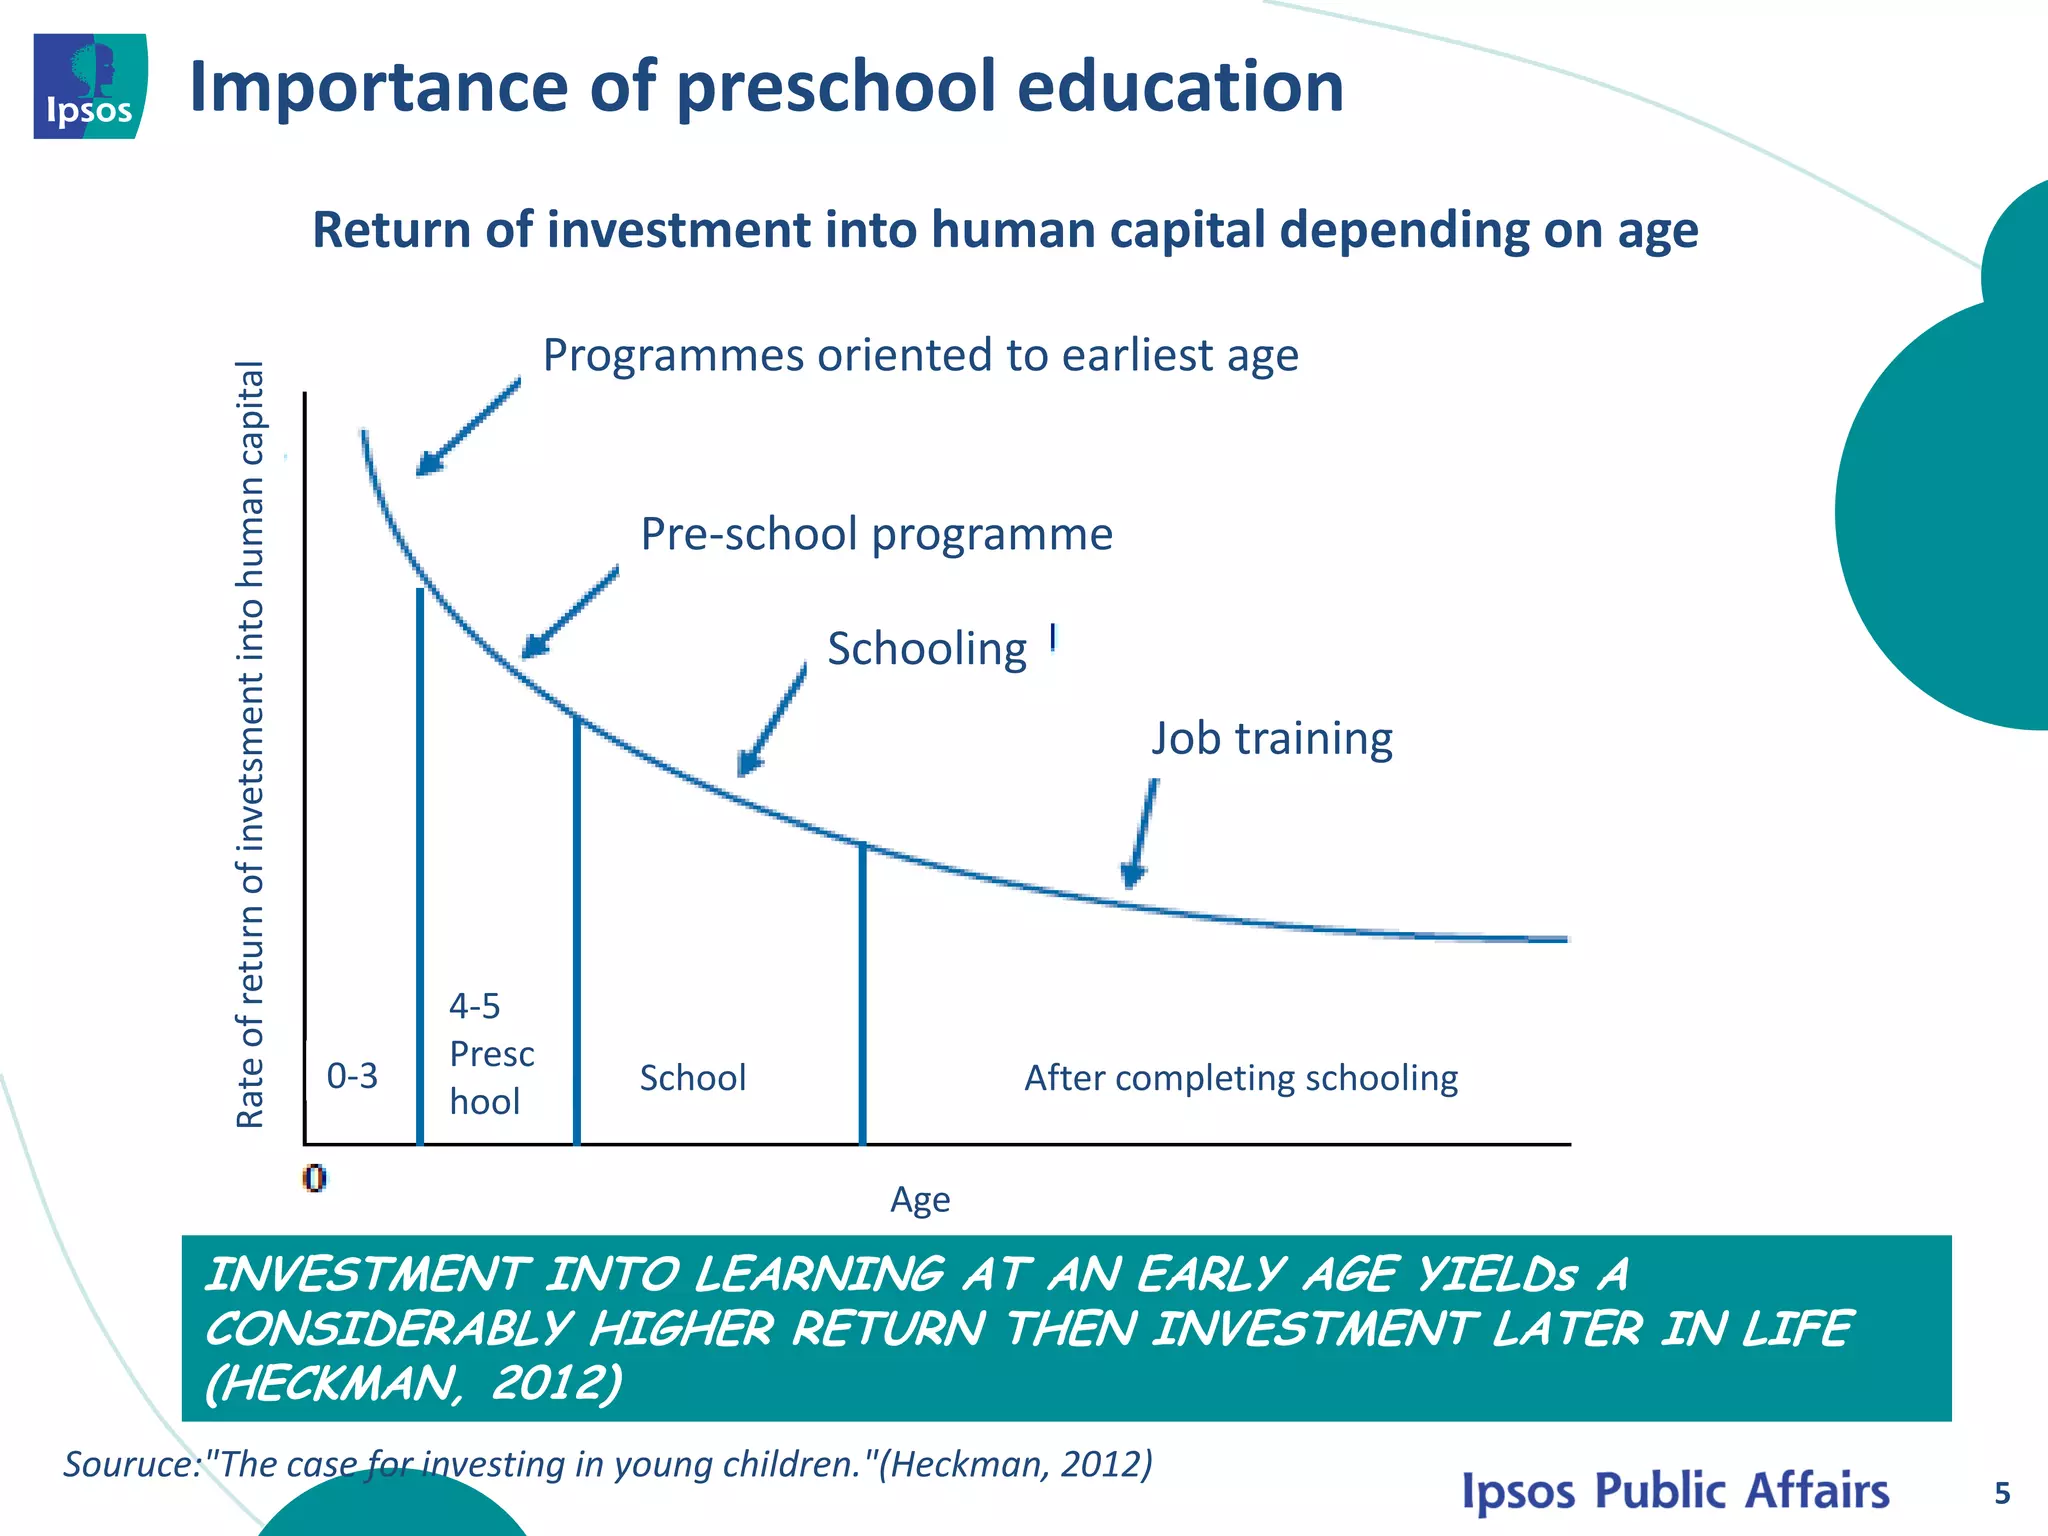
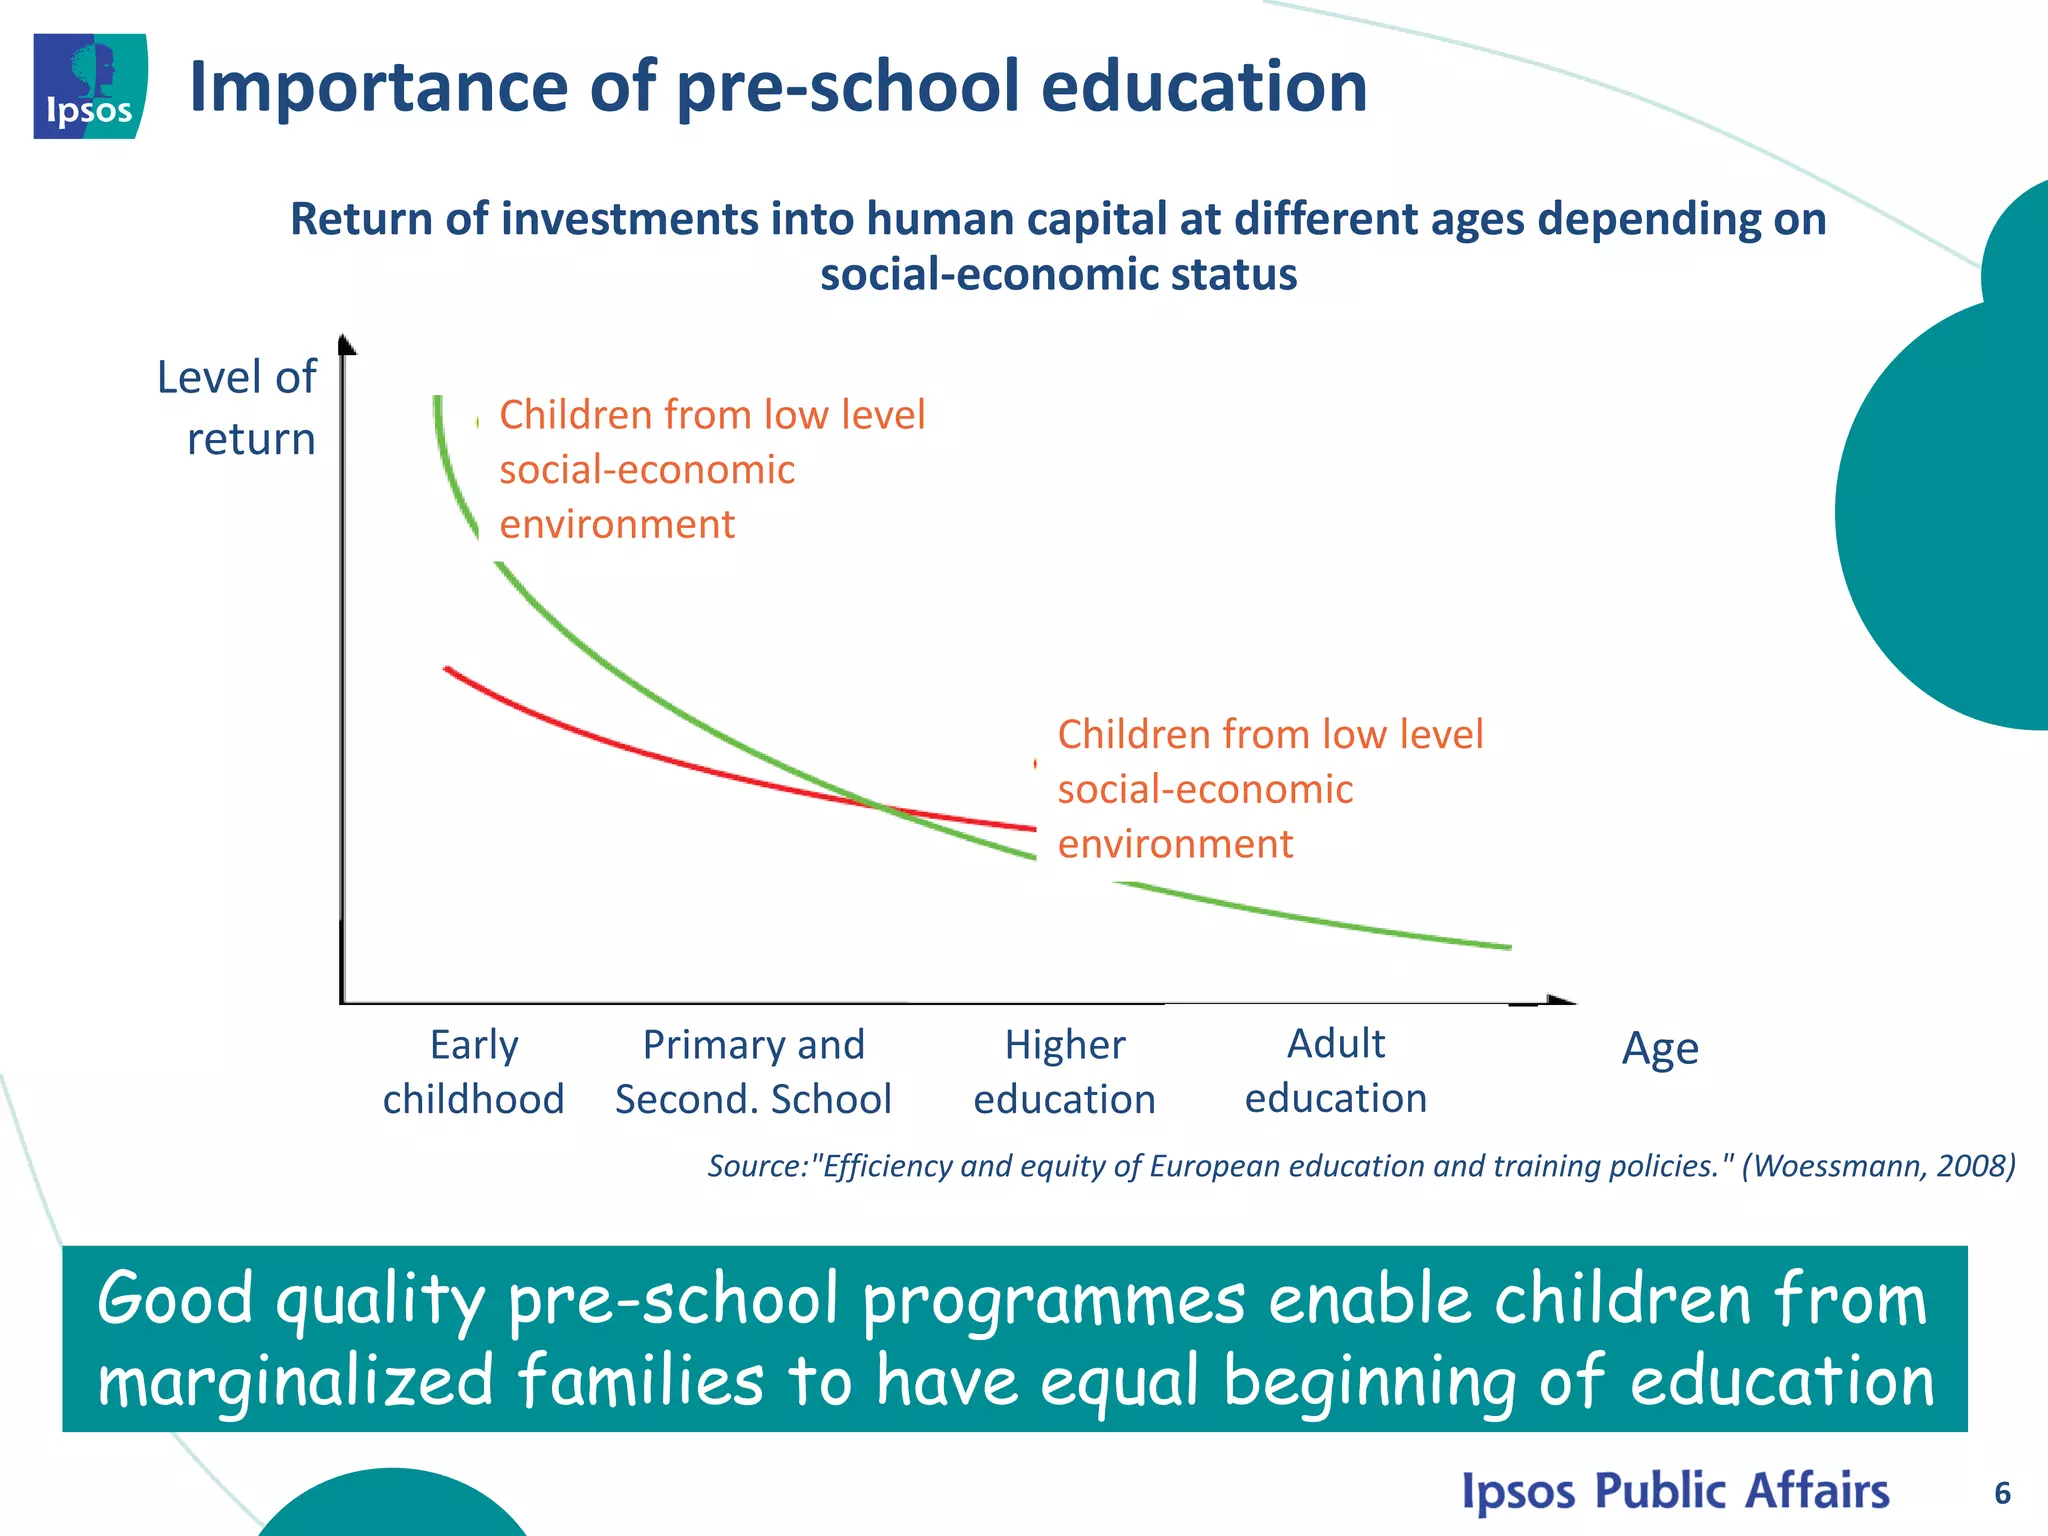
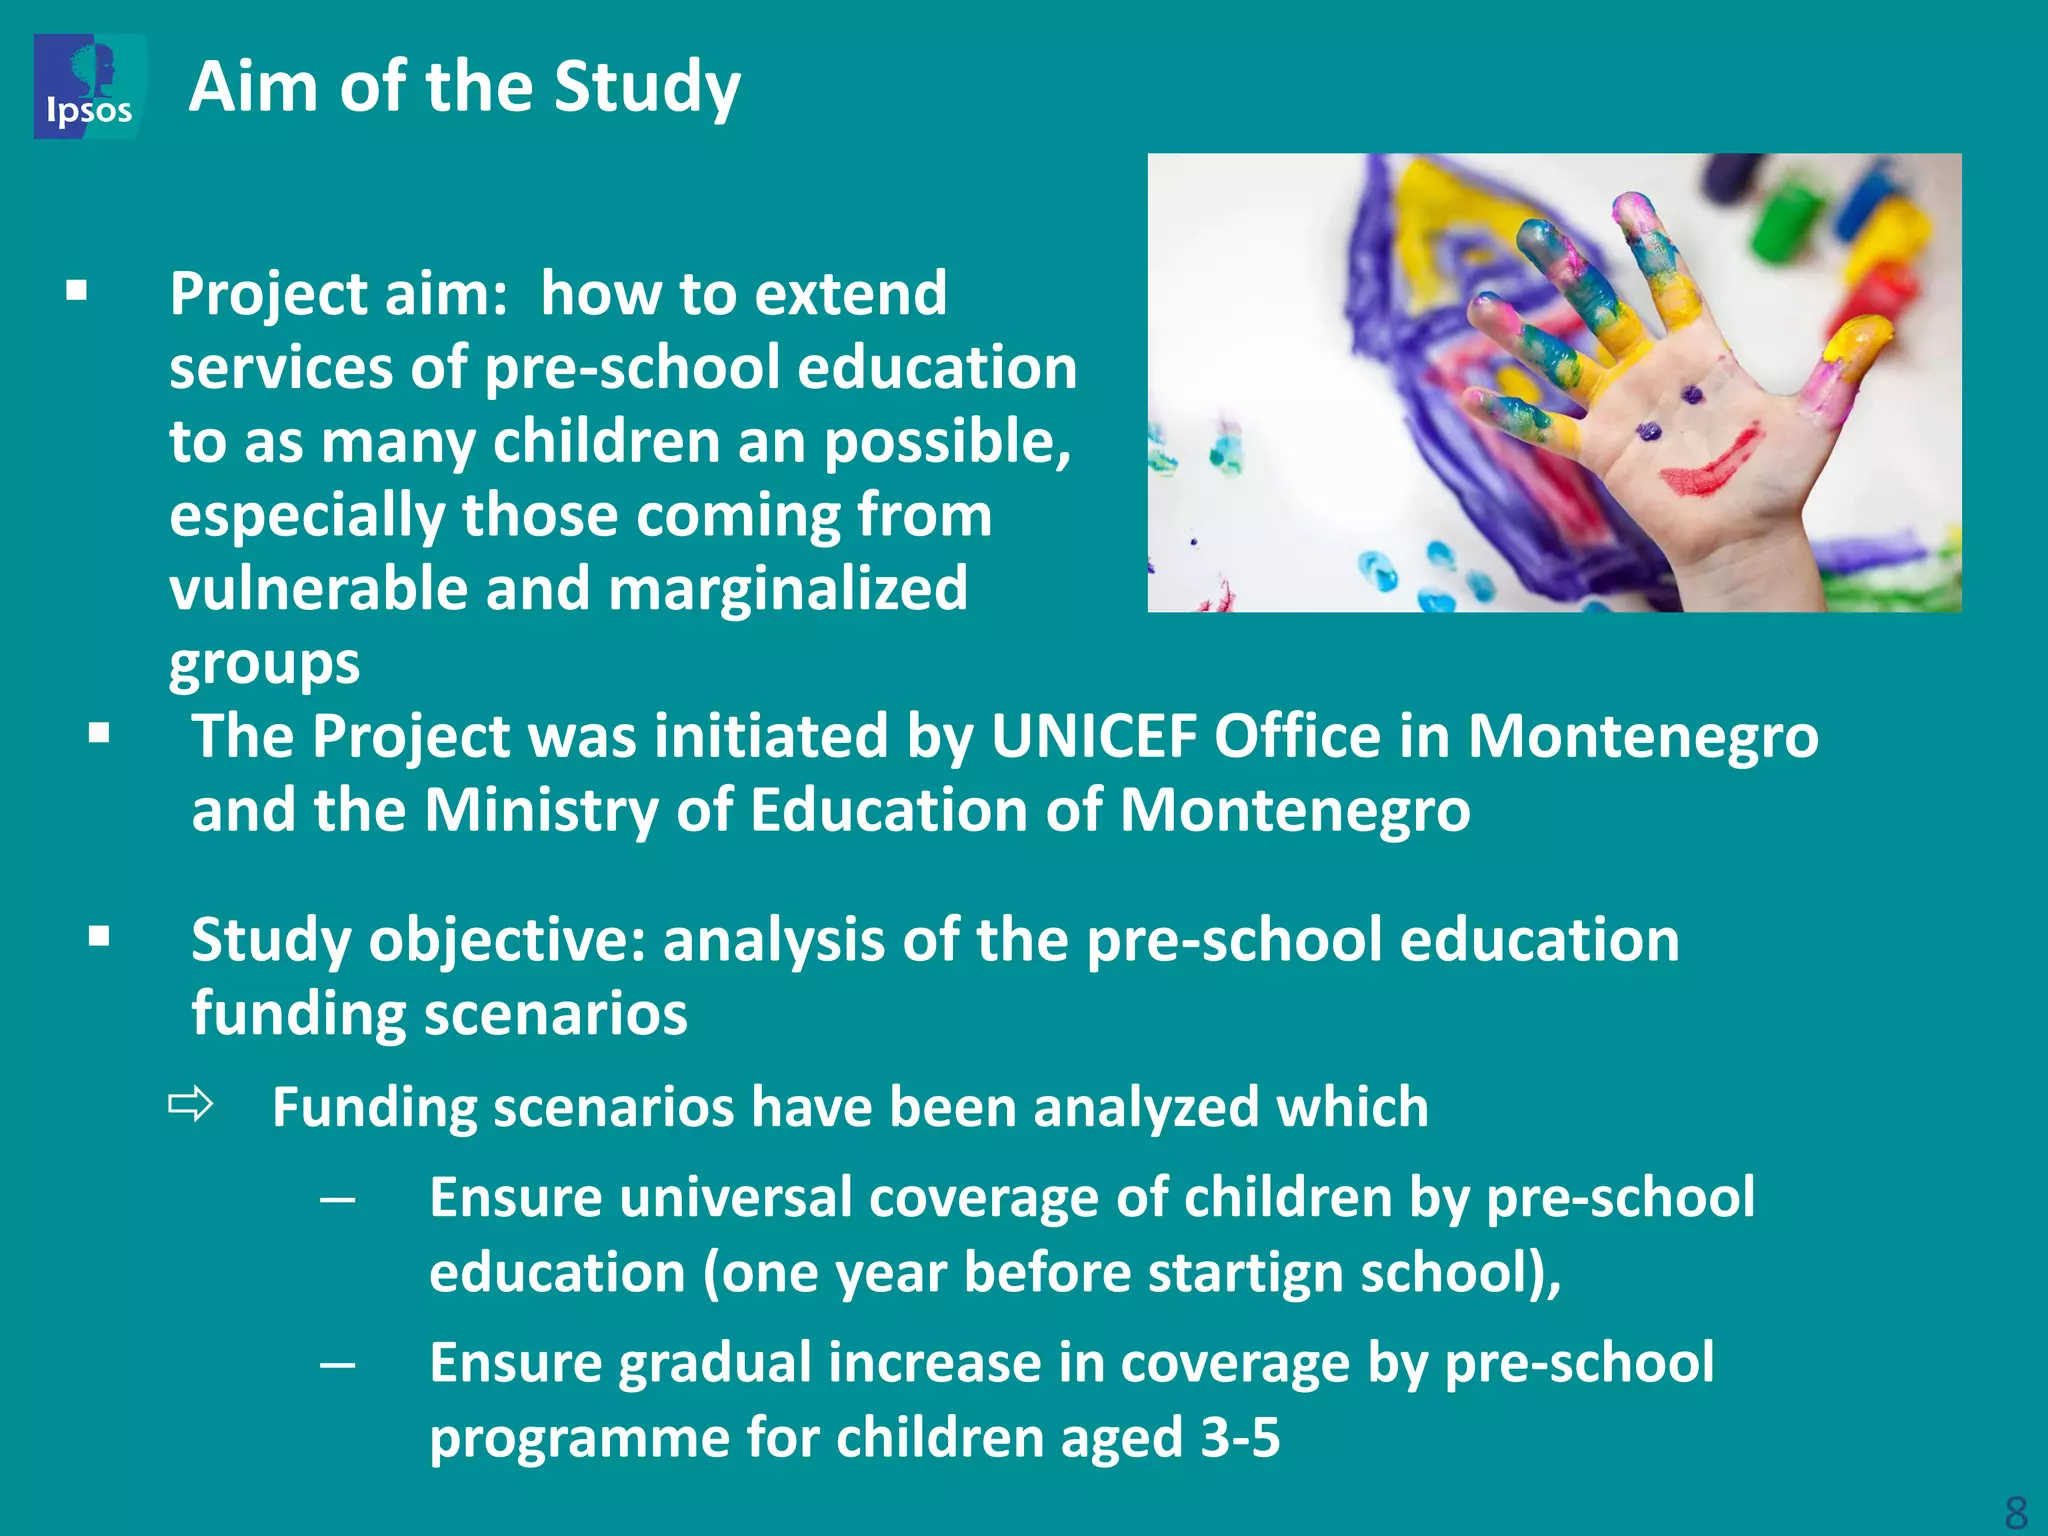
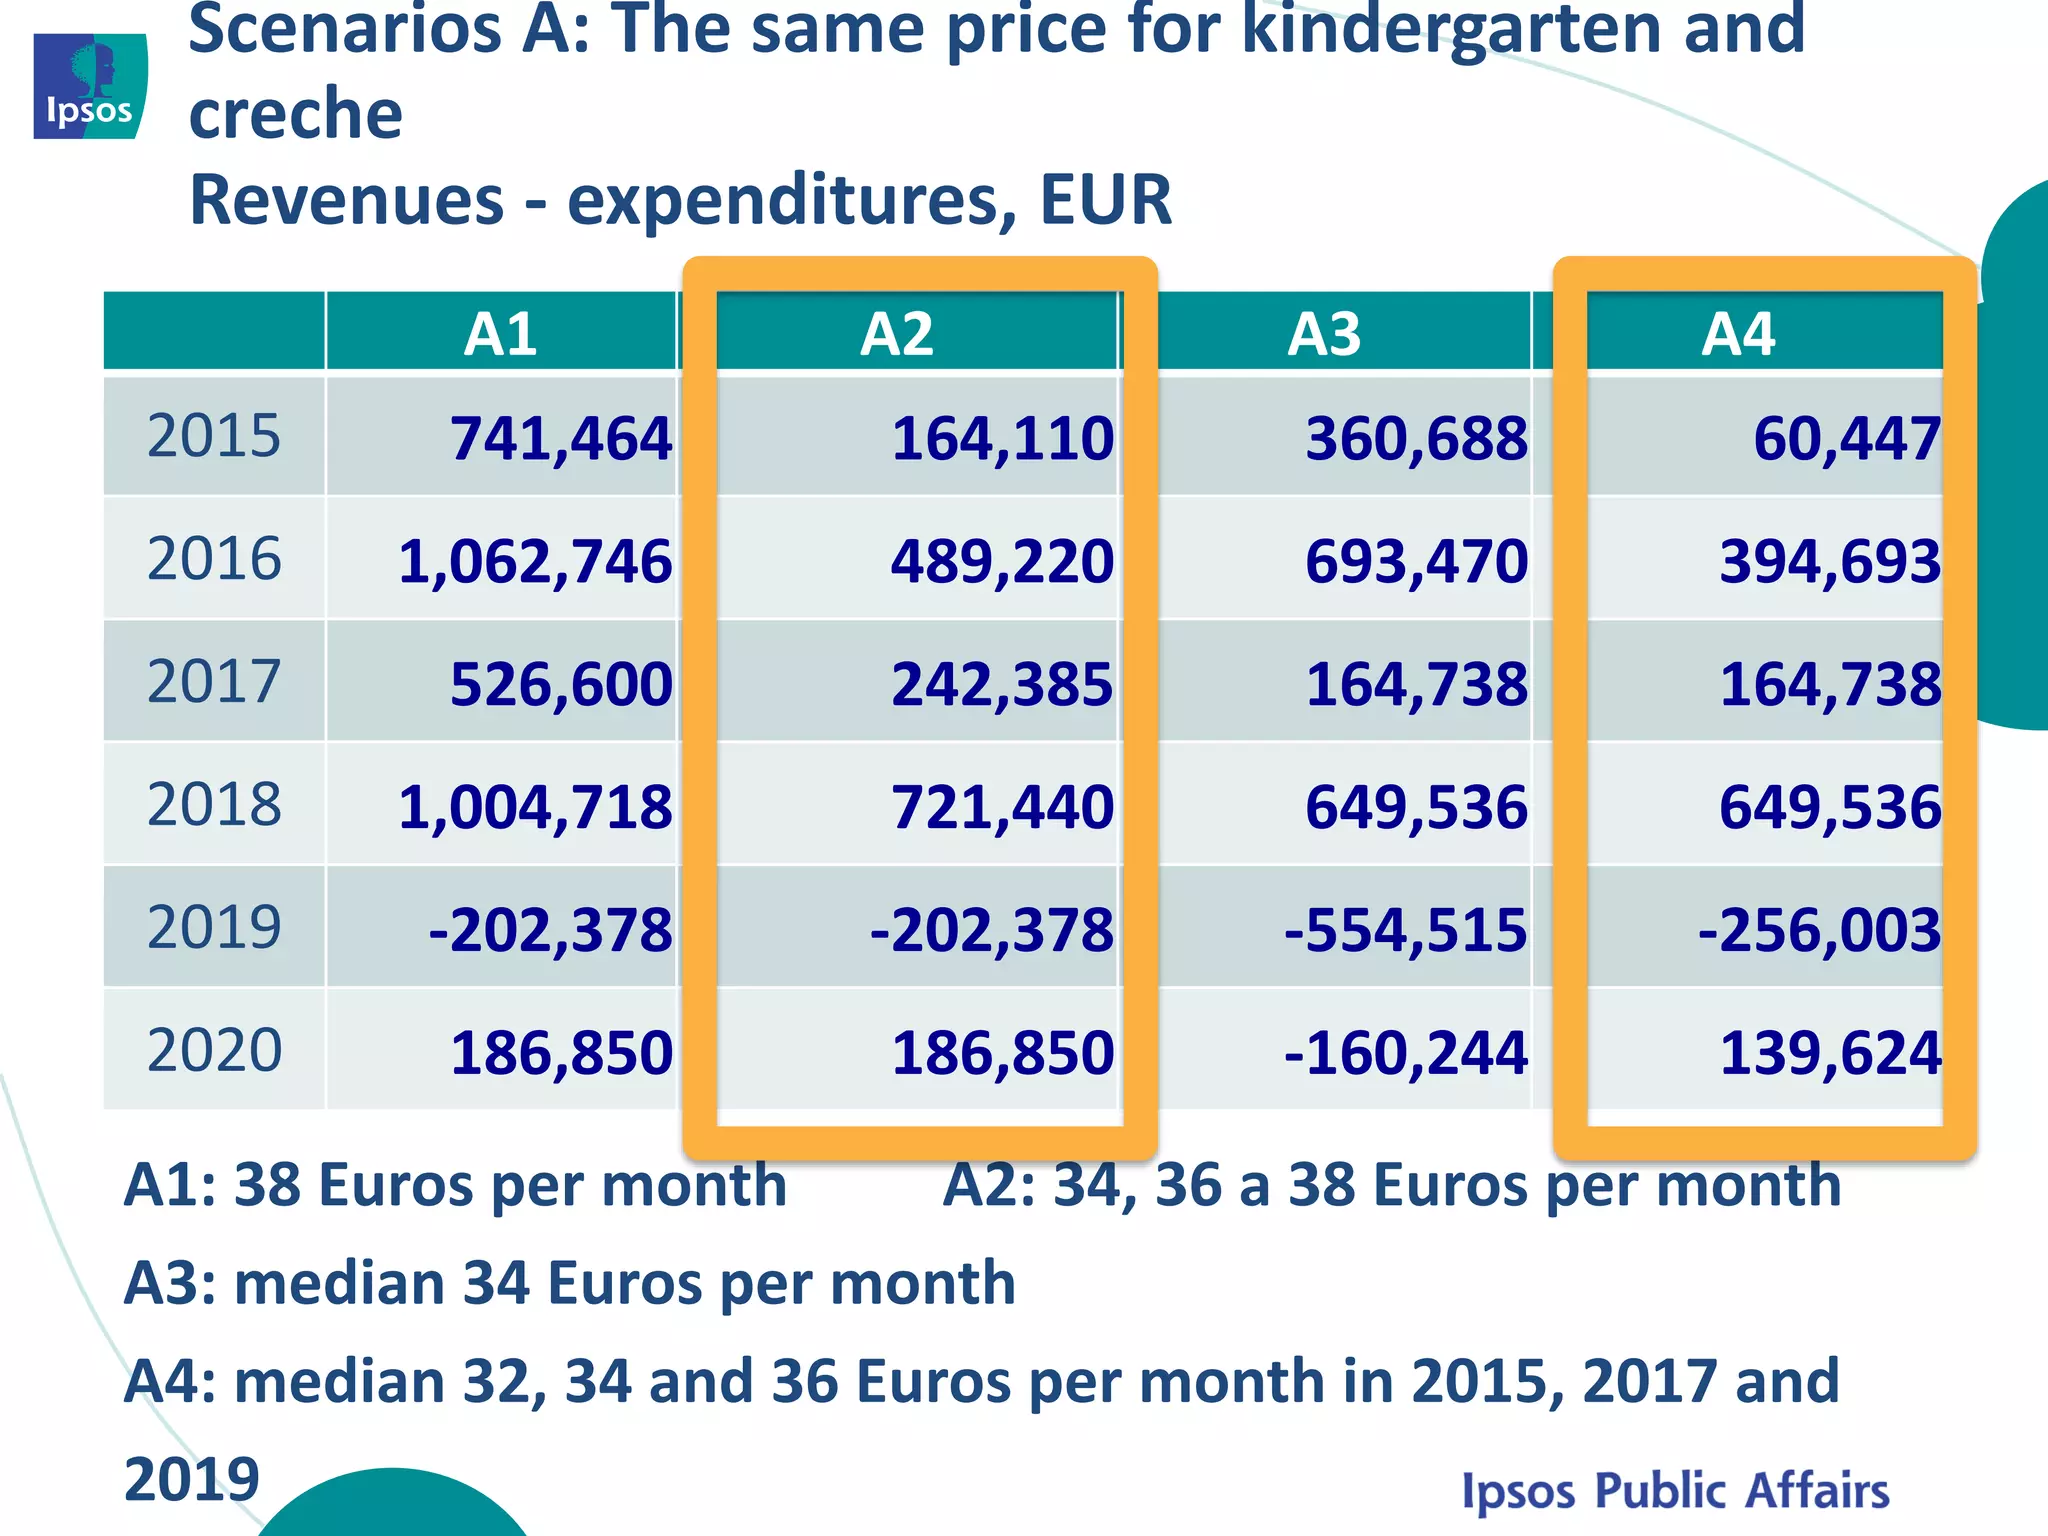
Let us Open the
Door to Equal
Opportunities
Study on Investment in
Early Child Education in
Montenegro
Ivana Prica
Lazar Čolić
Hana Baronijan
Importance of pre-
school education
Importance of pre-school education
3
 Confirmation in numerous empirical studies
Pre-school education plays an important role in child
development and has important effects on the society
djece
 Result of the PISA tests analysis in 34 countries
(Pisa in Focus, 2010) show there is a link
between attendance of PE and later success and
that which is more important:
─ when PE includes a wider layer of children
─ when PE lasts longer
─ when the ratio between the number of
children and the number of educators is
smaller
─ when more resources are invested per child
Importance of pre-school education
4
397
411
423
393
408
425
403
422
440
Ne Da, jedna godina i
manje
Da, više od jedne
godine
Link between achievement and kindergarten
attendance, PISA 2012, Montenegro
Matematika Nauka Jezik
Return of investment into human capital depending on age
5
Schooling
Pre-school programme
Job training
4-5
Presc
hool
School After completing schooling
Age
Inicijalno postavljene stope povraćaja ulaganja u ljudski kapital jednake po uzrastima
Rateofreturnofinvetsmentintohumancapital
Programmes oriented to earliest age
0-3
Souruce:"The case for investing in young children."(Heckman, 2012)
INVESTMENT INTO LEARNING AT AN EARLY AGE YIELDs A
CONSIDERABLY HIGHER RETURN THEN INVESTMENT LATER IN LIFE
(HECKMAN, 2012)
Importance of preschool education
Return of investments into human capital at different ages depending on
social-economic status
6
Level of
return
Children from low level
social-economic
environment
Children from low level
social-economic
environment
Early
childhood
Primary and
Second. School
Higher
education
Adult
education
Age
Source:"Efficiency and equity of European education and training policies." (Woessmann, 2008)
Good quality pre-school programmes enable children from
marginalized families to have equal beginning of education
Importance of pre-school education
7
 In a number of countries there has been a change in the
role of PE from primary role of keeping children safe to
the function of educating children
 Montenegro has recognized the importance of pre-school
education and upbringing and there is programme base
for extending it
 „By 2020 a minimum of 95% of children between the age of
4 and the age when obligatory primary education begins
should participate in the early education programmes”
(Europe 2020)
To provide for all the children in Montenegro, from birth until
the time when they start primary school, good quality services
for early development and learning so that they reach their
full potential and become active and productive members of
the society”
Strategiy of Early Pre-school education and upbringing for
the period 2010 to 2015
Aim of the Study
 Project aim: how to extend
services of pre-school education
to as many children an possible,
especially those coming from
vulnerable and marginalized
groups
8
 Study objective: analysis of the pre-school education
funding scenarios
 Funding scenarios have been analyzed which
– Ensure universal coverage of children by pre-school
education (one year before startign school),
– Ensure gradual increase in coverage by pre-school
programme for children aged 3-5
 The Project was initiated by UNICEF Office in Montenegro
and the Ministry of Education of Montenegro
On the other side, many parents in Montenegro are not
familiar with the development role of pre-school institutions
Children coverage is not high.
On one side it is necessary to familiarize parents through a
campaign with the benefits of pre-school education, and on the
other to provide conditions for all children to attend pre-school
education
 ¼ of parents think a child is better off at home, without considering the
benefits of PE attendance for child development
„Assessment of knowledge, views and behaviour related to the care of children”, UNICEF, 2009, Montenegro
The state of pre-school education in Montenegro
 Coverage of children from 0 to 6 years of age: 33,2% or 15.604 of
children
 Coverage of children 3 to 6 years of age: 52.4% or 11.641 children
 Coverage varies depending on the age of children and the territory
 Numerous pre-school institutions operate beyond their capacities:
3.377 or 30% of surplus children aged 3-6
The state of pre-school education in Montenegro
The relation between the degree of a municipality development and degree
of coverage of children by PE, Montenegro, 2012
Assessment of costs of
introducing pre-school
preparatory
programme with
general coverage
Introducing preparatory pre-school programme (PPP)
 Recognized importance of pre-school education and long-
term benefits of general coverage
 Pre-school preparatory programme (PPP)
 3 hours per day, 5 days per week and 10 months per year, so
that every child has at least 600 hours of PPP per year;
 Cover all the children who have:
– One year before starting school in 2015,
– Two years before starting school in 2017, and
– Three years before starting school in 2019;
 PPP is free
 Provides one meal (light meal)
Total costs of pre-school education (PE), 2015-20, EUR
Primary
programmes
costs
PPP costs for
children who do
not attend PE
Total costs
of PE
Share of PPP
in total costs
2015 16.963.657 989.243 17.952.900 6%
2016 16.876.707 1.034.122 17.910.829 6%
2017 16.719.488 2.033.033 18.752.521 11%
2018 16.679.920 1.955.438 18.635.358 10%
2019 16.814.183 3.461.938 20.276.121 17%
2020 16.870.884 3.433.725 20.304.610 17%
PE costs and budget expenditures for PE, 2015-20, EUR
PE costs
Budget expenditures
for PE (3,8% GDP)
Costs–
budg. expend.
2015 17.952.900 13.209.506 4.743.394
2016 17.910.829 13.525.081 4.385.748
2017 18.752.521 13.879.032 4.873.489
2018 18.635.358 14.257.791 4.377.567
2019 20.276.121 14.646.886 5.629.235
2020 20.304.610 15.046.600 5.258.010
Scenarios of funding the remaining costs from
compensations paid by parents
 Currently parents are paying 40 and 20 Euros per month, i.e. 1,8
and 0,9 Euros per day
 Compensation for half a day is always 1/2 of the compensation
for full day primary programme
 Options:
The same compensation for crèche and kindergarten or
higher compensation for crèche in relation to kindergarten
Compensation is not changed during 2015-20 or
compensation increases in 2017 and 2019
Compensation is realized 100% or is realized only 80%
Compensation is the same or different per municipalities….
Model of different compensations per municipalities:
20% higher in municipalities with a high rate of coverage:
Budva, Tivat, Kotor, Herceg Novi and Cetinje
Average (median) for municipalities with the average rate
of coverage:
Podgorica, Kolašin, Danilovgrad, Bar, Pljevlja and
Žabljak, Nikšić, Mojkovac, Ulcinj and Plav
20% lower in municipalities with a low rate of coverage:
Bijelo Polje, Berane, Šavnik, Andrijevica, Plužine and
Rožaje
Scenarios of funding the remaining costs from
compensations paid by parents
A. The same price for kindergarten and crèche
B. Different price for kindergarten and crèche
C. Compensation is paid for attendance rate of up to 80%.
Scenarios A: The same price for kindergarten and
creche
Revenues - expenditures, EUR
A1 A2 A3 A4
2015 741,464 164,110 360,688 60,447
2016 1,062,746 489,220 693,470 394,693
2017 526,600 242,385 164,738 164,738
2018 1,004,718 721,440 649,536 649,536
2019 -202,378 -202,378 -554,515 -256,003
2020 186,850 186,850 -160,244 139,624
A1: 38 Euros per month A2: 34, 36 a 38 Euros per month
A3: median 34 Euros per month
A4: median 32, 34 and 36 Euros per month in 2015, 2017 and
2019
Scenarios B: Compensation for crèche higher than
for kindergarten
Revenues- expenditures, EUR
B1 B2 B3 B4
2015 366,778 587,899 572,726 272,486
2016 693,666 912,280 907,628 608,851
2017 163,519 379,284 380,075 344,185
2018 644,441 858,959 866,083 829,992
2019 -566,385 -349,841 -336,730 -110,812
2020 -178,108 39,069 58,763 285,629
B1: 40 full day crèche and 34 kindergrat B2: 40 full day creche and 36
kindergarten
B3: median 40 full day creche and 34 kidergarten
B4: median for full day creche 38, 39 and 40, and 32, 34 and 36
Scenarios C: 80% of compensation is charged from
parents
Revenues - expenditures, EUR
C1 C2 C3
2015 -124,567 568,258 587,899
2016 202,458 890,688 912,280
2017 -326,045 356,071 379,284
2018 154,883 834,751 858,959
2019 -1,059,250 -373,753 -349,841
2020 -672,865 14,907 39,069
C1: 40 Euros per month for full day programme
C2: 46 Euros per month for full day programme
C3: 50 Euros for full day crèche and 45 Euros for kindergarten
Scenarios C: 80% of compensation is charged from
parents
Revenues - expenditures, EUR
C4 C5 C6
2015 106,375 540,832 60,447
2016 431,868 872,737 355,002
2017 128,699 342,557 105,464
2018 608,128 826,963 590,393
2019 -373,753 -375,408 -375,408
2020 19,677 19,677 16,534
C4: 42, 44 and 46 Euros per month for full day programme
C5: median 44 Euros per month for full day programme
C6: median is 40, 42 and 46 Euros per month for full day
programmes in 2015, 2017 and 2019
Main findings
In scenario C the rate of collection of 80% causes an
increase in the amount of compensation to be paid by
parents by around 20%
In general programmes where compensation is changed
over the years are more efficient
Of all A scenarios, scenario A4 shows the lowest difference
between total revenues and total expenditures, followed by
scenario A2
Of all B scenarios, scenario B4 results in the lowest difference
between revenues and expenditures and thus is more
superior
Of all C scenarios, scenarios C4 and C6 show the lowest
degree of aberration of revenues from costs
Besides the above quoted, the choice of the scenario
depends also on the compensation to be paid in those
scenarios…
Municipalities 2015 2017 2019
Compen.per scenario A2 34 36 38
Compen.per
scenario A4
Higher coverge 38 41 43
Average coverage 32 34 36
Low coverage 26 27 29
Compen.per scenario C4 42 44 46
Compen. per
scenario C6
High coverage 48 50 53
Average coverage 40 42 44
Low coverage 32 34 35
Monthly compensations for full day programmes, EUR
Monthly compensations for full day programme in
scenario B4, EUR
Minicipalities
with higher
cover.
Minicipalities
with average
cover.
Minicipalitie
s with low
cover.
2015 creche 46 38 30
kindergar. 38 32 26
2017 creche 47 39 31
kindergar. 41 34 27
2019 creche 48 40 32
kindergar. 43 36 29
24
Conclusions
The costs of PPP make up 6%-17% of total costs PE
The budget covers 75% of total costs of PE for 2015-2020
The remaining amount would be paid by parents through
compensation, in accordance with the proposed scenarios
The amount of compensation in different scenarios varies
depending on:
year of programme implementation;
weather crèche or kindergarten is concerned;
weather a municipality with average, lower or higher rate of
children converge by PE is concerned, and, the key factor is
rate of collection of compensations by the parents.
Conclusions
Scenarios that cover the costs of PE most efficiently are
scenarios A2, A4, B4, C4 and C6.
The selection, in ideal case of one of these 5 scenarios, will
depend on concrete circumstances and the needs of
decision makers:
The basic issue is that of degree of collection of
compensations from parents
One of the factors affecting the selection of the scenario is
also the amount of compensation paid by parents in different
scenarios
At the same time it must be taken into account that degree of
realization of compensations from parents has an opposite
effect on the general level of compensations to be paid by the
parents – the lower the rate of collection the higher the total
compensation to be paid by parents.
Thank you for your attention!
27

Study on Investment in Early Child Education in Montenegro - Ivana Prica, IPSOS Srategic Marketing

  • 1.
    Let us Openthe Door to Equal Opportunities Study on Investment in Early Child Education in Montenegro Ivana Prica Lazar Čolić Hana Baronijan
  • 2.
  • 3.
    Importance of pre-schooleducation 3  Confirmation in numerous empirical studies Pre-school education plays an important role in child development and has important effects on the society djece  Result of the PISA tests analysis in 34 countries (Pisa in Focus, 2010) show there is a link between attendance of PE and later success and that which is more important: ─ when PE includes a wider layer of children ─ when PE lasts longer ─ when the ratio between the number of children and the number of educators is smaller ─ when more resources are invested per child
  • 4.
    Importance of pre-schooleducation 4 397 411 423 393 408 425 403 422 440 Ne Da, jedna godina i manje Da, više od jedne godine Link between achievement and kindergarten attendance, PISA 2012, Montenegro Matematika Nauka Jezik
  • 5.
    Return of investmentinto human capital depending on age 5 Schooling Pre-school programme Job training 4-5 Presc hool School After completing schooling Age Inicijalno postavljene stope povraćaja ulaganja u ljudski kapital jednake po uzrastima Rateofreturnofinvetsmentintohumancapital Programmes oriented to earliest age 0-3 Souruce:"The case for investing in young children."(Heckman, 2012) INVESTMENT INTO LEARNING AT AN EARLY AGE YIELDs A CONSIDERABLY HIGHER RETURN THEN INVESTMENT LATER IN LIFE (HECKMAN, 2012) Importance of preschool education
  • 6.
    Return of investmentsinto human capital at different ages depending on social-economic status 6 Level of return Children from low level social-economic environment Children from low level social-economic environment Early childhood Primary and Second. School Higher education Adult education Age Source:"Efficiency and equity of European education and training policies." (Woessmann, 2008) Good quality pre-school programmes enable children from marginalized families to have equal beginning of education Importance of pre-school education
  • 7.
    Importance of pre-schooleducation 7  In a number of countries there has been a change in the role of PE from primary role of keeping children safe to the function of educating children  Montenegro has recognized the importance of pre-school education and upbringing and there is programme base for extending it  „By 2020 a minimum of 95% of children between the age of 4 and the age when obligatory primary education begins should participate in the early education programmes” (Europe 2020) To provide for all the children in Montenegro, from birth until the time when they start primary school, good quality services for early development and learning so that they reach their full potential and become active and productive members of the society” Strategiy of Early Pre-school education and upbringing for the period 2010 to 2015
  • 8.
    Aim of theStudy  Project aim: how to extend services of pre-school education to as many children an possible, especially those coming from vulnerable and marginalized groups 8  Study objective: analysis of the pre-school education funding scenarios  Funding scenarios have been analyzed which – Ensure universal coverage of children by pre-school education (one year before startign school), – Ensure gradual increase in coverage by pre-school programme for children aged 3-5  The Project was initiated by UNICEF Office in Montenegro and the Ministry of Education of Montenegro
  • 9.
    On the otherside, many parents in Montenegro are not familiar with the development role of pre-school institutions Children coverage is not high. On one side it is necessary to familiarize parents through a campaign with the benefits of pre-school education, and on the other to provide conditions for all children to attend pre-school education  ¼ of parents think a child is better off at home, without considering the benefits of PE attendance for child development „Assessment of knowledge, views and behaviour related to the care of children”, UNICEF, 2009, Montenegro The state of pre-school education in Montenegro  Coverage of children from 0 to 6 years of age: 33,2% or 15.604 of children  Coverage of children 3 to 6 years of age: 52.4% or 11.641 children  Coverage varies depending on the age of children and the territory  Numerous pre-school institutions operate beyond their capacities: 3.377 or 30% of surplus children aged 3-6
  • 10.
    The state ofpre-school education in Montenegro The relation between the degree of a municipality development and degree of coverage of children by PE, Montenegro, 2012
  • 11.
    Assessment of costsof introducing pre-school preparatory programme with general coverage
  • 12.
    Introducing preparatory pre-schoolprogramme (PPP)  Recognized importance of pre-school education and long- term benefits of general coverage  Pre-school preparatory programme (PPP)  3 hours per day, 5 days per week and 10 months per year, so that every child has at least 600 hours of PPP per year;  Cover all the children who have: – One year before starting school in 2015, – Two years before starting school in 2017, and – Three years before starting school in 2019;  PPP is free  Provides one meal (light meal)
  • 13.
    Total costs ofpre-school education (PE), 2015-20, EUR Primary programmes costs PPP costs for children who do not attend PE Total costs of PE Share of PPP in total costs 2015 16.963.657 989.243 17.952.900 6% 2016 16.876.707 1.034.122 17.910.829 6% 2017 16.719.488 2.033.033 18.752.521 11% 2018 16.679.920 1.955.438 18.635.358 10% 2019 16.814.183 3.461.938 20.276.121 17% 2020 16.870.884 3.433.725 20.304.610 17%
  • 14.
    PE costs andbudget expenditures for PE, 2015-20, EUR PE costs Budget expenditures for PE (3,8% GDP) Costs– budg. expend. 2015 17.952.900 13.209.506 4.743.394 2016 17.910.829 13.525.081 4.385.748 2017 18.752.521 13.879.032 4.873.489 2018 18.635.358 14.257.791 4.377.567 2019 20.276.121 14.646.886 5.629.235 2020 20.304.610 15.046.600 5.258.010
  • 15.
    Scenarios of fundingthe remaining costs from compensations paid by parents  Currently parents are paying 40 and 20 Euros per month, i.e. 1,8 and 0,9 Euros per day  Compensation for half a day is always 1/2 of the compensation for full day primary programme  Options: The same compensation for crèche and kindergarten or higher compensation for crèche in relation to kindergarten Compensation is not changed during 2015-20 or compensation increases in 2017 and 2019 Compensation is realized 100% or is realized only 80% Compensation is the same or different per municipalities….
  • 16.
    Model of differentcompensations per municipalities: 20% higher in municipalities with a high rate of coverage: Budva, Tivat, Kotor, Herceg Novi and Cetinje Average (median) for municipalities with the average rate of coverage: Podgorica, Kolašin, Danilovgrad, Bar, Pljevlja and Žabljak, Nikšić, Mojkovac, Ulcinj and Plav 20% lower in municipalities with a low rate of coverage: Bijelo Polje, Berane, Šavnik, Andrijevica, Plužine and Rožaje
  • 17.
    Scenarios of fundingthe remaining costs from compensations paid by parents A. The same price for kindergarten and crèche B. Different price for kindergarten and crèche C. Compensation is paid for attendance rate of up to 80%.
  • 18.
    Scenarios A: Thesame price for kindergarten and creche Revenues - expenditures, EUR A1 A2 A3 A4 2015 741,464 164,110 360,688 60,447 2016 1,062,746 489,220 693,470 394,693 2017 526,600 242,385 164,738 164,738 2018 1,004,718 721,440 649,536 649,536 2019 -202,378 -202,378 -554,515 -256,003 2020 186,850 186,850 -160,244 139,624 A1: 38 Euros per month A2: 34, 36 a 38 Euros per month A3: median 34 Euros per month A4: median 32, 34 and 36 Euros per month in 2015, 2017 and 2019
  • 19.
    Scenarios B: Compensationfor crèche higher than for kindergarten Revenues- expenditures, EUR B1 B2 B3 B4 2015 366,778 587,899 572,726 272,486 2016 693,666 912,280 907,628 608,851 2017 163,519 379,284 380,075 344,185 2018 644,441 858,959 866,083 829,992 2019 -566,385 -349,841 -336,730 -110,812 2020 -178,108 39,069 58,763 285,629 B1: 40 full day crèche and 34 kindergrat B2: 40 full day creche and 36 kindergarten B3: median 40 full day creche and 34 kidergarten B4: median for full day creche 38, 39 and 40, and 32, 34 and 36
  • 20.
    Scenarios C: 80%of compensation is charged from parents Revenues - expenditures, EUR C1 C2 C3 2015 -124,567 568,258 587,899 2016 202,458 890,688 912,280 2017 -326,045 356,071 379,284 2018 154,883 834,751 858,959 2019 -1,059,250 -373,753 -349,841 2020 -672,865 14,907 39,069 C1: 40 Euros per month for full day programme C2: 46 Euros per month for full day programme C3: 50 Euros for full day crèche and 45 Euros for kindergarten
  • 21.
    Scenarios C: 80%of compensation is charged from parents Revenues - expenditures, EUR C4 C5 C6 2015 106,375 540,832 60,447 2016 431,868 872,737 355,002 2017 128,699 342,557 105,464 2018 608,128 826,963 590,393 2019 -373,753 -375,408 -375,408 2020 19,677 19,677 16,534 C4: 42, 44 and 46 Euros per month for full day programme C5: median 44 Euros per month for full day programme C6: median is 40, 42 and 46 Euros per month for full day programmes in 2015, 2017 and 2019
  • 22.
    Main findings In scenarioC the rate of collection of 80% causes an increase in the amount of compensation to be paid by parents by around 20% In general programmes where compensation is changed over the years are more efficient Of all A scenarios, scenario A4 shows the lowest difference between total revenues and total expenditures, followed by scenario A2 Of all B scenarios, scenario B4 results in the lowest difference between revenues and expenditures and thus is more superior Of all C scenarios, scenarios C4 and C6 show the lowest degree of aberration of revenues from costs Besides the above quoted, the choice of the scenario depends also on the compensation to be paid in those scenarios…
  • 23.
    Municipalities 2015 20172019 Compen.per scenario A2 34 36 38 Compen.per scenario A4 Higher coverge 38 41 43 Average coverage 32 34 36 Low coverage 26 27 29 Compen.per scenario C4 42 44 46 Compen. per scenario C6 High coverage 48 50 53 Average coverage 40 42 44 Low coverage 32 34 35 Monthly compensations for full day programmes, EUR
  • 24.
    Monthly compensations forfull day programme in scenario B4, EUR Minicipalities with higher cover. Minicipalities with average cover. Minicipalitie s with low cover. 2015 creche 46 38 30 kindergar. 38 32 26 2017 creche 47 39 31 kindergar. 41 34 27 2019 creche 48 40 32 kindergar. 43 36 29 24
  • 25.
    Conclusions The costs ofPPP make up 6%-17% of total costs PE The budget covers 75% of total costs of PE for 2015-2020 The remaining amount would be paid by parents through compensation, in accordance with the proposed scenarios The amount of compensation in different scenarios varies depending on: year of programme implementation; weather crèche or kindergarten is concerned; weather a municipality with average, lower or higher rate of children converge by PE is concerned, and, the key factor is rate of collection of compensations by the parents.
  • 26.
    Conclusions Scenarios that coverthe costs of PE most efficiently are scenarios A2, A4, B4, C4 and C6. The selection, in ideal case of one of these 5 scenarios, will depend on concrete circumstances and the needs of decision makers: The basic issue is that of degree of collection of compensations from parents One of the factors affecting the selection of the scenario is also the amount of compensation paid by parents in different scenarios At the same time it must be taken into account that degree of realization of compensations from parents has an opposite effect on the general level of compensations to be paid by the parents – the lower the rate of collection the higher the total compensation to be paid by parents.
  • 27.
    Thank you foryour attention! 27