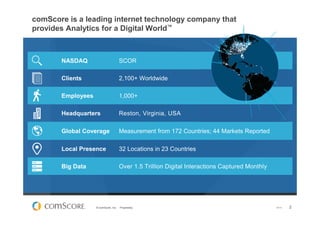
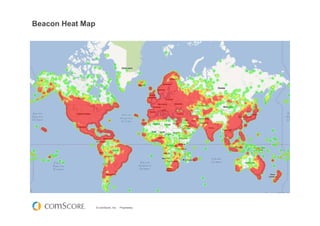
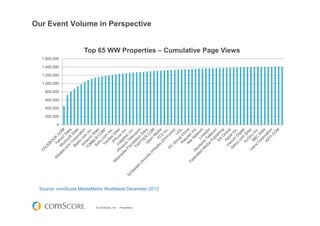
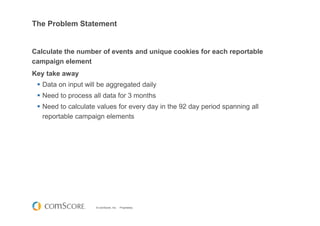
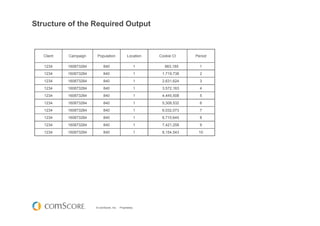
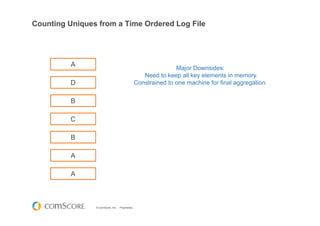
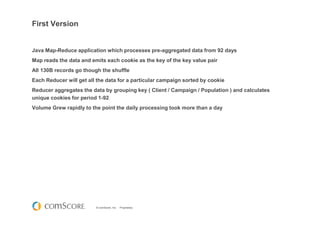
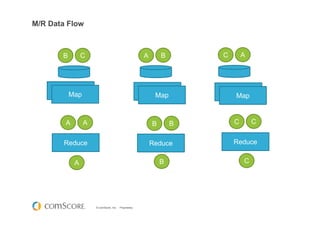
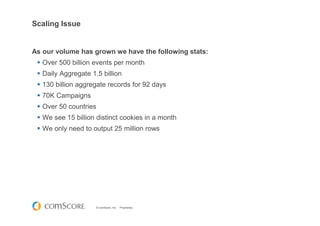
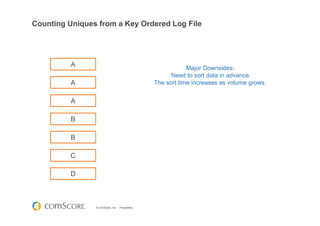
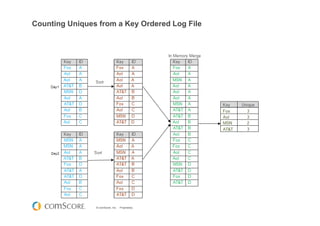
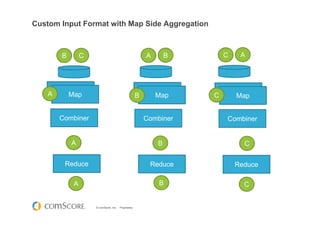
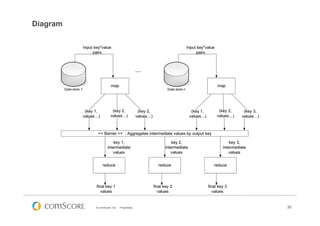
© comScore, Inc. Proprietary.
Using Hadoop to Process a
Trillion+ Events
Michael Brown, CTO | February 28th, 2013
© comScore, Inc. Proprietary. 2
comScore is a leading internet technology company that
provides Analytics for a Digital World™
NASDAQ SCOR
Clients 2,100+ Worldwide
Employees 1,000+
Headquarters Reston, Virginia, USA
Global Coverage Measurement from 172 Countries; 44 Markets Reported
Local Presence 32 Locations in 23 Countries
Big Data Over 1.5 Trillion Digital Interactions Captured Monthly
V0113
Vocabulary for Measuring Information
If a Grain of Sand were One Byte of Information . . .
1 Gigabyte =
1 billion bytes
patch of sand—
9” square, 1’ deep
1 Terabyte =
1 trillion bytes
a sandbox—
24’ square, 1’ deep
1 Petabyte =
1,000 terabytes
a mile long beach—
100’ wide , 1’ deep
1 Megabyte =
1 million bytes
a tablespoon of sand
1 Zetabyte =
1,000 exabytes
the same beach—
along the entire US coast
1 Exabyte =
1,000 petabytes
the same beach—
from Maine to North Carolina
1 Yottabyte =
1,000 zetabytes (24 Zeroes)
enough info to bury the entire
US under 296 feet of sand
© comScore, Inc. Proprietary.
Panel Heat Map
© comScore, Inc. Proprietary.
CENSUS
Unified Digital Measurement™ (UDM) Establishes Platform For
Panel + Census Data Integration
PANEL
Unified Digital Measurement (UDM)
Patent-Pending Methodology
Adopted by 90% of Top 100 U.S. Media Properties
Global PERSON
Measurement
Global DEVICE
Measurement
V0411
© comScore, Inc. Proprietary.
Worldwide Tags per Month
0
200,000,000,000
400,000,000,000
600,000,000,000
800,000,000,000
1,000,000,000,000
1,200,000,000,000
1,400,000,000,000
1,600,000,000,000
Jul
Aug
Sep
Oct
Nov
Dec
Jan
Feb
Mar
Apr
May
Jun
Jul
Aug
Sep
Oct
Nov
Dec
Jan
Feb
Mar
Apr
May
Jun
Jul
Aug
Sep
Oct
Nov
Dec
Jan
Feb
Mar
Apr
May
Jun
Jul
Aug
Sep
Oct
Nov
Dec
Jan
2009 2010 2011 2012 2013
#ofrecords
Panel Records Beacon Records
© comScore, Inc. Proprietary.
Beacon Heat Map
© comScore, Inc. Proprietary.
Our Event Volume in Perspective
Source: comScore MediaMetrix Worldwide December 2012
0
200,000
400,000
600,000
800,000
1,000,000
1,200,000
1,400,000
1,600,000
Top 65 WW Properties – Cumulative Page Views
© comScore, Inc. Proprietary.
Worldwide UDM™ Penetration
December 2012 Penetration Data
Europe
Austria 87%
Belgium 93%
Switzerland 89%
Germany 92%
Denmark 88%
Spain 95%
Finland 93%
France 92%
Ireland 90%
Italy 90%
Netherlands 93%
Norway 91%
Portugal 92%
Sweden 90%
United Kingdom 92%
Asia Pacific
Australia 90%
Hong Kong 95%
India 92%
Japan 82%
Malaysia 93%
New Zealand 91%
Singapore 92%
North America
Canada 94%
United States 91%
Latin America
Argentina 95%
Brazil 96%
Chile 94%
Colombia 95%
Mexico 93%
Puerto Rico 92%
Middle East & Africa
Israel 92%
South Africa 78%
Percentage of Machines Included in UDM Measurement
© comScore, Inc. Proprietary.
High Level Data Flow
Panel
Census
ETL
Delivery
© comScore, Inc. Proprietary.
Our Cluster
Production Hadoop Cluster
120 nodes: Mix of Dell 720xd, R710 and R510 servers
Each R510 has (12x2TB drives; 64GB RAM; 24 cores)
3000+ total CPUs
6.0TB total memory
2PB total disk space
Our distro is MapR M5 2.1.0
© comScore, Inc. Proprietary.
The Project:
vCE – Validated Campaign Essentials
© comScore, Inc. Proprietary.
comScore - vCE
© comScore, Inc. Proprietary.
The Problem Statement
Calculate the number of events and unique cookies for each reportable
campaign element
Key take away
Data on input will be aggregated daily
Need to process all data for 3 months
Need to calculate values for every day in the 92 day period spanning all
reportable campaign elements
© comScore, Inc. Proprietary.
Structure of the Required Output
Client Campaign Population Location Cookie Ct Period
1234 160873284 840 1 863,185 1
1234 160873284 840 1 1,719,738 2
1234 160873284 840 1 2,631,624 3
1234 160873284 840 1 3,572,163 4
1234 160873284 840 1 4,445,508 5
1234 160873284 840 1 5,308,532 6
1234 160873284 840 1 6,032,073 7
1234 160873284 840 1 6,710,645 8
1234 160873284 840 1 7,421,258 9
1234 160873284 840 1 8,154,543 10
© comScore, Inc. Proprietary.
Counting Uniques from a Time Ordered Log File
A
B
C
D
B
A
A
Major Downsides:
Need to keep all key elements in memory.
Constrained to one machine for final aggregation.
© comScore, Inc. Proprietary.
First Version
Java Map-Reduce application which processes pre-aggregated data from 92 days
Map reads the data and emits each cookie as the key of the key value pair
All 130B records go though the shuffle
Each Reducer will get all the data for a particular campaign sorted by cookie
Reducer aggregates the data by grouping key ( Client / Campaign / Population ) and calculates
unique cookies for period 1-92
Volume Grew rapidly to the point the daily processing took more than a day
© comScore, Inc. Proprietary.
M/R Data Flow
CB
Mapper MapperMapperMap Map Map
Reduce ReduceReduce
BA AC
AA BB CC
A B C
© comScore, Inc. Proprietary.
Scaling Issue
As our volume has grown we have the following stats:
Over 500 billion events per month
Daily Aggregate 1.5 billion
130 billion aggregate records for 92 days
70K Campaigns
Over 50 countries
We see 15 billion distinct cookies in a month
We only need to output 25 million rows
© comScore, Inc. Proprietary.
Basic Approach Retrospective
Processing speed is not scaling to our needs on a sample of the input data
Diagnosis
Most aggregations could not take significant advantage of combiners.
Large shuffles caused poor job performance. In some cases large aggregations ran slower on the
Hadoop cluster due to shuffle and skew in data for keys.
Diagnosis
A new approach is required to reduce the shuffle
© comScore, Inc. Proprietary.
Counting Uniques from a Key Ordered Log File
A
D
B
C
B
A
A
Major Downsides:
Need to sort data in advance.
The sort time increases as volume grows.
© comScore, Inc. Proprietary.
Counting Uniques from a Key Ordered Log File
© comScore, Inc. Proprietary.
Counting Uniques from Sharded Key Ordered Log Files
© comScore, Inc. Proprietary.
Solution to reduce the shuffle
The Problem:
Most aggregations within comScore can not take advantage of combiners, leading to large shuffles and
job performance issues
The Idea:
Partition and sort the data by cookie on a daily basis
Create a custom InputFormat to merge daily partitions for monthly aggregations
© comScore, Inc. Proprietary.
Custom Input Format with Map Side Aggregation
CB
Mapper MapperMapperMap Map Map
Reduce ReduceReduce
BA AC
A B C
A B C
Combiner Combiner Combiner
A B C
© comScore, Inc. Proprietary.
Risks for Partitioning
Data locality
Custom InputFormat requires reading blocks of the partitioned data over the network
This was solved using a feature of the MapR file system. We created volumes and set the chunk size to
zero which guarantees that the data written to a volume will stay on one node
Map failures might result in long run times
Size of the map inputs is no longer set by block size
This was solved by creating a large number (10K) of volumes to limit the size of data processed by each
mapper
© comScore, Inc. Proprietary.
Partitioning Summary
Benefits:
A large portion of the aggregation can be completed in the map phase
Applications can now take advantage of combiners
Shuffles sizes are minimal
Results:
Took a job from 35 hours to 3 hours with no hardware changes
© comScore, Inc. Proprietary.
Useful Factoids
Visit www.comscoredatamine.com or follow @datagems for the latest gems.
Colorful, bite-sized graphical representations of the best discoveries we unearth.
© comScore, Inc. Proprietary.
Thank You!
Michael Brown
CTO
comScore, Inc.
mbrown@comscore.com
© comScore, Inc. Proprietary. 30
Diagram

Using Hadoop

  • 1.
    © comScore, Inc.Proprietary. Using Hadoop to Process a Trillion+ Events Michael Brown, CTO | February 28th, 2013
  • 2.
    © comScore, Inc.Proprietary. 2 comScore is a leading internet technology company that provides Analytics for a Digital World™ NASDAQ SCOR Clients 2,100+ Worldwide Employees 1,000+ Headquarters Reston, Virginia, USA Global Coverage Measurement from 172 Countries; 44 Markets Reported Local Presence 32 Locations in 23 Countries Big Data Over 1.5 Trillion Digital Interactions Captured Monthly V0113
  • 3.
    Vocabulary for MeasuringInformation If a Grain of Sand were One Byte of Information . . . 1 Gigabyte = 1 billion bytes patch of sand— 9” square, 1’ deep 1 Terabyte = 1 trillion bytes a sandbox— 24’ square, 1’ deep 1 Petabyte = 1,000 terabytes a mile long beach— 100’ wide , 1’ deep 1 Megabyte = 1 million bytes a tablespoon of sand 1 Zetabyte = 1,000 exabytes the same beach— along the entire US coast 1 Exabyte = 1,000 petabytes the same beach— from Maine to North Carolina 1 Yottabyte = 1,000 zetabytes (24 Zeroes) enough info to bury the entire US under 296 feet of sand
  • 4.
    © comScore, Inc.Proprietary. Panel Heat Map
  • 5.
    © comScore, Inc.Proprietary. CENSUS Unified Digital Measurement™ (UDM) Establishes Platform For Panel + Census Data Integration PANEL Unified Digital Measurement (UDM) Patent-Pending Methodology Adopted by 90% of Top 100 U.S. Media Properties Global PERSON Measurement Global DEVICE Measurement V0411
  • 6.
    © comScore, Inc.Proprietary. Worldwide Tags per Month 0 200,000,000,000 400,000,000,000 600,000,000,000 800,000,000,000 1,000,000,000,000 1,200,000,000,000 1,400,000,000,000 1,600,000,000,000 Jul Aug Sep Oct Nov Dec Jan Feb Mar Apr May Jun Jul Aug Sep Oct Nov Dec Jan Feb Mar Apr May Jun Jul Aug Sep Oct Nov Dec Jan Feb Mar Apr May Jun Jul Aug Sep Oct Nov Dec Jan 2009 2010 2011 2012 2013 #ofrecords Panel Records Beacon Records
  • 7.
    © comScore, Inc.Proprietary. Beacon Heat Map
  • 8.
    © comScore, Inc.Proprietary. Our Event Volume in Perspective Source: comScore MediaMetrix Worldwide December 2012 0 200,000 400,000 600,000 800,000 1,000,000 1,200,000 1,400,000 1,600,000 Top 65 WW Properties – Cumulative Page Views
  • 9.
    © comScore, Inc.Proprietary. Worldwide UDM™ Penetration December 2012 Penetration Data Europe Austria 87% Belgium 93% Switzerland 89% Germany 92% Denmark 88% Spain 95% Finland 93% France 92% Ireland 90% Italy 90% Netherlands 93% Norway 91% Portugal 92% Sweden 90% United Kingdom 92% Asia Pacific Australia 90% Hong Kong 95% India 92% Japan 82% Malaysia 93% New Zealand 91% Singapore 92% North America Canada 94% United States 91% Latin America Argentina 95% Brazil 96% Chile 94% Colombia 95% Mexico 93% Puerto Rico 92% Middle East & Africa Israel 92% South Africa 78% Percentage of Machines Included in UDM Measurement
  • 10.
    © comScore, Inc.Proprietary. High Level Data Flow Panel Census ETL Delivery
  • 11.
    © comScore, Inc.Proprietary. Our Cluster Production Hadoop Cluster 120 nodes: Mix of Dell 720xd, R710 and R510 servers Each R510 has (12x2TB drives; 64GB RAM; 24 cores) 3000+ total CPUs 6.0TB total memory 2PB total disk space Our distro is MapR M5 2.1.0
  • 12.
    © comScore, Inc.Proprietary. The Project: vCE – Validated Campaign Essentials
  • 13.
    © comScore, Inc.Proprietary. comScore - vCE
  • 14.
    © comScore, Inc.Proprietary. The Problem Statement Calculate the number of events and unique cookies for each reportable campaign element Key take away Data on input will be aggregated daily Need to process all data for 3 months Need to calculate values for every day in the 92 day period spanning all reportable campaign elements
  • 15.
    © comScore, Inc.Proprietary. Structure of the Required Output Client Campaign Population Location Cookie Ct Period 1234 160873284 840 1 863,185 1 1234 160873284 840 1 1,719,738 2 1234 160873284 840 1 2,631,624 3 1234 160873284 840 1 3,572,163 4 1234 160873284 840 1 4,445,508 5 1234 160873284 840 1 5,308,532 6 1234 160873284 840 1 6,032,073 7 1234 160873284 840 1 6,710,645 8 1234 160873284 840 1 7,421,258 9 1234 160873284 840 1 8,154,543 10
  • 16.
    © comScore, Inc.Proprietary. Counting Uniques from a Time Ordered Log File A B C D B A A Major Downsides: Need to keep all key elements in memory. Constrained to one machine for final aggregation.
  • 17.
    © comScore, Inc.Proprietary. First Version Java Map-Reduce application which processes pre-aggregated data from 92 days Map reads the data and emits each cookie as the key of the key value pair All 130B records go though the shuffle Each Reducer will get all the data for a particular campaign sorted by cookie Reducer aggregates the data by grouping key ( Client / Campaign / Population ) and calculates unique cookies for period 1-92 Volume Grew rapidly to the point the daily processing took more than a day
  • 18.
    © comScore, Inc.Proprietary. M/R Data Flow CB Mapper MapperMapperMap Map Map Reduce ReduceReduce BA AC AA BB CC A B C
  • 19.
    © comScore, Inc.Proprietary. Scaling Issue As our volume has grown we have the following stats: Over 500 billion events per month Daily Aggregate 1.5 billion 130 billion aggregate records for 92 days 70K Campaigns Over 50 countries We see 15 billion distinct cookies in a month We only need to output 25 million rows
  • 20.
    © comScore, Inc.Proprietary. Basic Approach Retrospective Processing speed is not scaling to our needs on a sample of the input data Diagnosis Most aggregations could not take significant advantage of combiners. Large shuffles caused poor job performance. In some cases large aggregations ran slower on the Hadoop cluster due to shuffle and skew in data for keys. Diagnosis A new approach is required to reduce the shuffle
  • 21.
    © comScore, Inc.Proprietary. Counting Uniques from a Key Ordered Log File A D B C B A A Major Downsides: Need to sort data in advance. The sort time increases as volume grows.
  • 22.
    © comScore, Inc.Proprietary. Counting Uniques from a Key Ordered Log File
  • 23.
    © comScore, Inc.Proprietary. Counting Uniques from Sharded Key Ordered Log Files
  • 24.
    © comScore, Inc.Proprietary. Solution to reduce the shuffle The Problem: Most aggregations within comScore can not take advantage of combiners, leading to large shuffles and job performance issues The Idea: Partition and sort the data by cookie on a daily basis Create a custom InputFormat to merge daily partitions for monthly aggregations
  • 25.
    © comScore, Inc.Proprietary. Custom Input Format with Map Side Aggregation CB Mapper MapperMapperMap Map Map Reduce ReduceReduce BA AC A B C A B C Combiner Combiner Combiner A B C
  • 26.
    © comScore, Inc.Proprietary. Risks for Partitioning Data locality Custom InputFormat requires reading blocks of the partitioned data over the network This was solved using a feature of the MapR file system. We created volumes and set the chunk size to zero which guarantees that the data written to a volume will stay on one node Map failures might result in long run times Size of the map inputs is no longer set by block size This was solved by creating a large number (10K) of volumes to limit the size of data processed by each mapper
  • 27.
    © comScore, Inc.Proprietary. Partitioning Summary Benefits: A large portion of the aggregation can be completed in the map phase Applications can now take advantage of combiners Shuffles sizes are minimal Results: Took a job from 35 hours to 3 hours with no hardware changes
  • 28.
    © comScore, Inc.Proprietary. Useful Factoids Visit www.comscoredatamine.com or follow @datagems for the latest gems. Colorful, bite-sized graphical representations of the best discoveries we unearth.
  • 29.
    © comScore, Inc.Proprietary. Thank You! Michael Brown CTO comScore, Inc. mbrown@comscore.com
  • 30.
    © comScore, Inc.Proprietary. 30 Diagram