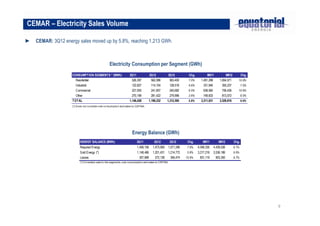
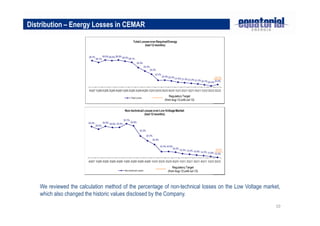
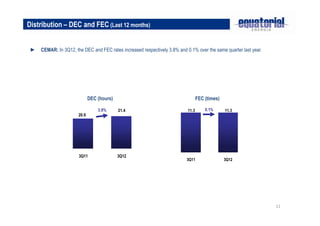
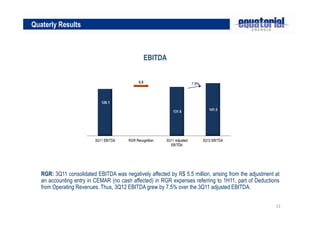
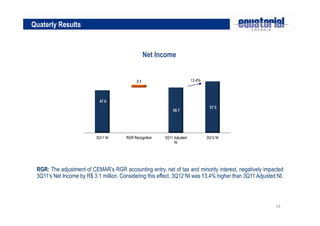
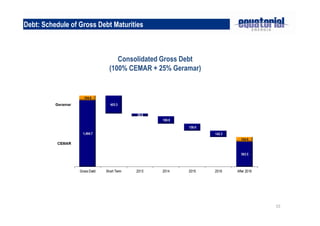
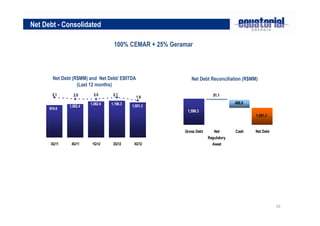
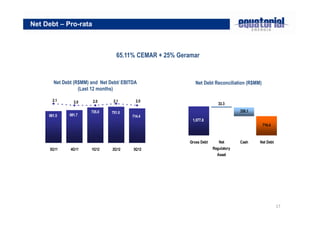
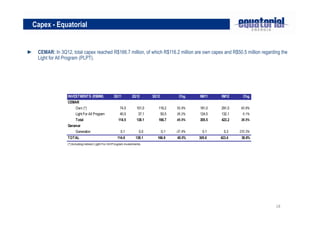
OPERATING AND
FINANCIAL RESULTS
                    3Q12
Agenda


 ► Introduction

 ► Highlights

 ► Operating Results

 ► Financial Results


                       2
Agenda


  ► Introduction

  ► Highlights

  ► Operating Results

  ► Financial Results


                        3
Introduction
                          Presentation of Operating and Financial Information
  ► The financial information contained herein is presented in consolidated figures, pursuant to Brazilian
    Corporate Law, based on revised financial information. The consolidated financial information
    represents: i) 100% of CEMAR’s results, excluding 34.89% related to minority interests, ii) 25% of
    Geramar’s results and iii) 100% of Equatorial Soluções’ results, which in turn consolidated 100% of Sol
    Energias’ results, excluding 49% of minority interest before Net Income.

  ► The operating information presented herein consolidates 100% of CEMAR’s results and 25% of
    Geramar’s results.

  ► The following information was not reviewed by the independent auditors: i) non-financial information
    relating to CEMAR, Light and the PLPT (Programa Luz para Todos - Light for All Program); ii) pro forma
    information and its comparison with the results presented in the period; and iii) management
    expectations regarding the future performance of the Companies.


                                                                                                              4
Agenda


    ► Introduction

    ► Highlights

    ► Operating Results

    ► Financial Results


                          5
Operating Highlights


   ► CEMAR’s billed energy volume totaled 1,213 GWh in 3Q12, 5.8% more than in 3Q11.

   ► CEMAR’s last-12-month energy losses totaled 20.8% of required energy in 3Q12, 0.4 p.p. less than the
     3Q11 ratio.

   ► CEMAR’s last-12-month DEC and FEC indices came to 21.4 hours and 11.3 times, respectively, in
     3Q12, 3.8% and 0.1% up on the 3Q11 figures.

   ► On September 25, Equatorial published a Material Fact stating it had signed a Sale and Purchase
     Agreement for the acquisition of 61.37% of the capital stock of CELPA. The consummation of the
     operation is subject to certain preceding conditions described in the contract.

   ► On October 11, Equatorial signed jointly with CPFL and the controlling shareholder of Grupo Rede a
     Memorandum of Understandings that permits the first two parties to evaluate, with exclusivity, all of the
     companies controlled by Grupo Rede which could result in the acquisition of a controlling stake of the
     latter.


                                                                                                                 6
Financial Highlights


  ► Net operating revenues (NOR) in 3Q12 reached R$650.3 million in, 30.4% higher than the NOR posted in
    3Q11, which reflects growth of 23.6% for CEMAR and the Sol Energias merger.

  ► In 3Q12, the EBITDA totaled R$141.5 million, a 7.5% increase compared to the adjusted amount for 3Q11.

  ► The net income for the quarter was R$57.5 million, up 13.4% compared to the adjusted amount for the same
    quarter of the previous year.

  ► Equatorial’s consolidated investments amounted to R$166.8 million in 3Q12, 45.5% up year-on-year. In
    CEMAR (excluding direct investments in the Light For All Program), total capex amounted to R$116.2 million,
    55.9% growth. Light For All Program investments totaled R$50.5 million, a 26.2% growth.

  ► The SUDENE benefit, which reduces CEMAR’s Income Tax in 75%, had its validity extended until 2021.


                                                                                                            7
Agenda


  ► Introduction

  ► Highlights

  ► Operating Results

  ► Financial Results


                        8
CEMAR – Electricity Sales Volume

► CEMAR: 3Q12 energy sales moved up by 5.8%, reaching 1,213 GWh.


                                                     Electricity Consumption per Segment (GWh)
                    CONSUMPTION SEGMENTS * (MWh)                       3Q11               2Q12          3Q12          Chg.          9M11            9M12          Chg.
                      Residential                                       526,397            562,098       563,400     7.0%      1,491,298       1,654,571      10.9%
                      Industrial                                        122,827            114,104       128,518     4.6%        331,940         355,237          7.0%
                      Commercial                                         227,005           241,607        240,682    6.0%        638,560         706,436      10.6%
                      Other                                              270,199           281,422        279,996    3.6%        749,833         813,572          8.5%
                    TOTAL                                              1,146,428         1,199,232      1,212,595    5.8%      3,211,631       3,529,816          9.9%
                    (*) Do es no t co nsider o wn co nsumptio n and sales to CEP ISA .


                                                                          Energy Balance (GWh)
                          ENERGY BALANCE (MWh)                                3Q11           2Q12        3Q12        Chg.       9M11          9M12         Chg.
                          Required Energy                                     1,456,156     1,473,569   1,571,246   7.9%     4,048,335     4,439,536       9.7%
                          Sold Energy (*)                                     1,148,466     1,201,431   1,214,772   5.8%     3,217,216     3,536,186       9.9%
                          Losses                                                307,689       272,138     356,474   15.9%      831,119       903,350       8.7%
                          (*) Co nsiders sale to the segments, o wn co nsumptio n and sales to CEPISA


                                                                                                                                                                         9
Distribution – Energy Losses in CEMAR


    We reviewed the calculation method of the percentage of non-technical losses on the Low Voltage market,
    which also changed the historic values disclosed by the Company.
                                                                                                         10
Distribution – DEC and FEC (Last 12 months)


 ► CEMAR: In 3Q12, the DEC and FEC rates increased respectively 3.8% and 0.1% over the same quarter last year.


                              DEC (hours)                                         FEC (times)

                                  3.8%      21.4                           11.3       0.1%      11.3
                       20.6


                       3Q11                 3Q12
                                                                          3Q11                  3Q12


                                                                                                                 11
Agenda


 ► Introduction

 ► Highlights

 ► Operating Results

 ► Financial Results


                       12
Quaterly Results


                                               EBITDA


   RGR: 3Q11 consolidated EBITDA was negatively affected by R$ 5.5 million, arising from the adjustment at
   an accounting entry in CEMAR (no cash affected) in RGR expenses referring to 1H11, part of Deductions
   from Operating Revenues. Thus, 3Q12 EBITDA grew by 7.5% over the 3Q11 adjusted EBITDA.


                                                                                                        13
Quaterly Results


                                               Net Income


 RGR: The adjustment of CEMAR’s RGR accounting entry, net of tax and minority interest, negatively impacted
 3Q11’s Net Income by R$ 3.1 million. Considering this effect, 3Q12 NI was 13.4% higher than 3Q11 Adjusted NI.


                                                                                                          14
Debt: Schedule of Gross Debt Maturities


                              Consolidated Gross Debt
                           (100% CEMAR + 25% Geramar)


                                                        15
Net Debt - Consolidated

                                    100% CEMAR + 25% Geramar


        Net Debt (R$MM) and Net Debt/ EBITDA                Net Debt Reconciliation (R$MM)
                   (Last 12 months)
       2.1       2.0       2.0      2.1                                 51.1
                                               1.9
                         1,082.6   1,108.3                                         496.9
               1,002.4                       1,051.3
      974.6
                                                          1,599.3
                                                                                           1,051.3


                                                         Gross Debt      Net       Cash    Net Debt
                                                                      Regulatory
      3Q11      4Q11      1Q12      2Q12      3Q12                      Asset


                                                                                                      16
Net Debt – Pro-rata


                                  65.11% CEMAR + 25% Geramar


       Net Debt (R$MM) and Net Debt/ EBITDA                 Net Debt Reconciliation (R$MM)
                  (Last 12 months)

       2.1     2.0      2.0      2.1       2.0
                                                                         33.3
                       735.0    751.0                                              330.1
     661.5   681.7                       714.4
                                                          1,077.8
                                                                                             714.4


                                                         Gross Debt      Net       Cash    Net Debt
      3Q11    4Q11     1Q12     2Q12     3Q12                         Regulatory
                                                                        Asset


                                                                                                      17
Capex - Equatorial


► CEMAR: In 3Q12, total capex reached R$166.7 million, of which R$116.2 million are own capex and R$50.5 million regarding the
  Light for All Program (PLPT).


                   INVESTMENTS (R$MM)                    3Q11           2Q12       3Q12          Chg.    9M11    9M12      Chg.
                   CEMAR
                         Own (*)                              74.5         101.0      116.2     55.9%    181.0   291.0   60.8%
                         Light For All Program                40.0          37.1       50.5     26.2%    124.5   132.1    6.1%
                         Total                              114.5          138.1      166.7     45.5%    305.5   423.2   38.5%
                   Geramar
                         Generation                           0.1            0.0          0.1   -37.4%     0.1     0.3   270.3%
                   TOTAL                                   114.6           138.1     166.8      45.5%    305.6   423.4    38.6%
                   (*) Including indirect Light Fo r A ll P ro gram investments


                                                                                                                                  18
Contacts


                          Eduardo Haiama
                           CFO and IRO

                         Thomas Newlands
                          Investor Relations

                  Telephone 1: +0 55 (21) 3206-6635
                  Telephone 2: +0 55 (21) 3217-6607

                 Email: ir@equatorialenergia.com.br

           Website: http://www.equatorialenergia.com.br/ir


                                                             19
Disclaimer


•    This presentation may contain forward-looking statements, which are subject to risks and uncertainties, as they were based on the
     expectations of Company’s management and on available information. These prospects include statements concerning the Company’s
     current intentions or expectations for our clients; this presentation will also be available at our website www.equatorialenergia.com.br/ir and
     in the IPE system of the Brazilian Securities and Exchange Commission (CVM).

•    Forward-looking statements refer to future events which may or may not occur. Our future financial situation, operating results, market share
     and competitive positioning may differ substantially from those expressed or suggested by said forward-looking statements. Many factors
     and values that can establish these results are outside Company’s control or expectation. The reader/investor is advised not to completely
     rely on the information above.

•    The words “believe", “can", “predict", “estimate", “continue", “anticipate", “intend", “forecast" and similar words, are intended to identify
     estimates, which refer only to the date on which they were expressed. Hence, the Company has no obligation to update said statements.

•    This presentation does not constitute any offering, invitation or request of subscription offer or purchase of any marketable securities. And,
     this statement or any other information herein, does not constitute the basis for any contract or commitment of any kind.


                                                                                                                                                       20

Webcast 3 q12 eng

  • 1.
  • 2.
    Agenda ► Introduction ► Highlights ► Operating Results ► Financial Results 2
  • 3.
    Agenda ►Introduction ► Highlights ► Operating Results ► Financial Results 3
  • 4.
    Introduction Presentation of Operating and Financial Information ► The financial information contained herein is presented in consolidated figures, pursuant to Brazilian Corporate Law, based on revised financial information. The consolidated financial information represents: i) 100% of CEMAR’s results, excluding 34.89% related to minority interests, ii) 25% of Geramar’s results and iii) 100% of Equatorial Soluções’ results, which in turn consolidated 100% of Sol Energias’ results, excluding 49% of minority interest before Net Income. ► The operating information presented herein consolidates 100% of CEMAR’s results and 25% of Geramar’s results. ► The following information was not reviewed by the independent auditors: i) non-financial information relating to CEMAR, Light and the PLPT (Programa Luz para Todos - Light for All Program); ii) pro forma information and its comparison with the results presented in the period; and iii) management expectations regarding the future performance of the Companies. 4
  • 5.
    Agenda ► Introduction ► Highlights ► Operating Results ► Financial Results 5
  • 6.
    Operating Highlights ► CEMAR’s billed energy volume totaled 1,213 GWh in 3Q12, 5.8% more than in 3Q11. ► CEMAR’s last-12-month energy losses totaled 20.8% of required energy in 3Q12, 0.4 p.p. less than the 3Q11 ratio. ► CEMAR’s last-12-month DEC and FEC indices came to 21.4 hours and 11.3 times, respectively, in 3Q12, 3.8% and 0.1% up on the 3Q11 figures. ► On September 25, Equatorial published a Material Fact stating it had signed a Sale and Purchase Agreement for the acquisition of 61.37% of the capital stock of CELPA. The consummation of the operation is subject to certain preceding conditions described in the contract. ► On October 11, Equatorial signed jointly with CPFL and the controlling shareholder of Grupo Rede a Memorandum of Understandings that permits the first two parties to evaluate, with exclusivity, all of the companies controlled by Grupo Rede which could result in the acquisition of a controlling stake of the latter. 6
  • 7.
    Financial Highlights ► Net operating revenues (NOR) in 3Q12 reached R$650.3 million in, 30.4% higher than the NOR posted in 3Q11, which reflects growth of 23.6% for CEMAR and the Sol Energias merger. ► In 3Q12, the EBITDA totaled R$141.5 million, a 7.5% increase compared to the adjusted amount for 3Q11. ► The net income for the quarter was R$57.5 million, up 13.4% compared to the adjusted amount for the same quarter of the previous year. ► Equatorial’s consolidated investments amounted to R$166.8 million in 3Q12, 45.5% up year-on-year. In CEMAR (excluding direct investments in the Light For All Program), total capex amounted to R$116.2 million, 55.9% growth. Light For All Program investments totaled R$50.5 million, a 26.2% growth. ► The SUDENE benefit, which reduces CEMAR’s Income Tax in 75%, had its validity extended until 2021. 7
  • 8.
    Agenda ►Introduction ► Highlights ► Operating Results ► Financial Results 8
  • 9.
    CEMAR – ElectricitySales Volume ► CEMAR: 3Q12 energy sales moved up by 5.8%, reaching 1,213 GWh. Electricity Consumption per Segment (GWh) CONSUMPTION SEGMENTS * (MWh) 3Q11 2Q12 3Q12 Chg. 9M11 9M12 Chg. Residential 526,397 562,098 563,400 7.0% 1,491,298 1,654,571 10.9% Industrial 122,827 114,104 128,518 4.6% 331,940 355,237 7.0% Commercial 227,005 241,607 240,682 6.0% 638,560 706,436 10.6% Other 270,199 281,422 279,996 3.6% 749,833 813,572 8.5% TOTAL 1,146,428 1,199,232 1,212,595 5.8% 3,211,631 3,529,816 9.9% (*) Do es no t co nsider o wn co nsumptio n and sales to CEP ISA . Energy Balance (GWh) ENERGY BALANCE (MWh) 3Q11 2Q12 3Q12 Chg. 9M11 9M12 Chg. Required Energy 1,456,156 1,473,569 1,571,246 7.9% 4,048,335 4,439,536 9.7% Sold Energy (*) 1,148,466 1,201,431 1,214,772 5.8% 3,217,216 3,536,186 9.9% Losses 307,689 272,138 356,474 15.9% 831,119 903,350 8.7% (*) Co nsiders sale to the segments, o wn co nsumptio n and sales to CEPISA 9
  • 10.
    Distribution – EnergyLosses in CEMAR We reviewed the calculation method of the percentage of non-technical losses on the Low Voltage market, which also changed the historic values disclosed by the Company. 10
  • 11.
    Distribution – DECand FEC (Last 12 months) ► CEMAR: In 3Q12, the DEC and FEC rates increased respectively 3.8% and 0.1% over the same quarter last year. DEC (hours) FEC (times) 3.8% 21.4 11.3 0.1% 11.3 20.6 3Q11 3Q12 3Q11 3Q12 11
  • 12.
    Agenda ► Introduction ► Highlights ► Operating Results ► Financial Results 12
  • 13.
    Quaterly Results EBITDA RGR: 3Q11 consolidated EBITDA was negatively affected by R$ 5.5 million, arising from the adjustment at an accounting entry in CEMAR (no cash affected) in RGR expenses referring to 1H11, part of Deductions from Operating Revenues. Thus, 3Q12 EBITDA grew by 7.5% over the 3Q11 adjusted EBITDA. 13
  • 14.
    Quaterly Results Net Income RGR: The adjustment of CEMAR’s RGR accounting entry, net of tax and minority interest, negatively impacted 3Q11’s Net Income by R$ 3.1 million. Considering this effect, 3Q12 NI was 13.4% higher than 3Q11 Adjusted NI. 14
  • 15.
    Debt: Schedule ofGross Debt Maturities Consolidated Gross Debt (100% CEMAR + 25% Geramar) 15
  • 16.
    Net Debt -Consolidated 100% CEMAR + 25% Geramar Net Debt (R$MM) and Net Debt/ EBITDA Net Debt Reconciliation (R$MM) (Last 12 months) 2.1 2.0 2.0 2.1 51.1 1.9 1,082.6 1,108.3 496.9 1,002.4 1,051.3 974.6 1,599.3 1,051.3 Gross Debt Net Cash Net Debt Regulatory 3Q11 4Q11 1Q12 2Q12 3Q12 Asset 16
  • 17.
    Net Debt –Pro-rata 65.11% CEMAR + 25% Geramar Net Debt (R$MM) and Net Debt/ EBITDA Net Debt Reconciliation (R$MM) (Last 12 months) 2.1 2.0 2.0 2.1 2.0 33.3 735.0 751.0 330.1 661.5 681.7 714.4 1,077.8 714.4 Gross Debt Net Cash Net Debt 3Q11 4Q11 1Q12 2Q12 3Q12 Regulatory Asset 17
  • 18.
    Capex - Equatorial ►CEMAR: In 3Q12, total capex reached R$166.7 million, of which R$116.2 million are own capex and R$50.5 million regarding the Light for All Program (PLPT). INVESTMENTS (R$MM) 3Q11 2Q12 3Q12 Chg. 9M11 9M12 Chg. CEMAR Own (*) 74.5 101.0 116.2 55.9% 181.0 291.0 60.8% Light For All Program 40.0 37.1 50.5 26.2% 124.5 132.1 6.1% Total 114.5 138.1 166.7 45.5% 305.5 423.2 38.5% Geramar Generation 0.1 0.0 0.1 -37.4% 0.1 0.3 270.3% TOTAL 114.6 138.1 166.8 45.5% 305.6 423.4 38.6% (*) Including indirect Light Fo r A ll P ro gram investments 18
  • 19.
    Contacts Eduardo Haiama CFO and IRO Thomas Newlands Investor Relations Telephone 1: +0 55 (21) 3206-6635 Telephone 2: +0 55 (21) 3217-6607 Email: ir@equatorialenergia.com.br Website: http://www.equatorialenergia.com.br/ir 19
  • 20.
    Disclaimer • This presentation may contain forward-looking statements, which are subject to risks and uncertainties, as they were based on the expectations of Company’s management and on available information. These prospects include statements concerning the Company’s current intentions or expectations for our clients; this presentation will also be available at our website www.equatorialenergia.com.br/ir and in the IPE system of the Brazilian Securities and Exchange Commission (CVM). • Forward-looking statements refer to future events which may or may not occur. Our future financial situation, operating results, market share and competitive positioning may differ substantially from those expressed or suggested by said forward-looking statements. Many factors and values that can establish these results are outside Company’s control or expectation. The reader/investor is advised not to completely rely on the information above. • The words “believe", “can", “predict", “estimate", “continue", “anticipate", “intend", “forecast" and similar words, are intended to identify estimates, which refer only to the date on which they were expressed. Hence, the Company has no obligation to update said statements. • This presentation does not constitute any offering, invitation or request of subscription offer or purchase of any marketable securities. And, this statement or any other information herein, does not constitute the basis for any contract or commitment of any kind. 20