There are several ways for a firm to increase profits:
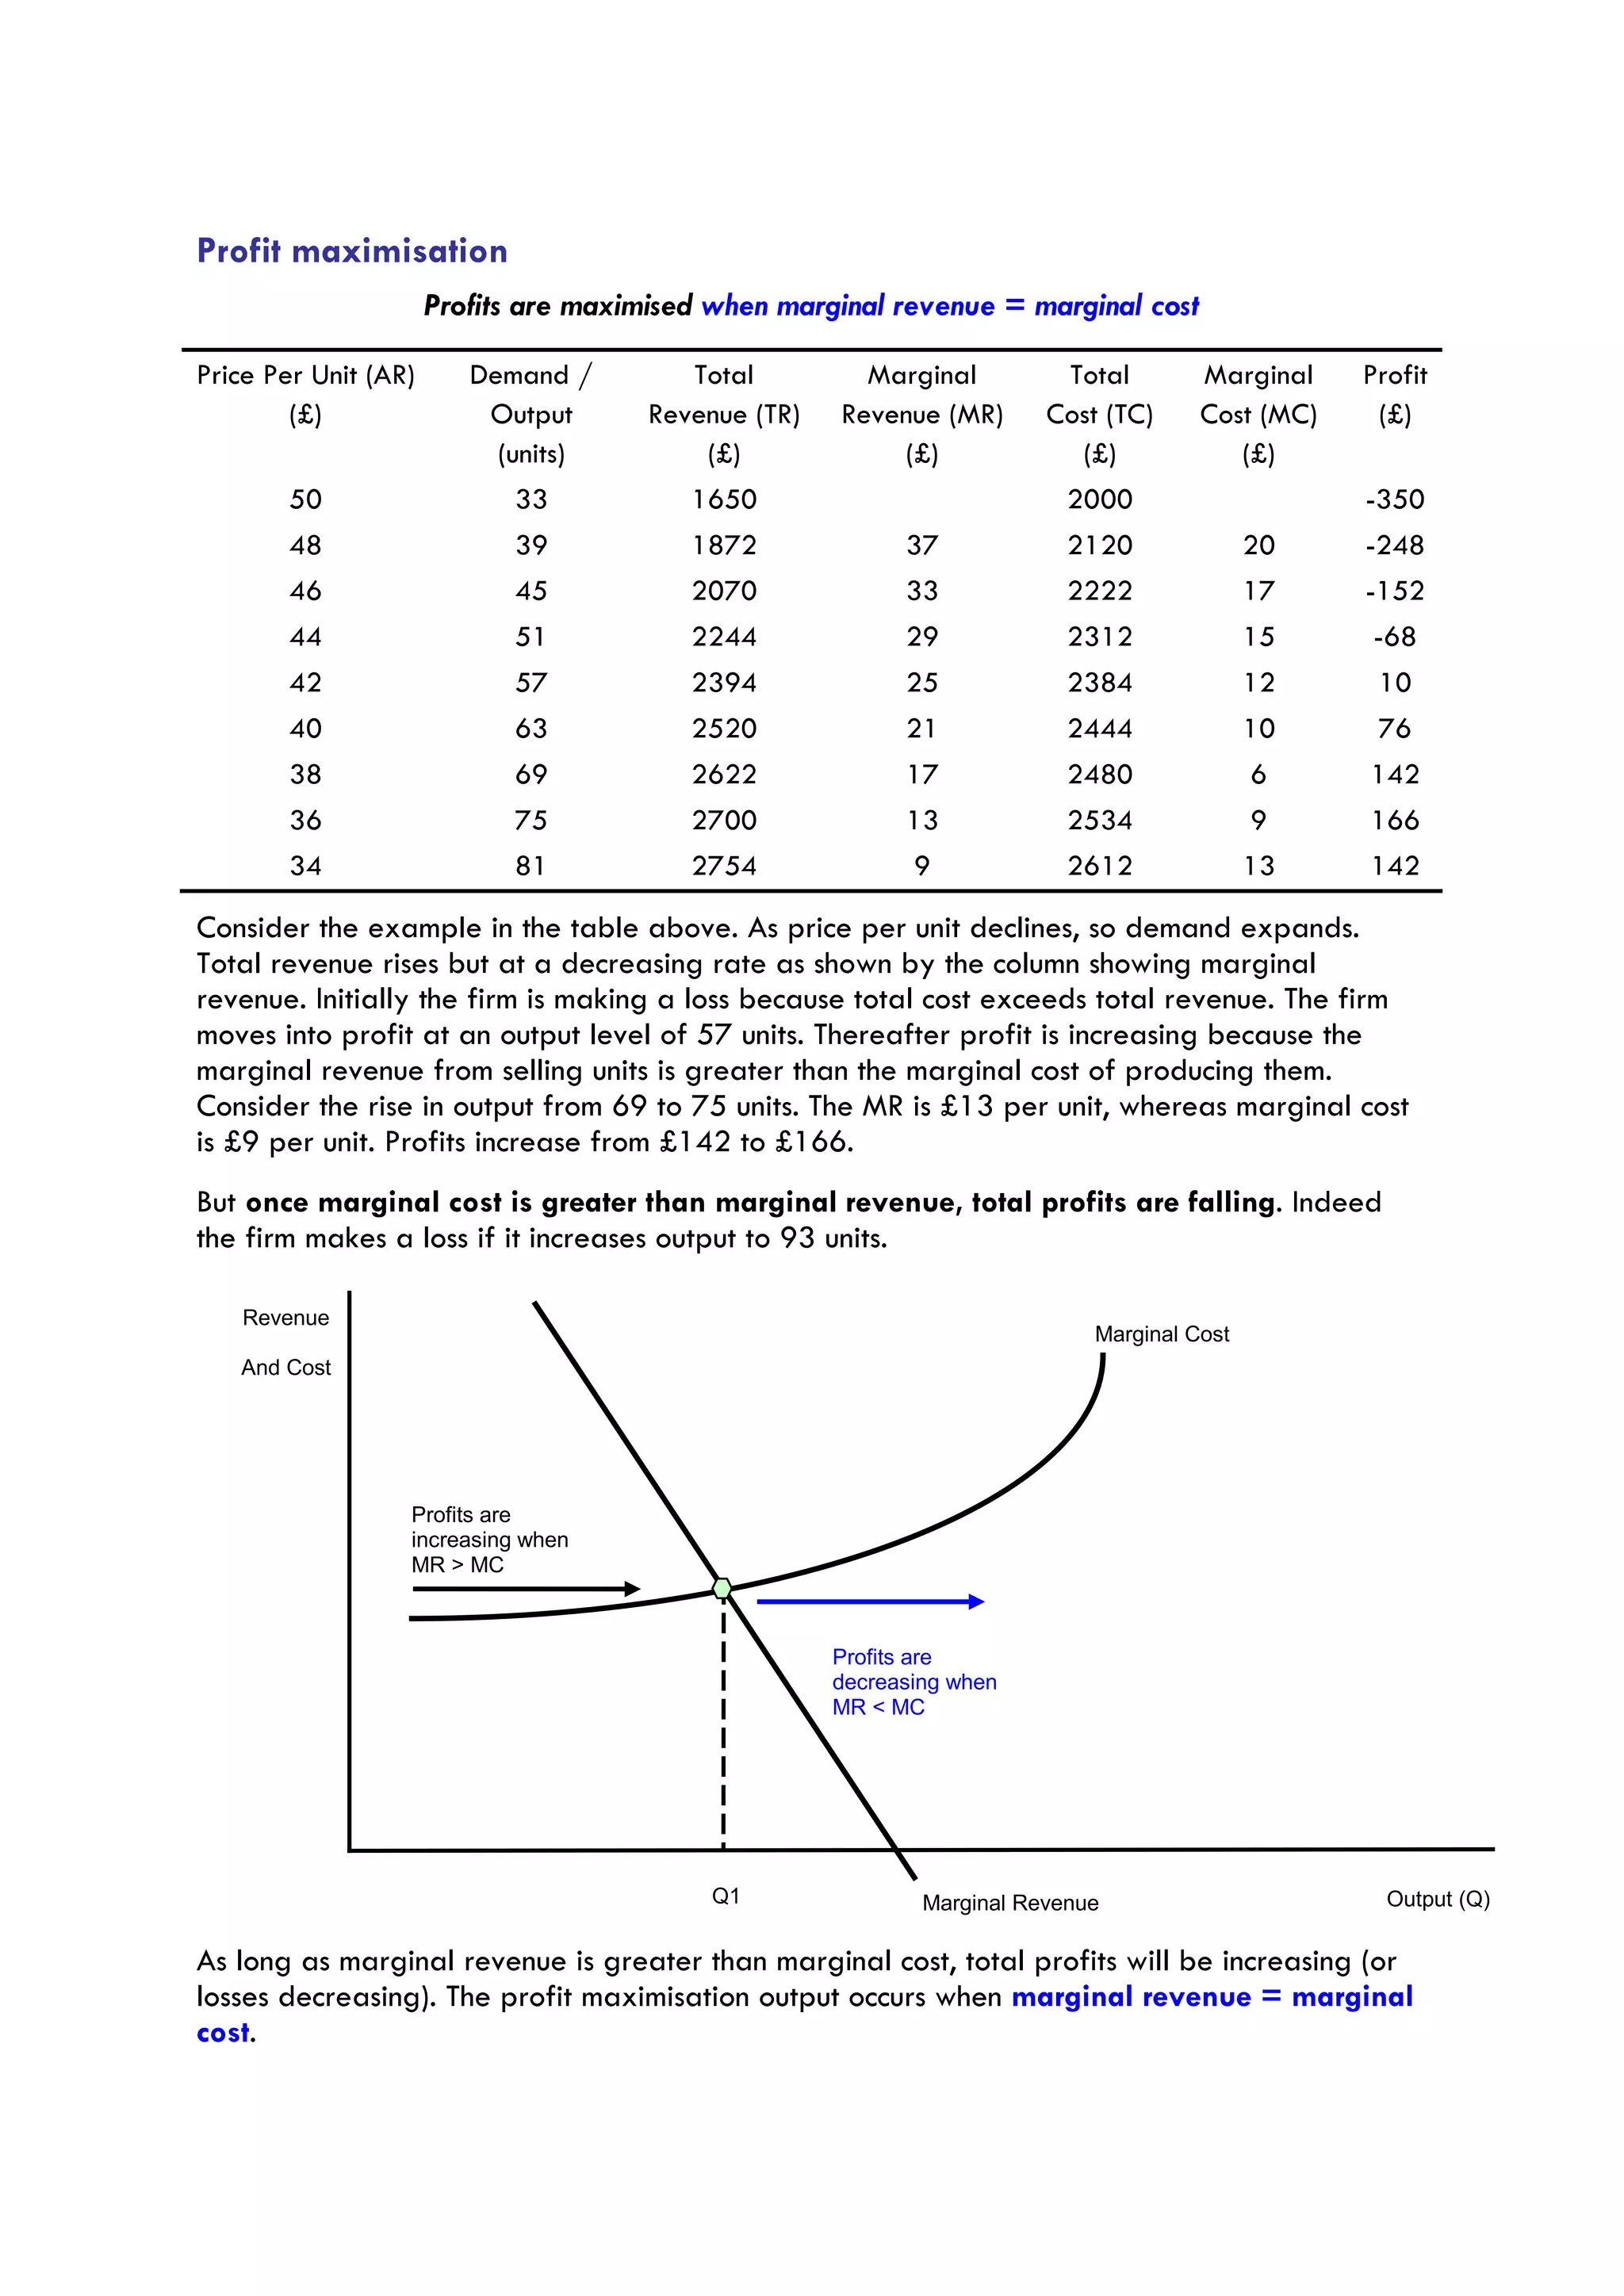
1. Increase output up to the point where marginal revenue equals marginal cost, which is the profit-maximizing level of output.
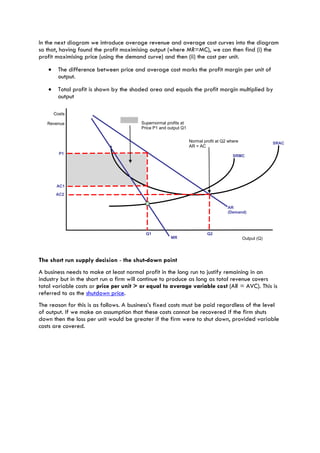
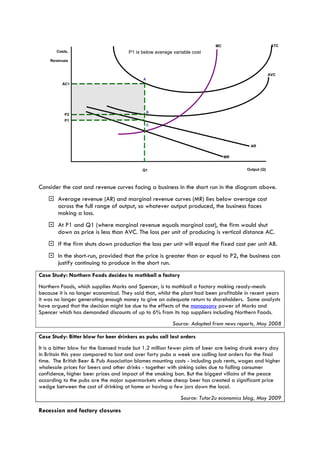
2. Reduce costs of production to lower the average cost curve and increase the profit margin.
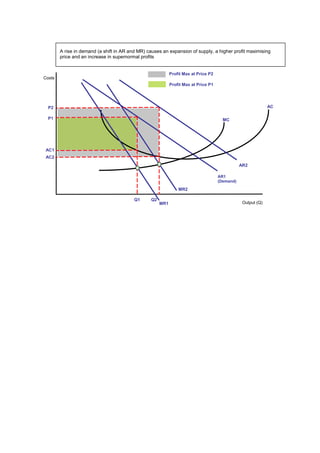
3. Shift the demand curve outward through marketing, innovation, or other means to increase the profit-maximizing price and output.